2679
Assessing inter-tract independence across microstructural metrics1Psychology, Cardiff University, Cardiff, United Kingdom
Synopsis
Keywords: Brain Connectivity, Brain Connectivity
We aimed to identify potential redundancies in microstructural measures between major white matter tracts and asked which microstructural metrics correlate most within a tract. Using a combination of microstructural imaging techniques, including diffusion imaging, relaxometry and quantitative magnetisation transfer imaging, we identified strong correlations between homologous left and right fasciculi in the cingulum bundles, inferior longitudinal fasciculi, uncinate fasciculi and arcuate fasciculi as well as similar patterns of tissue microstructure between heterologous tracts. However, corticospinal tracts showed weak correlations with other tracts and a unique pattern of inter-metric correlations, suggesting that summarising metrics across all tracts would be inappropriate.Introduction
Tractometry involves calculating summary metric values (e.g. mean) along white matter tracts and assumes statistical independence between tracts, with subsequent Type-I error correction. However, there is likely dependence between tracts, and important differences in microstructure may be missed because of over-correction for multiple comparisons. The same may be true for microstructural metrics, demonstrating redundancy between some tracts and crucial differences between others.We aimed to identify whether any patterns of co-dependency between major fasciculi for one microstructural metric were seen for other microstructural metrics, exploring potential redundancy between tracts, including between homologous left and right tracts and across regionally disperse tracts; and asked which microstructural metrics (e.g., radial diffusivity and myelin water fraction) correlate within a tract.
Methods
Data from 117 healthy adults (18-63 years; 62% female) were acquired using an ultra-strong gradient (300mT/m) 3T Siemens Connectom scanner and previously described protocols1: an MPRAGE; multi-component relaxometry, including T1-weighted SPGR, inversion recovery-prepped SPGR (SPGR-IR) and steady-state free precession (SSFP) images2; optimised quantitative magnetization transfer (qMT3) using a prototype turbo-flash sequence with 11 magnetization transfer (MT)-weighted images and one non-MT-weighted image4; and multi-shell diffusion-weighted MRI using a single-shot spin-echo, EPI sequence (TR/TE=3000/59ms) with anterior to posterior (AP) phase-encoding and 253 uniformly distributed encoding directions at b=200, 500, 1200, 2400, 4000 and 6000s/mm2, two leading non-diffusion-weighted (b0) images and 11 b0s dispersed throughout. Non-diffusion-weighted data were also collected with PA phase-encoding.Relaxometry data preprocessing included motion correction5, registration6, and calculation of B1, T1 and B0 maps7. mcDESPOT2 was used to estimate myelin water and intra/extra-cellular water in QUantitative Imaging Tools (QUIT)7. QMT data were corrected for motion and bias in FSL. Quantitative MT parameters, including the macromolecular proton (bound pool; BPF) fraction, were estimated in QUIT, using Ramani’s model8.
Diffusion data were corrected for thermal noise (MRtrix39), signal drift, slice-wise outliers10, susceptibility-induced distortions, motion and eddy current-induced distortions11-13 gradient non-linearity, and Gibbs ringing artefacts (MRtrix3). Tensors were independently fit voxelwise14 in DIPY15, yielding maps of fractional anisotropy (FA), axial diffusivity (AD), radial diffusivity (RD) and mean diffusivity (MD). The diffusion kurtosis representation was fit voxelwise16 in DIPY15,17 to obtain the kurtosis fractional anisotropy (KFA).
Fibre orientation distribution functions (fODFs) were calculated in MRtrix3 using multi-shell multi-tissue constrained spherical deconvolution (MSMT-CSD18). A composite hindered and restricted model of diffusion (CHARMED19) (regularised with these fODFs) was then used to generate the total restricted diffusion. Neurite density (intracellular volume fraction; ICVF) was calculated fusing the NODDI model20 in the Python implementation of Accelerated Microstructure Imaging via Convex Optimization (AMICO21).
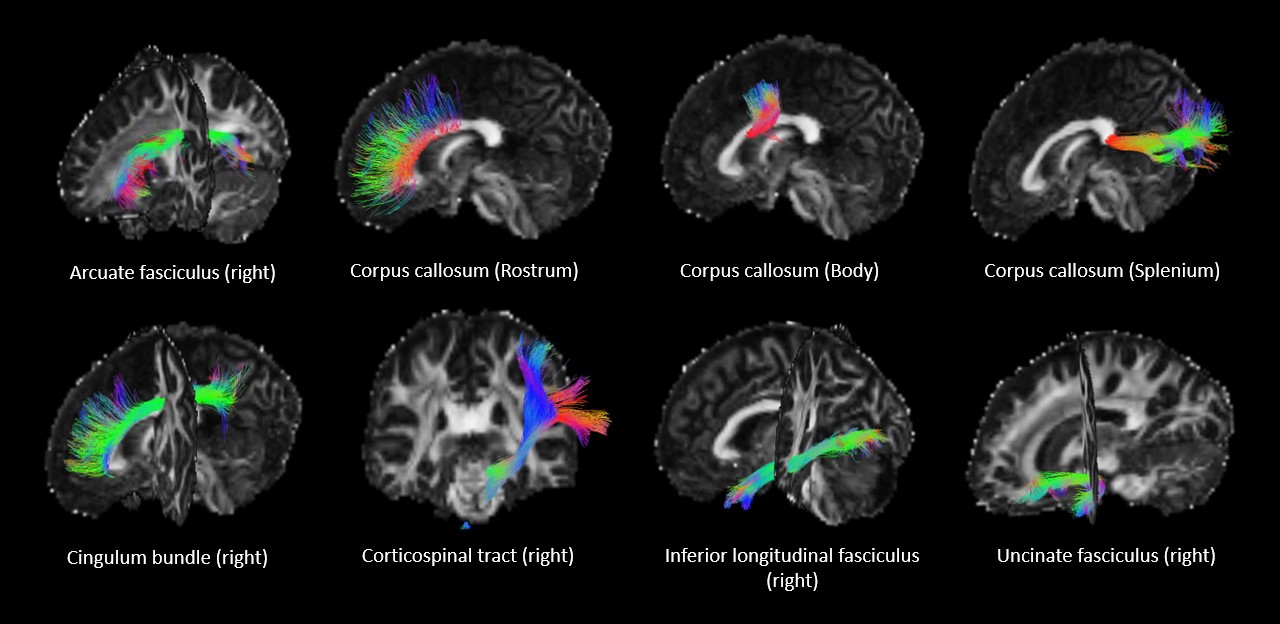
Thirteen major bundles were reconstructed from MSMT-CSD peaks using TractSeg22-24(Fig. 1), including the corpus callosum (rostrum, body, and splenium), cingulum bundles, corticospinal tracts, inferior longitudinal fasciculi, uncinate fasciculi, and arcuate fasciculus). MWF and BPF maps were linearly registered to diffusion space in FSL. Tractometry was performed in MRtrix3 by computing the mean values along each streamline; the mean of each bundle was then used in further analysis.
Statistical analysis: Pearson's correlation coefficients of mean values across tracts and across metrics were calculated in MATLAB. The false discovery rate was used to correct for multiple comparisons within each correlation matrix, in addition to adjustment of the alpha value (accounting for comparisons across multiple tracts/metrics) using the Bonferroni method.
Results
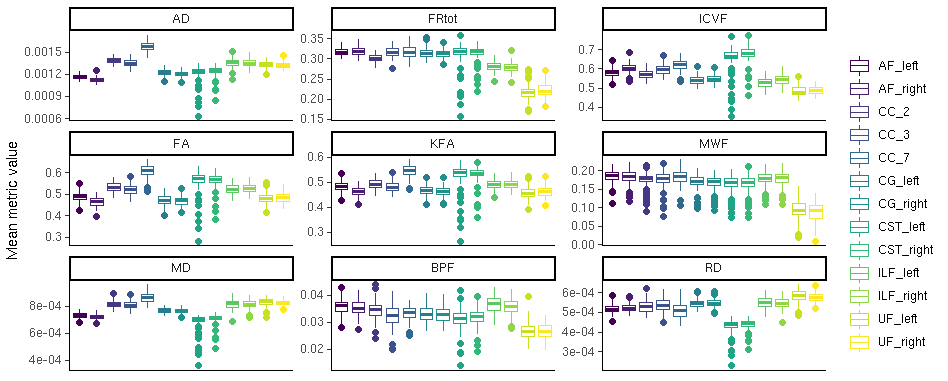
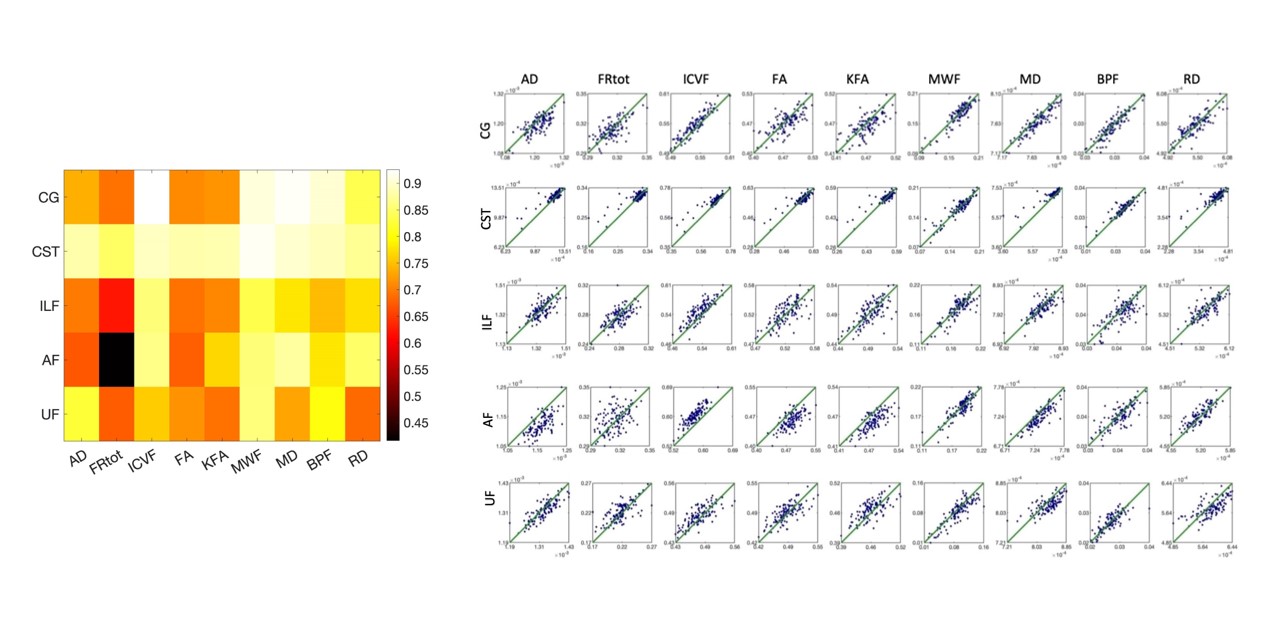
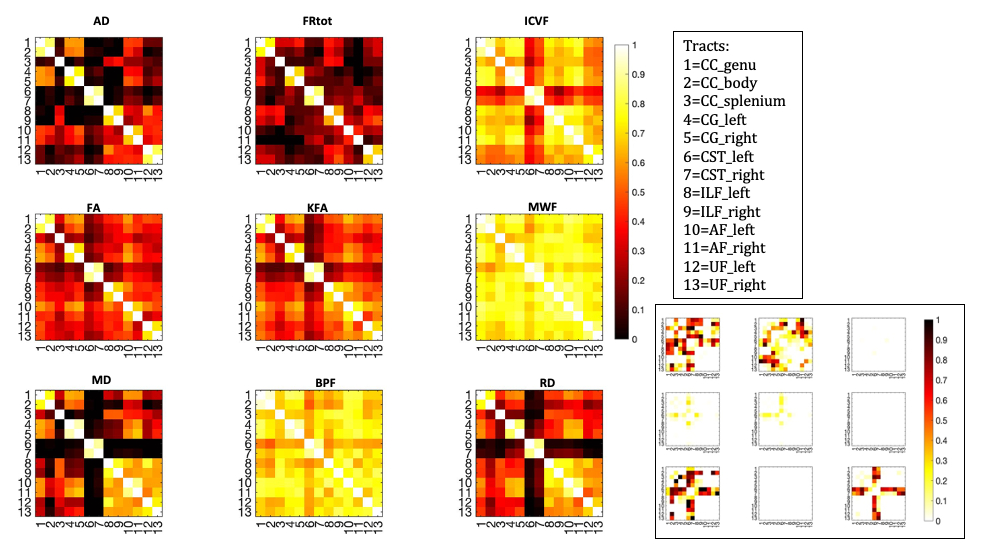
Fig.2 shows mean metric distributions across tracts. Across homologous left/right tract pairs, strong correlations were observed across all metrics for the CST and across all tracts for MWF and ICVF (figure 3). Total restricted diffusion signal fraction demonstrated the lowest correlation between tract pairs, particularly in the arcuate and inferior longitudinal fasciculi.Figure 4 shows between-tract correlations for each metric. Strong correlations were observed across most or all tracts for MWF, BPF and ICVF. Across these metrics, tracts demonstrating the highest degrees of similarity were CC, cingulate bundles, ILF and AF, with CSTs consistently exhibiting the weakest correlations with all other tracts.
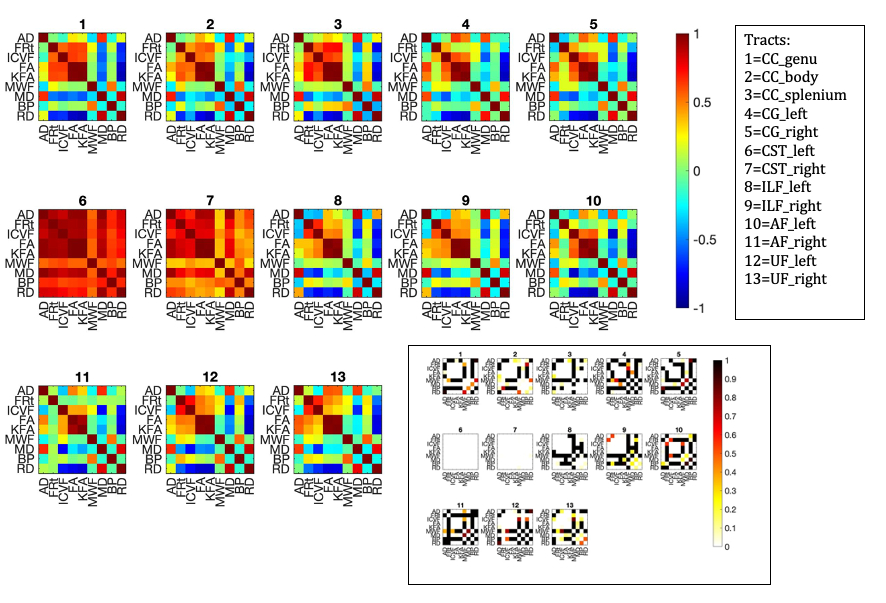
Figure 5 shows the strength of correlations between different microstructural metrics. Calculating the similarity between whole correlation matrices using the dot product, microstructural metrics were shown to correlate with each other similarly across all tracts (Pearson's r=0.8-0.98), except in CSTs (r=0.3-0.5), which only correlated highly with each other.
Discussion and Conclusions
Understanding how major tracts and imaging metrics covary can help identify patterns in white matter development and degradation and allow for more efficient handling of microstructural imaging data. Here we extend earlier work that identified similarities in diffusion metrics between tracts25. We show that microstructural metrics including diffusion tensor, diffusion kurtosis, myelin water, macromolecular proton fraction and neurite density exhibit similar patterns across many of the major fasciculi but that averaging over all tracts would be inappropriate. Critically, CSTs showed weak correlations with all other tracts and a unique pattern of inter-metric correlations, suggesting that measurements along these tracts differ substantially from others we measured. This may be partly due to the CST’s vulnerability to partial volume with crossing fibres from the SLF, arcuate fasciculus and CC. Future work will extend to all major fasciculi in the brain, with the aim of identifying sets of tracts and metrics that can be analysed together to improve statistical power and better inform our understanding of the structural connectivity in the brain.Acknowledgements
The data were acquired at the UK National Facility for In Vivo MR Imaging of Human Tissue Microstructure funded by the EPSRC (grant EP/M029778/1), and The Wolfson Foundation, and supported by a Wellcome Trust Investigator Award (096646/Z/11/Z) and a Wellcome Trust Strategic Award (104943/Z/14/Z).References
1. Koller K, Rudrapatna SU, Chamberland M, et al. MICRA: Microstructural image compilation with repeated acquisitions. NeuroImage. 2021; 225:117406. doi: 10.1016/j.neuroimage.2020.117406.
2. Deoni SCL, Matthews L, Kolind SH. One component? Two components? Three? The effect of including a nonexchanging “free” water component in multicomponent driven equilibrium single pulse observation of T1 and T2. Magn. Reson. Med. 2013; 70: 147-154. https://doi.org/10.1002/mrm.24429
3. Metzler-Baddeley C, Foley S, De Santis S, et al. Dynamics of white matter plasticity underlying working memory training: Multimodal evidence from diffusion MRI and relaxometry. J. Cogn. Neurosci. 2017;29(9):1509-20.
4. Cercignani M, Alexander DC. Optimal acquisition schemes for in vivo quantitative magnetization transfer MRI. Magn. Reson. Med.: An Official Journal of the International Society for Magnetic Resonance in Medicine. 2006;56(4):803-10.
5. Jenkinson, M., Bannister, P., Brady, et al. Improved Optimisation for the Robust and Accurate Linear Registration and Motion Correction of Brain Images. NeuroImage. 2002; 17(2), 825-841.
6. Jenkinson M, Smith S. A global optimisation method for robust affine registration of brain images. Med. Image Anal. 2001;5(2):143-56.
7. Wood. QUIT: QUantitative Imaging Tools. J. Open Source Softw. 2018 3(26), 656, https://doi.org/10.21105/joss.00656
8. Ramani A, Dalton C, Miller DH, et al. Precise estimate of fundamental in-vivo MT parameters in human brain in clinically feasible times. Magnetic Resonance. Imaging. 2002;20(10):721-31.
9. Tournier JD, Smith R, Raffelt D, et al.MRtrix3: A fast, flexible and open software framework for medical image processing and visualisation. NeuroImage. 2019;;202:116137.
10. Sairanen V, Leemans A, Tax CM. Fast and accurate Slicewise OutLIer Detection (SOLID) with informed model estimation for diffusion MRI data. NeuroImage. 2018;;181:331-46.
11. Andersson JL, Skare S, Ashburner J. How to correct susceptibility distortions in spin-echo echo-planar images: application to diffusion tensor imaging. NeuroImage. 2003;;20(2):870-88.
12. Andersson JLR, Sotiropoulos SN. An integrated approach to correction for off-resonance effects and subject movement in diffusion MR imaging. NeuroImage. 2016;;125:1063-1078. doi: 10.1016/j.neuroimage.2015.10.019. Epub 2015 Oct 20. PMID: 26481672; PMCID: PMC4692656.
13. Smith SM, Jenkinson M, Woolrich MW, et al. Advances in functional and structural MR image analysis and implementation as FSL. NeuroImage. 2004;;23:S208-19.
14. Basser PJ, Mattiello J, LeBihan D. MR diffusion tensor spectroscopy and imaging. Biophys J. 1994;66(1):259-67. doi: 10.1016/S0006-3495(94)80775-1. PMID: 8130344; PMCID: PMC1275686.
15. Garyfallidis E, Brett M, Amirbekian B et al. DIPY, a library for the analysis of diffusion MRI data. Front. Neuroinform. 2014;vol.8, no.8.
16. Jensen JH, Helpern JA, Ramani A, et al. Diffusional kurtosis imaging: the quantification of non-gaussian water diffusion by means of magnetic resonance imaging. Magn. Reson. Med. 2005;53(6):1432-40. doi: 10.1002/mrm.20508. PMID: 15906300.
17. Henriques RN, Correia MM, Marrale M, et al. Diffusional kurtosis imaging in the diffusion imaging in python project. Front. Hum. Neurosci. 2021; 15:675433.
18. Jeurissen B, Tournier JD, Dhollander T, et al. Multi-tissue constrained spherical deconvolution for improved analysis of multi-shell diffusion MRI data. NeuroImage. 2014; ;103:411-26
19. Assaf Y, Basser PJ. Composite hindered and restricted model of diffusion (CHARMED) MR imaging of the human brain. NeuroImage. 2005;;27(1):48-58. doi: 10.1016/j.neuroimage.2005.03.042. PMID: 15979342.
20. Zhang H, Schneider T, Wheeler-Kingshott CA, et al.. NODDI: practical in vivo neurite orientation dispersion and density imaging of the human brain. NeuroImage. 2012;61(4):1000-16. doi: 10.1016/j.neuroimage.2012.03.072.
21. Daducci A, Canales-Rodríguez EJ, Zhang H, et al. . Accelerated microstructure imaging via convex optimization (AMICO) from diffusion MRI data. NeuroImage. 2015; 105:32-44.
22. Wasserthal J, Neher PF, Maier-Hein KH. Tract orientation mapping for bundle-specific tractography. International Conference on Medical Image Computing and Computer-Assisted Intervention. 2018; pp. 36-44. Springer, Cham.
23. Wasserthal J, Neher PF, Hirjak D, et al. Combined tract segmentation and orientation mapping for bundle-specific tractography. Med. Image Anal. 2019;58:101559.
24. Wasserthal J, Neher P, Maier-Hein KH. TractSeg-Fast and accurate white matter tract segmentation. NeuroImage. 2018;183:239-53.
25. Wahl M, Li YO, Ng J, LaHue SC, Cooper SR, Sherr EH, Mukherjee P. Microstructural correlations of white matter tracts in the human brain. Neuroimage. 2010;51(2):531-41.
Figures