2677
ROI-dependence in clarifying metabolic connectivity mapping within default-mode network using simultaneous FDG PET and BOLD-based fMRI1Department of Radiology, Taipei Veterans General Hospital, Taipei, Taiwan, 2Institute of Brain Science, National Yang Ming Chiao Tung University, Taipei, Taiwan, 3Department of Medical Research, Taipei Veterans General Hospital, Taipei, Taiwan
Synopsis
Keywords: Brain Connectivity, PET/MR, metabolic connectivity mapping
Metabolic connectivity mapping (MCM) is a unique application of simultaneous PET/fMRI for solving the effective connectivity (EC) of brain circuits. Reproducibility of MCM was critical after the initial report. By applying the released database of MONASH (Melbourne, Australia), consistent EC among bilateral inferior parietal lobules (IPL) and posterior cingulate cortices (PCC), as nodes within default mode network (DMN), was identified using MCM with the statistic-based approach. One-way EC using dedicated ROI (regions of interest) derived from grouped ICA (independent component analysis) outperformed the atlas-based ROIs of DMN.Introduction
One of the major applications using simultaneous PET/fMRI was to solve the effective connectivity (EC) of brain circuits, called metabolic connectivity mapping (MCM). With application of the released database of MONASH (Melbourne, Australia) [2], consistent EC among bilateral inferior parietal lobules (IPL) and posterior cingulate cortices (PCC), within the extension of DMN (default mode network) was identified using MRC as published results derived from statistic-based approaches (e.g. dynamic causal network) [3]. In this study, effect of ROI (region of interest) for calculating EC via MCM was demonstrated using (1) grouped ICA (independent component analysis) for individual data sets and (2) ROIs of DMN template (RSN20) [4].Database and Methods
Released database of MONASH (Scientific Data 2020; https://doi.org/10.1038/s41597-020-00699-5) was downloaded using AWS CLI. By using a 3T PET/MR, data of 27 subjects included 6 sessions of resting-state BOLD (blood-oxygenation-level-dependence)-based fMRI (rs-fMRI, NR-242, matrix size : isotropic 3x3x3 mm), list-mode PET (225 bin data derived from 356 bin data with matching the timing of fMRI session, matrix size : 1.4x1.4x2 mm), field mapping and structural MRI (T1-weighted images, matrix size : isotropic 1x1x1 mm). Comprehensive preprocessing of fMRI and PET was implemented (e.g. field mapping, wavelet-based despiking, fMRI-based correction of head motion for PET data, etc.). ROIs of DMN were identified using grouped ICA (GIFT, Group ICA of fMRI Toolbox, https://trendscenter.org/software/gift/) of re-fMRI (corrected p < 0.05, family-wised correction) or published atlas of DMN (RSN20, z values > 3) [4]. By using full session of PET, correlation coefficients of MCM among ROIs of DMN, e.g. right IPL, left IPL and PCC, were obtained for every session of rs-fMRI. Statistics were obtained using two-tailed two-sample t test or paired two-sample t test.Results
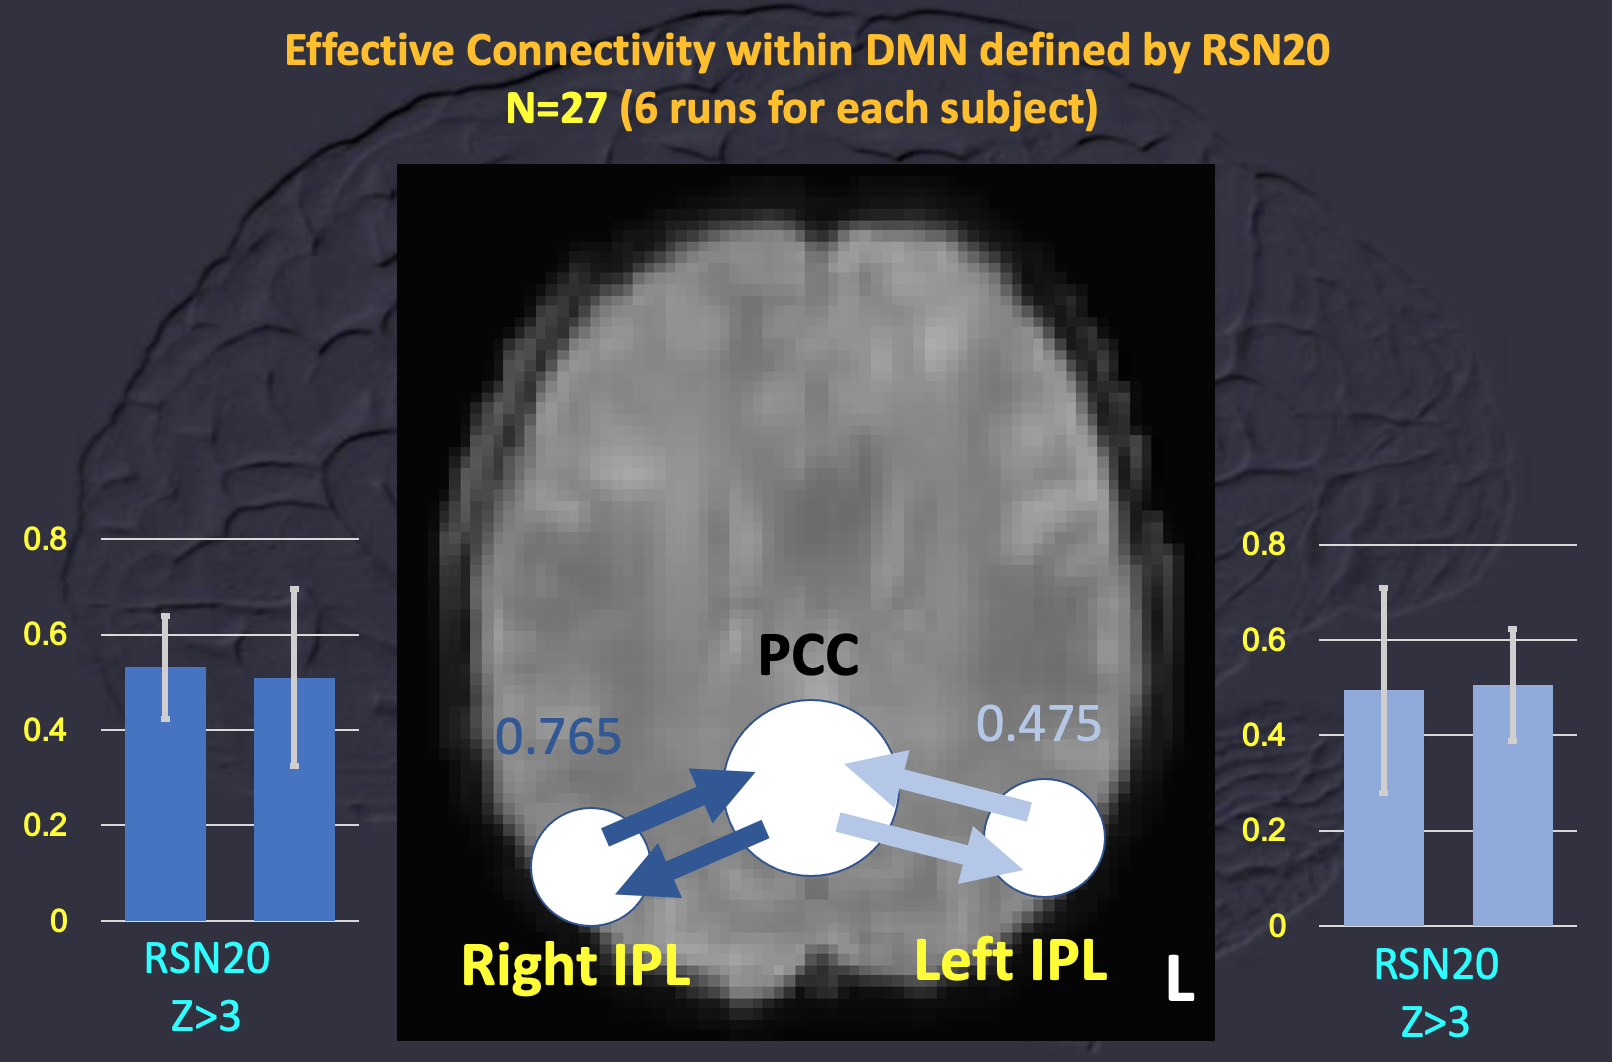
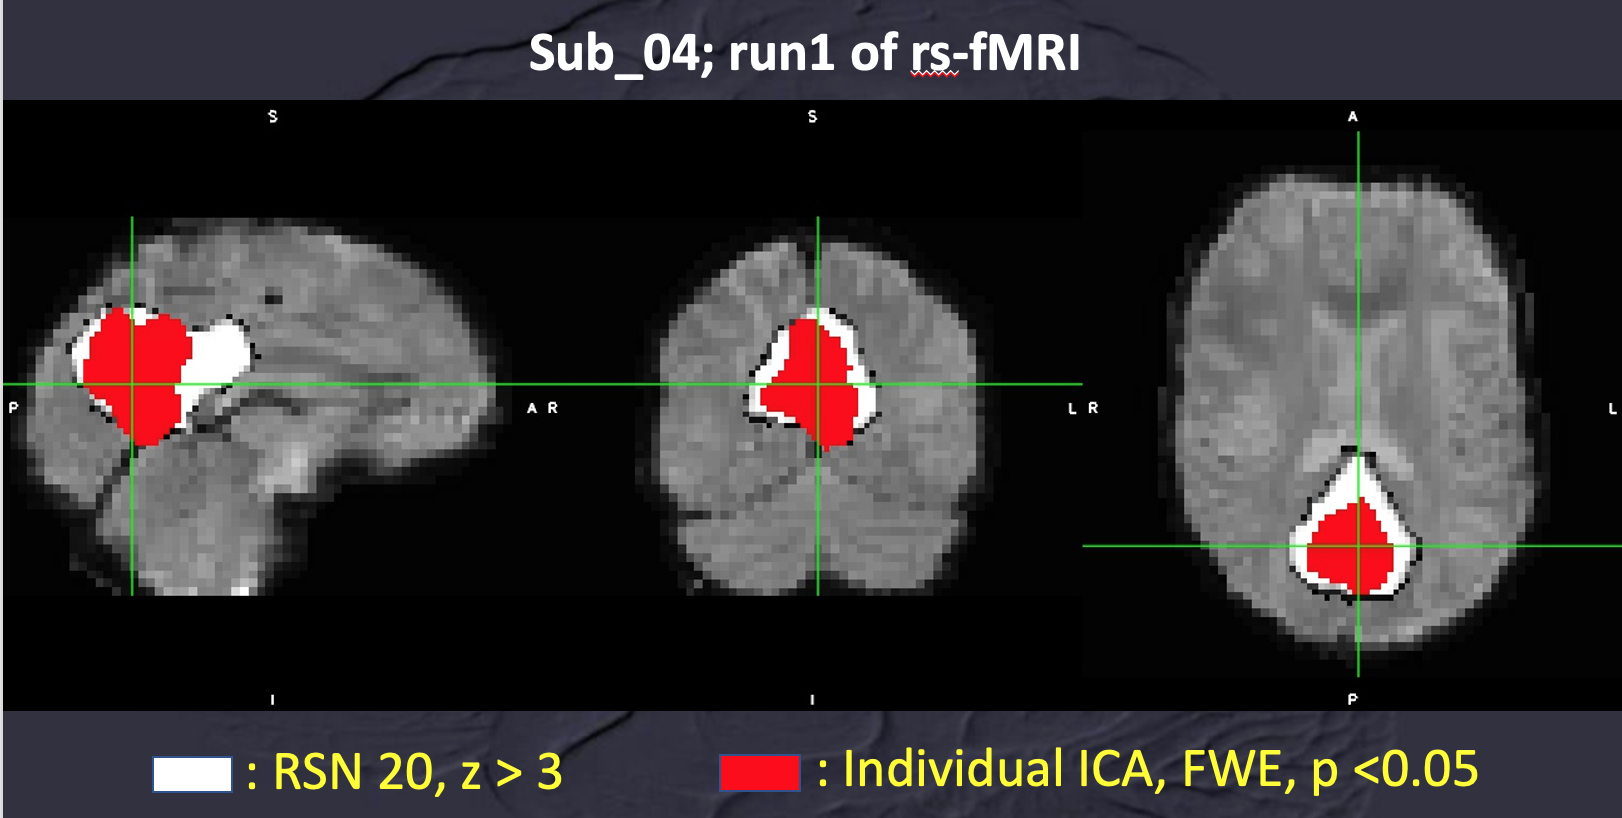
Data of 27 subjects were used for calculating MCM with comparison to the results of 8 subjects with less head motion during rs-fMRI (translation < 1 mm and rotation < 1 degree). With the DMN, MCM using RSN20-based ROIs showed no significant difference of EC among the left IPL, right IPL and PCC with family-wised correction of multiple comparison. So, all data of 27 subjects were applied for MCM. Using ROIs derived from grouped ICA of 6-session rs-fMRI of each individual (Figure 1), MCM within DMN (left IPL, right IPL and PCC) showed “ONE-WAY” EC of “from left IPL to PCC” and “from right IPL to PCC” (uncorrected p values < 10^-15) when no significant EC was identified for reversed connection. But reciprocal EC of “between left IPL and PCC” and “between right IPL and PCC” was noted using RSN20-based ROIs (uncorrected p values > 0.4, Figure 2). Spatial difference of ROIs was demonstrated for one subject as Figure 3.Discussion and Conclusion
By using dedicated grouped ICA of each individual, one-way EC within DMN using MCM, e.g. “from left IPL to PCC” and “from right IPL to PCC”, echoed the published results using dynamic causal modeling of rs-fMRI [3]. Selection of ROIs for MCM showed impact on the results of MCM regarding to EC. And present pipeline of MCM can be applied for single trial or whole-brain network approach.Acknowledgements
Authors thank Dr. S.D. Jamadar for providing the details of PET/fMRI data.References
[1] Riedl, V et al. Metabolic connectivity mapping reveals effective connectivity in the resting human brain, PNAS, 2015 113:428; doi: 10.1073/pnas.15137521132. [2] Jamadar, S.D. et al. Simultaneous BOLD-fMRI and constant infusion FDG-PET data of the resting human brain, Scientific Data, 2020 3:363; doi: 10.1038/s41597-020-00699-53. [3] Sharaev, M.G. et al. Effective Connectivity within the Default Mode Network : Dynamic Causal Modeling of Resting-State fMRI Data, Front Hum Neurosci, 2016 10:14;doi: 10.3389/fnhum.2016.00014. eCollection 2016. [4] Smith, S.M. et al. Correspondence of the brain’s functional architecture during activation and rest, PNAS, 2009 106:13040; doi: 10.1073/pans.0905267106
Figures