2676
Exploring effect of rTMS at SMA in Parkinson’s Disease- An fMRI-MVPA study.1Dept. of Neurology, AIIMS, Delhi, India, 2Dept of Nuc. Mag. Res, AIIMS, Delhi, India, 3Medanta, The Medicity, Delhi, India, 4Dept of Neurology, AIIMS, Delhi, India, 5Dept. of Biostatistics, AIIMS, Delhi, India, 6Dept. of Neurology, Fortis Hospitals, Vasant Kunj, Delhi, India
Synopsis
Keywords: Brain Connectivity, fMRI (task based), Parkinson's Disease, Supplementary Motor Area, Transcranial Magnetic Stimulation
Transcranial Magnetic stimulation alters cortical connectivity in Parkinson’s disease (PD) imparting clinical benefits. The mechanisms by which this occurs remain unexplored. In this study, Multivariate pattern analyses of task-based connectivity was carried out to understand the effects of rTMS in PD. Visuospatial task based functional MRI was acquired before and after stimulation sessions. Correlation matrices revealed an increased connectivity between left supplementary motor area (SMA) and left primary motor area (M1), suggesting an improvement in the motor network.Background
Parkinson’s disease (PD) is a progressive disorder characterized by a clinical spectrum of motor as well as non-motor symptoms1. These occur due to neuronal degeneration in basal ganglia, which eventually alter cortical connectivity. Repetitive Transcranial Magnetic Stimulation (rTMS) is reported to modulate the cortical plasticity, but the mechanisms involved are unexplored2. To understand the mechanisms by which rTMS would affect the cortical connectivity, we studied the connectivity patterns using multivariate pattern analyses in PD.Methods
PD subjects (N=16) were screened according to the United Kingdom PD brain bank criteria. The study was a type of sham controlled rTMS class 2 type. Left supplementary motor area (SMA, site of stimulation) was localized using 10-20 EEG system3 and 3000 pulses of 5 Hz were delivered per session. Four sessions of sham (once a week) were followed by 4 sessions of real (one session/week). rTMS was delivered with 70 mm figure of 8 coil (D70-AFC-3910/3950 for real/sham sessions, Rapid 2 Plus stimulator, Magstim Co, Ltd, UK). Sessions were delivered at 100% RMT (resting motor threshold) which was estimated prior to all the sessions. Outcomes were assessed with UPDRS (Unified Parkinson’s disease rating scale), PDQ 39 (PD Questionnaire-39) and visuospatial fMRI task. A 3T MRI scanner (Achieva, Philips Medical Systems, The Netherlands) with a 32-channel head coil was used. The functional scans were acquired with single-shot echo-planar imaging (EPI), 29 transverse slices =5 mm (0mm slice gap), interleaved, reconstruction matrix: 128, flip angle = 90°, fold-over direction: Right to left (RL), field of view (FOV) = 240 mm (RL); 232 mm (AP); with TR/TE = 2000/30 ms. For fMRI task, 6 alternating active and rest blocks were designed. During rest, the subjects didn’t respond. During active, a set of 8 images of a corridor (4 of the right turn and 4 of the left turn) were randomly presented. Subjects responded whether the turn was towards the right or left by pressing a button with the respective hand (using an MRI compatible response pad -Lumina LP 400, Cedrus Inc., USA). Task was presented using E-Prime software (version 1.0, Psychology Software Tools, USA) and an E-sys IFIS system (Philips Medical Systems, The Netherlands). A 3D T1-weighted was acquired for co-registration. Functional data were analysed using Conn21.a. Pre-processing included realignment, outlier detection (using ART-Artefact Detection Tool), co-registration (to T1), normalization (to MNI-Montreal neurological institute template) and smoothing (kernel of FWHM=8), denoising (band-pass filter= 0.008 to 0.09 Hz)4. Task based connectivity (TBC) connectivity maps were computed from the active blocks of the fMRI timeseries as the Fisher-transformed bivariate correlation coefficients. Left SMA (x = -5, y = -3, z = 56 mm) which was the site of rTMS was the seed region. Multivariate pattern analysis (MVPA) correlation maps were generated using the significant spatial features of TBC map using singular value decomposition5. A group MVPA pipeline was then run with default 64 principal component analysis (PCA) components to characterize the connectivity correlation structure. Four factors with 64 dimensionality reduction were used and F test was applied across the components to test for whole brain connectivity differences. A voxel threshold of p uncorrected <0.05, cluster threshold punc =0.01 were used6. Clinical scores were analyzed using SPSS (version 22.0, IBM Corp, USA). Change of score was defined as differences from the baseline (at sham and real) and within group assessment with paired-t test/ Wilcoxon signed rank was done to compare ‘change at sham’ to ‘change at real’.Results
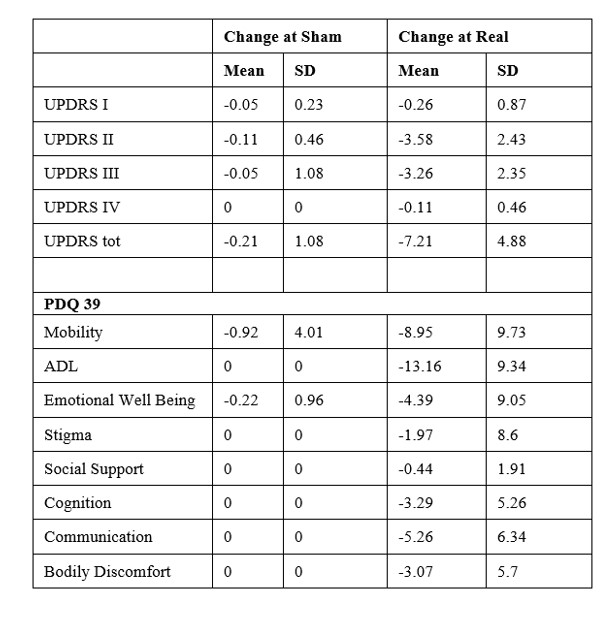
16 subjects were enrolled with age (years) = 60.57 ± 8.21 (mean±sd), duration of disease (years) = 5.47 ± 3.06 and age at onset (years) = 55.1 ± 7.28. UPDRS II (p<0.001), UPDRS III (p<0.001) decreased along with mobility (p=0.001) and ADL (p<0.001), emotional wellbeing (p=0.04), cognition (p=0.014), communication (p=0.007) and bodily discomfort (p=0.042) (Figure 1, Table 1).At baseline [T (15)>7.07, k ≥1993], activations were observed at a cluster formed by bilateral SMA, pre-central gyrus (PreCG), bilateral superior frontal gyrus (SFG) and para cingulate (PaCiG). After sham [T (15)>7.27, k ≥1424], a cluster formed by bilateral SMA, SFG, PreCG, and PaCiG showed significant activations. After real [T (15)>7, k ≥ 14], multiple significant clusters were observed in left PreCG and post central gyrus (Post CG), bilateral SMA, PreCG, SFG and PaCiG (Figure 2).
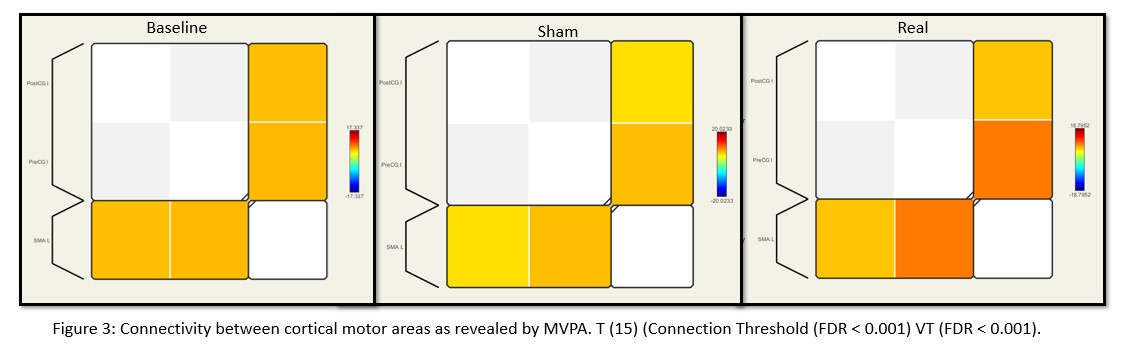
In MVPA, with Real vs sham [F (3,45)>6.45 k ≥ 7 (voxel threshold p uncorrected <0.001, cluster threshold p unc =0.05)] significant activity was seen at right SFG, fusiform cortex, lingual gyrus. Real session revealed significant activity in right precentral gyrus, right SFG, right cerebellum, right thalamus [F (3,45)>6.45 k ≥ 12] with respect to that at baseline (Figure 3).
Discussion
TBC revealed a slight increase in clusters size after 4 sessions of real stimulation as compared to that of baseline and sham. Increased cluster size signifies an increase in the functioning of the cortical areas. An increased connectivity was observed in RRC matrix between left SMA and left PreCG, i.e the primary motor area. This could be possibly because of an increased cross talk between ipsilateral SMA and M1.Conclusion:
Multivariate pattern analyses can be robustly used to infer effects of brain stimulation on functional connectivity in PD.Acknowledgements
No acknowledgement found.References
1. Y., B.-S. & K., S. Idiopathic parkinsons disease: Epidemiology, diagnosis and management. British Journal of General Practice 45, 261–268 (1995).
2. Arias-Carrión, O. Basic mechanisms of rTMS: Implications in Parkinson’s disease. Int Arch Med (2008) doi:10.1186/1755-7682-1-2.
3. Jacobs, J. V., Lou, J. S., Kraakevik, J. A. & Horak, F. B. The supplementary motor area contributes to the timing of the anticipatory postural adjustment during step initiation in participants with and without Parkinson’s disease. Neuroscience 164, 877–885 (2009).
4. Whitfield-Gabrieli, S. & Nieto-Castanon, A. Conn: A Functional Connectivity Toolbox for Correlated and Anticorrelated Brain Networks. Brain Connect (2012) doi:10.1089/brain.2012.0073.
5. Haxby, J. v. Multivariate pattern analysis of fMRI: The early beginnings. Neuroimage 62, 852 (2012).
6. Nieto-Castanon, A. Brain-wide connectome inferences using functional connectivity MultiVariate Pattern Analyses (fc-MVPA). (2022) doi:10.48550/arxiv.2206.06951.
Figures
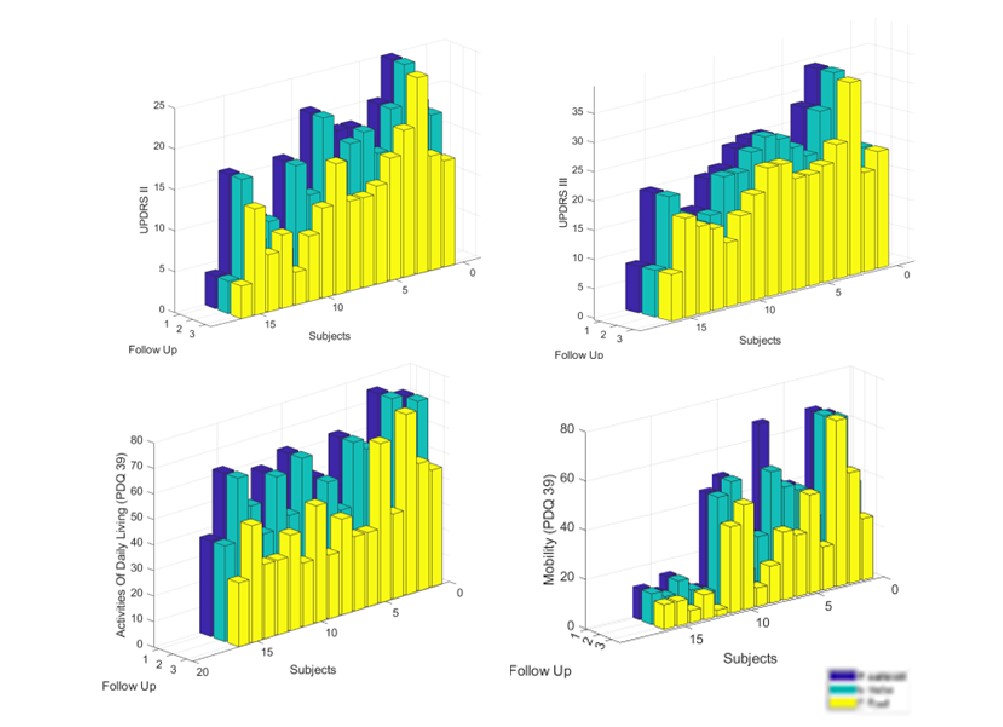
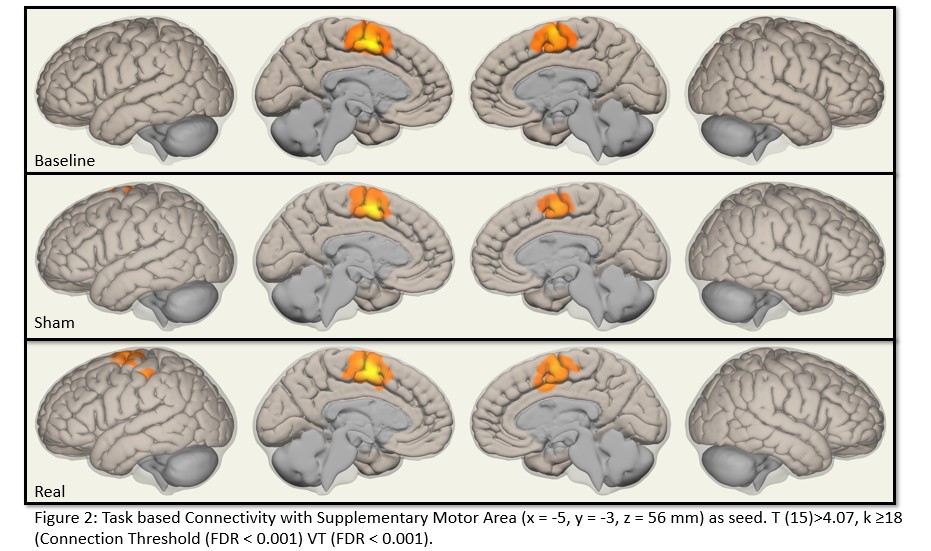
Figure 2: Task based Connectivity with
Supplementary Motor Area (x = -5, y = -3, z = 56 mm) as
seed. T (15)>4.07, k ≥18 (Connection Threshold (FDR < 0.001) Voxel Threshold (FDR < 0.001).