2674
Association of Attention with Brain Global Efficiencies at Rest: a Dynamic ASL and BOLD fMRI Comparison Study1Department of Computer Science, State University of New York at Binghamton, Binghamton, NY, United States, 2College of Biomedical Engineering & Instrument Science, Zhejiang University, Hangzhou, China, 3Department of Psychology, State University of New York at Binghamton, Binghamton, NY, United States, 4Department of Psychology, Cornell University, Ithaca, NY, United States, 5Cornell MRI Facility, Cornell University, Ithaca, NY, United States
Synopsis
Keywords: Brain Connectivity, Arterial spin labelling
We evaluated the relationship between attention levels and brain global efficiencies. This relationship was compared with brain global efficiencies measured with dynamic ASL (dASL) and with multi-echo (ME) BOLD fMRI. We found significantly greater correlation between attention levels (reflected by P3 properties when performing an attention task) and brain global efficiencies based on rsFC using dASL than those using ME BOLD fMRI, indicating that dASL can offer more accurate global neural signal fluctuations.Introduction
Blood oxygenation level dependent (BOLD) functional MRI (fMRI) signals have been shown to exhibit widespread, positive correlation with neural signals measured with local field potentials (LFP) at a single cortical site, indicating the global component of BOLD signal fluctuations is tightly coupled with underlying neural activity (1). We have shown that signal fluctuations from dynamic arterial spin labeling (dASL) are globally correlated and their power spectra are within the range of brain neural networks (2). Recently, brain global efficiencies and brain attention levels, based on resting-state functional connectivity and event-related potentials (ERPs) using EEG, were demonstrated to be closely related (3,4). To understand neural mechanism in neuropsychiatric disorders involving attentional impairments (e.g., ADHD), it is crucial to find a sensitive resting-state trait measure to index a person’s attention level. Here, we compared the performance of brain global efficiencies using dASL and multi-echo (ME) BOLD (5,6), in terms of their correlations with brain attention levels.Methods
We used the resting-state dASL, resting-state ME BOLD and task EEG data acquired at two time points from ten healthy college students (19.20 ± 0.28 years old) in a meditation study retrospectively.Task EEG data were collected outside the scanner using a 128-channel EEG net (EGI Inc.). A visual oddball paradigm was performed to measure P3 with two types of visual stimuli, 20% of ‘X’ (target) and 80% of ‘O’ (standard). Pseudo-continuous arterial spin labeling (PCASL) was used to acquire resting-state dASL (7) with fifty 3D ASL volumes in 17 minutes. Resting-state ME BOLD images were acquired with 200 volumes in 10 minutes on a 3 T GE MR750 scanner.
For the task EEG data, P3 amplitude was defined as the largest amplitude within [300ms, 650ms] from the stimulus start at the Pz electrode. P3 onset latency was defined as the earliest time points at which an ERP amplitude exceeds half of the P3 amplitude.
Raw ME BOLD images were processed with multi-echo ICA pipeline (5) to remove non-BOLD noises and we referred to those processed images as ME BOLD images. We also generated single-echo (SE) BOLD images by averaging ME BOLD images with TE-dependent weights and regressing out the white matter and CSF signal fluctuations and motion effects. No denoising was performed for dASL images. dASL, ME BOLD and SE BOLD images were normalized to the standard MNI space using T1-weighted MPRAGE images as intermediate. Regional time series was calculated as mean signal series over each of the 90 regions in the AAL atlas. The coherence values between any two regions was calculated because coherence in the frequency domain was shown to be more sensitive than the correlation in the time domain (8). A 90x90 coherence matrix was constructed for each subject. Four global efficiencies (9) were calculated from the coherence matrix, including mean functional connectivity (MFC), cluster coefficient (CC), global efficiency (Ge) and characteristic path length (CPL). The four global efficiencies, which were derived from either method were correlated with P3 amplitude and P3 onset latency. To calculate correlations properly, Shapiro-Wilk tests were used to test for normality of each variable. If either of two variables was rejected from the Shapiro-Wilk normality tests, the Spearman correlation was performed instead of Pearson correlation.
Results
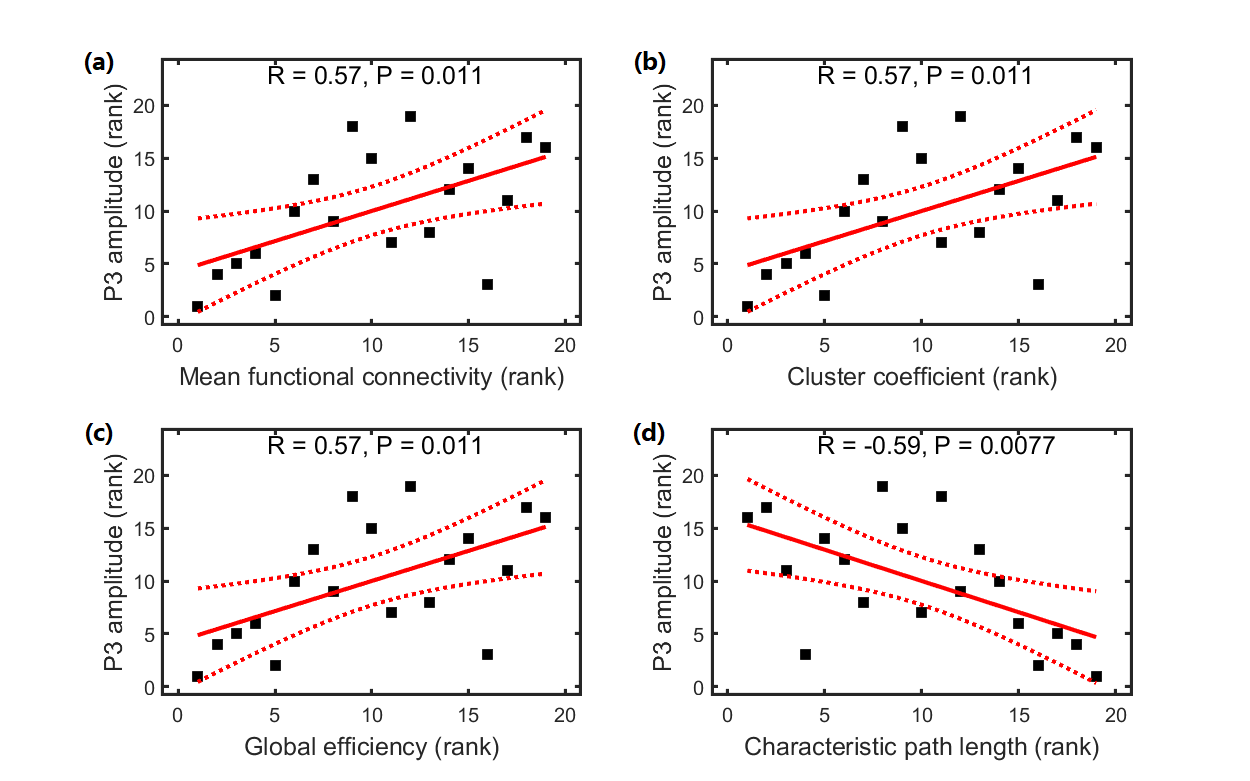
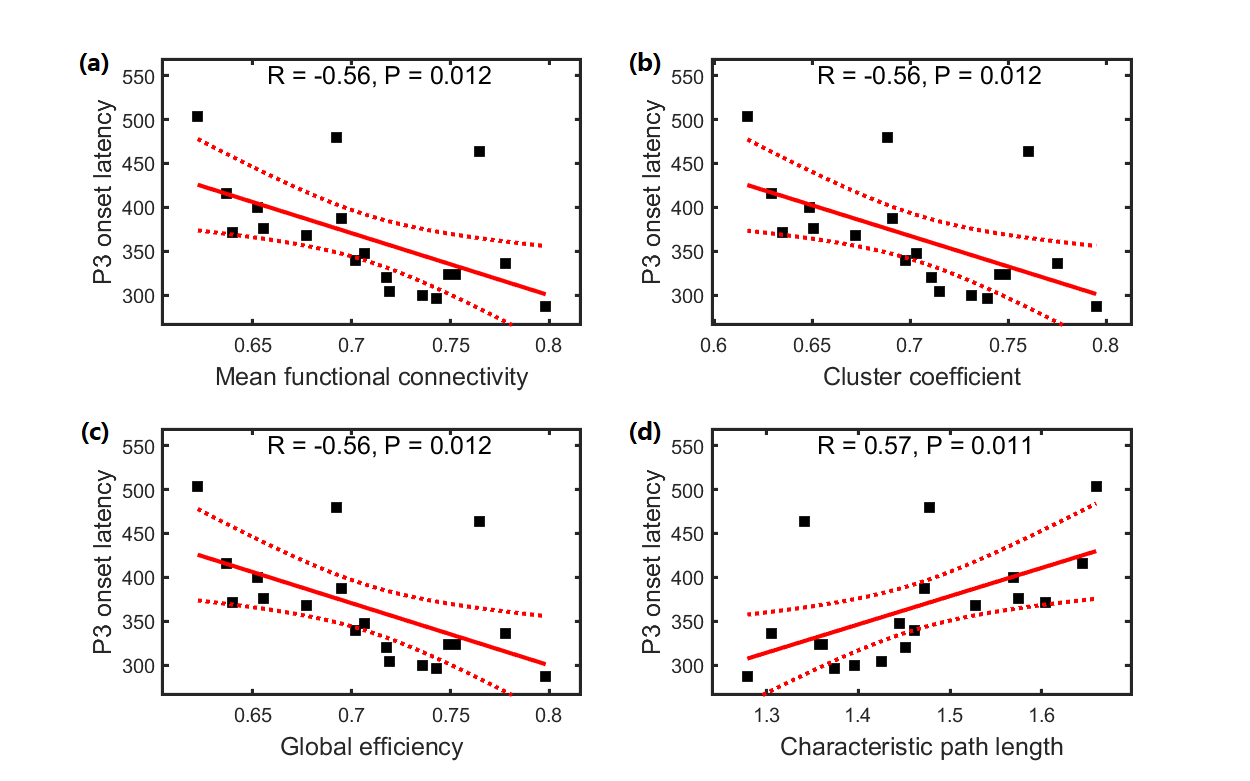
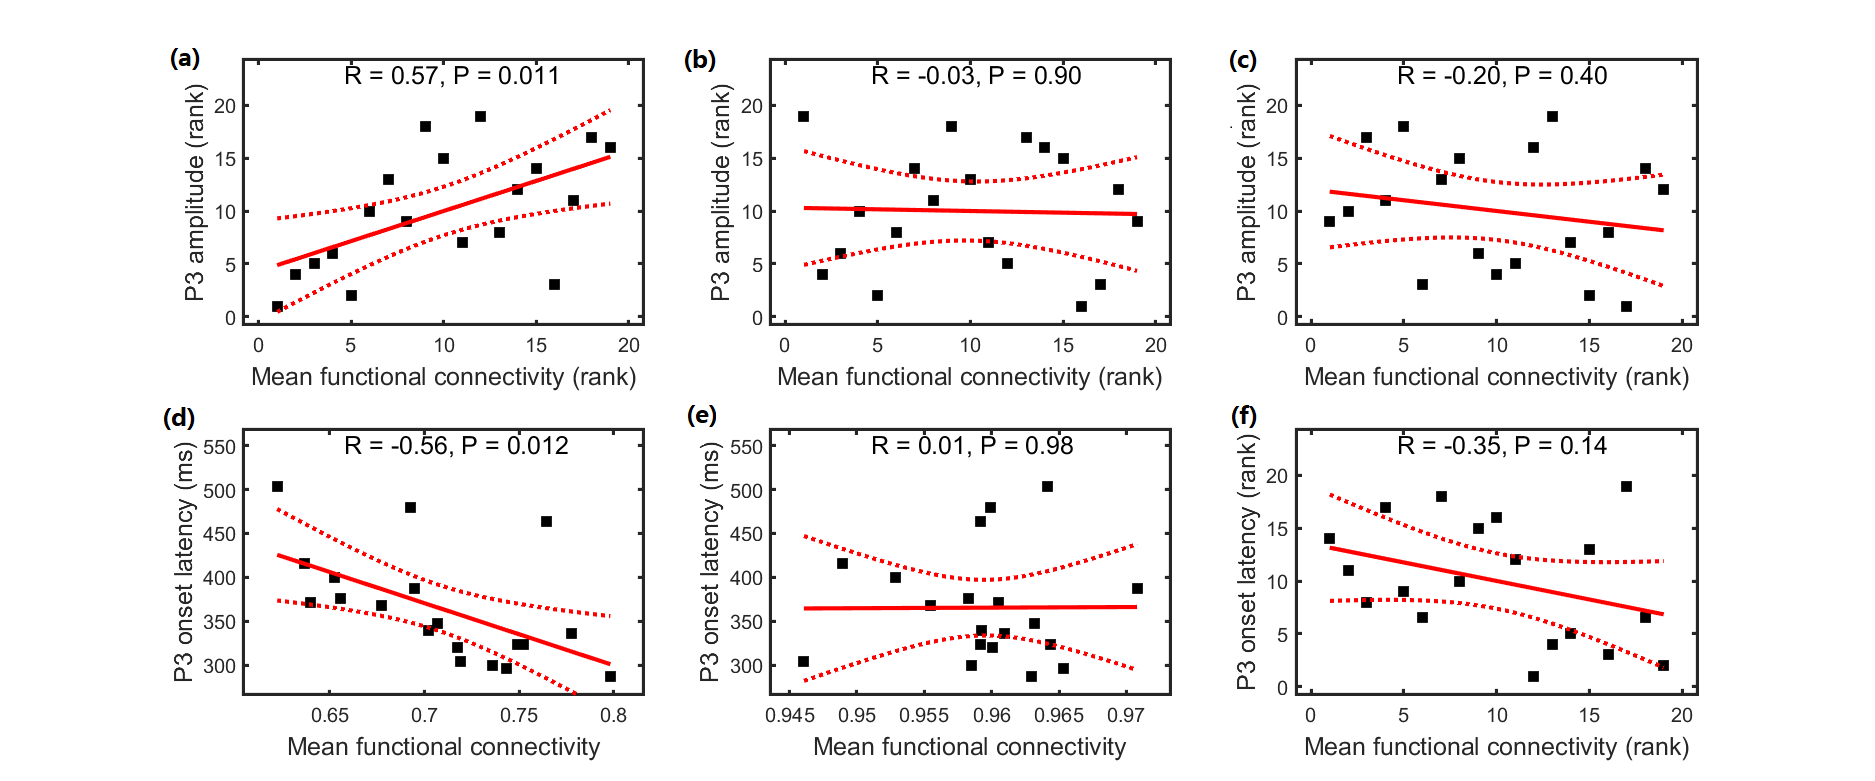
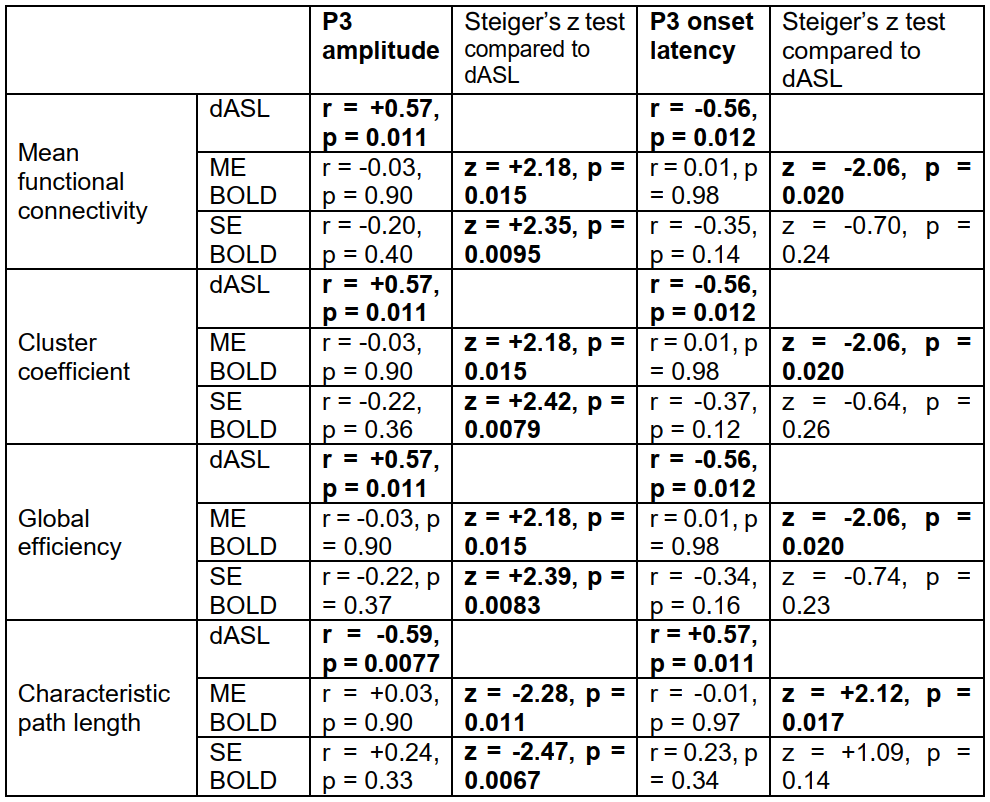
P3 amplitude was significantly correlated with all four global efficiencies derived from dASL (positive correlation with MFC, CC and Ge, and negative correlation with CPL), but not correlated with the four global efficiencies derived from ME BOLD or SE BOLD. Using Steiger’s z tests, the correlation coefficients between P3 amplitude and the four global efficiencies using dASL was significantly higher (in absolute values) than those using ME BOLD and those using SE BOLD.P3 onset latencies were significantly correlated with all four global efficiencies derived from dASL (negative correlation with MFC, CC and Ge, and positive correlation with CPL) but not correlated with those derived from ME BOLD or SE BOLD. Using Steiger’s z tests, the correlation coefficients between P3 onset latency and the four global efficiencies using dASL was significantly higher (in absolute values) than those using ME BOLD, but was not different from those using SE BOLD. All the correlations using ASL remained significant after family-wise error (FWE) correction. All the correlation coefficients using dASL, ME BOLD, SE BOLD and Steiger’s z tests results are listed in Table 1.
Discussion
We observed significantly larger correlation between attention levels (reflected by P3 properties when performing an attention task) and brain global efficiencies using dASL than those using ME BOLD and SE BOLD, indicating that dASL can offer more accurate global neural signal fluctuations. The higher sensitivity of dASL may be emerged from dASL signals with minimal contaminations of physiological noises and subject motion. We postulate that global neural fluctuations were removed largely in the BOLD denoising steps because they are mixed with physiological noises. The brain global efficiencies using dASL may serve as a promising biomarker to characterize brain attention.Conclusion
We demonstrated significant higher correlation of attention levels and brain global efficiencies using dASL than those using ME BOLD and SE BOLD, indicating that dASL can offer more accurate global neural signal fluctuations.Acknowledgements
No acknowledgement found.References
1. Scholvinck ML, Maier A, Ye FQ, Duyn JH, Leopold DA. Neural basis of global resting-state fMRI activity. Proc Natl Acad Sci 2010;107(22):10238-10243.
2. Zhao L, Alsop DC, Detre JA, Dai W. Global Fluctuations of Cerebral Blood Flow Indicate a Global Brain Network Independent of Systemic Factors. J Cereb Blood Flow Metab 2019;39(2):302-312.
3. Li F, Liu T, Wang F,et al. Relationships between the resting-state network and the P3: Evidence from a scalp EEG study. Sci Rep 2015;5:15129.
4. Li F, Tao Q, Peng W,et al. Inter-subject P300 variability relates to the efficiency of brain networks reconfigured from resting- to task-state: Evidence from a simultaneous event-related EEG-fMRI study. Neuroimage 2020;205:116285.
5. Kundu P, Brenowitz ND, Voon V,et al. Integrated strategy for improving functional connectivity mapping using multiecho fMRI. Proc Natl Acad Sci U S A 2013;110(40):16187-16192.
6. Poser BA, Versluis MJ, Hoogduin JM, Norris DG. BOLD contrast sensitivity enhancement and artifact reduction with multiecho EPI: parallel-acquired inhomogeneity-desensitized fMRI. Magn Reson Med 2006;55(6):1227-1235.
7. Dai W, Varma G, Scheidegger R, Alsop DC. Quantifying fluctuations of resting state networks using arterial spin labeling perfusion MRI. J Cereb Blood Flow Metab 2016;36(3):463-473.
8. Mahadevan AS, Tooley UA, Bertolero MA, Mackey AP, Bassett DS. Evaluating the sensitivity of functional connectivity measures to motion artifact in resting-state fMRI data. Neuroimage 2021;241:118408.
9. Rubinov M, Sporns O. Complex network measures of brain connectivity: uses and interpretations. Neuroimage 2010;52(3):1059-1069.
Figures