2672
Characterization of cortical reorganization in persons with chronic spinal cord injury using mesoscale graph measures1Department of Biostatistics, Johns Hopkins Bloomberg School of Public Health, Baltimore, MD, United States, 2International Center for Spinal Cord Injury, Kennedy Krieger Institute, Baltimore, MD, United States, 3Department of Physical Medicine and Rehabilitation, Johns Hopkins University School of Medicine, Baltimore, MD, United States, 4F.M. Kirby Research Center for Functional Brain Imaging, Kennedy Krieger Institute, Baltimore, MD, United States, 5Radiology and Radiological Science, Johns Hopkins University School of Medicine, Baltimore, MD, United States
Synopsis
Keywords: Brain Connectivity, Spinal Cord, graph theory, spinal cord injury, plasticity, reorganization
Cortical plasticity contributes to neurological recovery in persons with spinal cord injury (SCI) and can be studied using resting-state fMRI. Global graph measures offer insufficient detail to investigate local changes. Here, we investigated whether mesoscale graph measures provide additional insight. Changes in sensorimotor, visual, and ventral attention networks were revealed. Notably, decreased communication between lower body SMN with the rest of the functional networks across the brain and increased communication within the upper body SMN were observed. This suggests a potential for the mesoscale graph measures' utility in understanding the complex brain functional reorganizations in persons with chronic SCI.Introduction
Cortical plasticity is one of the major components that contribute to the capacity for neurological recovery in persons with spinal cord injury (SCI)1,2. Resting-state functional MRI (rsfMRI) provides the means to investigate such cortical plasticity in persons with SCI without requiring explicit tasks. This has strong clinical appeal, as it allows the use of an identical imaging protocol for all, regardless of the degree of residual motor and sensory functions. Graph theory analysis of the rsfMRI-derived measures enables quantitative characterization of the complex interactions between brain functional networks3,4. The clustering coefficient, modularity, and path lengths are popular global graph measures that provide valuable insight into overall patterns of cortical plasticity5. However, such global measures offer insufficient detail to investigate local changes within cortical functional networks. In this study, we investigated whether mesoscale graph measures, specifically the recruitment and integration coefficients obtained using the modularity allegiance matrix, can provide additional insight into plastic cortical reorganization in persons with chronic SCI.Methods
The study was performed under a protocol approved by the Institutional Review Board at Johns Hopkins University School of Medicine. Thirty-two persons with chronic cervical and thoracic SCI (age mean: 40 years, Male/Female ratio: 25/7) participated in the study. The International Standards for Neurological Classification of SCI (ISNCSCI) classification of the 32 participants consisted of 13 ASIA impairment scale (AIS) A, 2 AIS B, 11 AIS C, and 6 AIS D. Previously acquired data from 32 healthy volunteers (age mean 36 years, M/F ratio: 24/8) was used as the healthy control (HC) dataset.All study participants were scanned on a 3T Philips Achieva scanner (Philips HealthCare, Best, Netherlands). The imaging protocol included a T1 weighted (T1w) structural run (acquisition time=6 min, TR/TE/TI=6.7/3.1/842 ms, resolution=1x1x1.2 mm3, SENSE factor=2, flip angle=8°) and two rsfMRI runs. The rsfMRI data was performed using a multi-slice SENSE-EPI pulse sequence (TR/TE=2000/30 ms, SENSE factor=2, flip angle=75°, 37 axial slices, nominal resolution=3x3x3 mm3, 1 mm gap, 32 channel head coil, number of dynamics=200). Participants were instructed to stay as still as possible with their eyes closed during the entire scan, and no other instruction was provided.
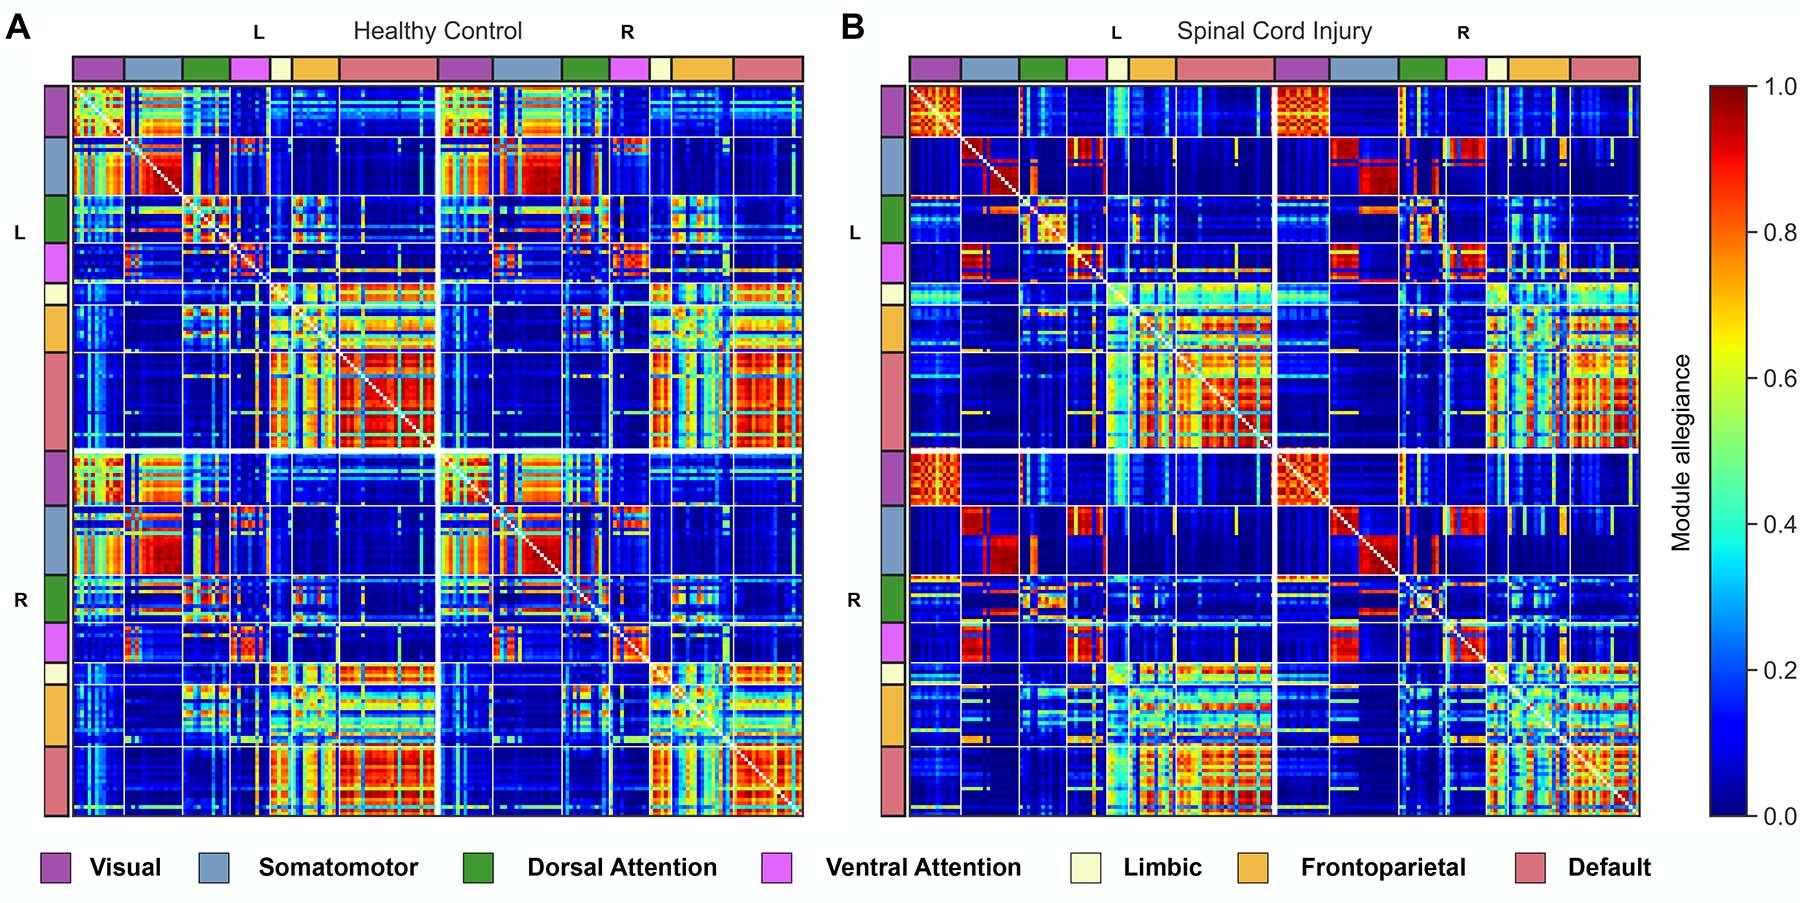
Preprocessing of the rsfMRI data set was performed using the Analysis of Functional NeuroImages (AFNI) software6. The preprocessing pipeline included: 1) despiking, 2) slice timing correction, 3) motion correction, 4) co-registration, 5) normalization, 6) segmentation, 7) spatial smoothing using a 6 mm (i.e., twice the nominal acquisition voxel size) full-width at half-maximum Gaussian kernel, and 8) nuisance regression (using Fast Anatomy-Based Image Correction7). The preprocessed fMRI data set was then parcellated into 200 ROIs using Schaefer-Yeo atlas8, and corresponding time courses from each ROI were extracted to compute the weighted correlation matrices. Next, a set of mesoscale graph measures (i.e., the modularity measures) were derived from the correlation matrices. The modularity measures included the multi-layer modularity index, module allegiance matrix, and the recruitment and integration coefficients – where the module allegiance matrix was calculated by quantifying the probability that pairs of brain regions engage in the same functional network community across subjects. This analysis approach provided quantitative outcome measures of, across subjects, how stably the brain regions are recruited (recruitment) and how consistently the regions interact with other functional networks (integration).
Finally, non-parametric permutation tests (10,000 runs) were performed to identify significant group means between the HC and the SCI groups.
Results
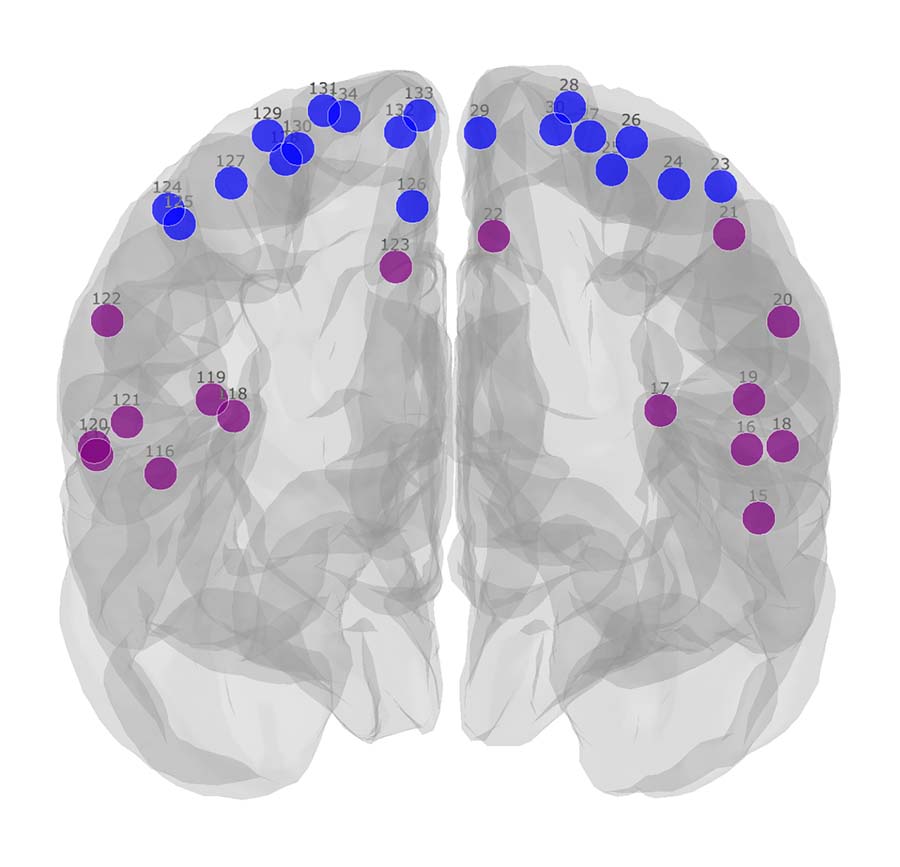
Figure 1 shows the module allegiance matrices of the HC and SCI groups. Notably, a segregation of the sensorimotor network (SMN) into SMNd (SMN dorsal; brain regions that represent the lower body areas) and SMNv (SMN ventral; regions that represent the face, arm, and hand areas) was observed, as visualized in Figure 2. Compared with the HC group, the SCI group manifested: 1) an increased recruitment coefficient within SMNd, 2) decreased integration coefficient between SMNd and SMNv, and 3) a decreased integration coefficient between SMNd and the rest of the functional networks across the entire brain was observed. Changes within and across the visual network (VS) were also observed. Specifically, compared with the HC group, the SCI group manifested: 1) a decreased integration coefficient between VS and SMNv, 2) a decreased integration coefficient between VS and SMNd, and 3) an increased recruitment coefficient within VS were observed. Finally, an increased recruitment coefficient within the ventral attention network was observed.Discussion
The investigation of brain reorganization amongst persons with chronic SCI using mesoscale graph measures revealed significant group differences in the communication patterns of sensorimotor, visual, and ventral attention networks. Notably, changes in the sensorimotor network were characterized by significantly decreased communication between the lower body sensorimotor networks with the rest of the functional networks across the brain and significantly increased communication within the upper body sensorimotor networks.Conclusion
Our results demonstrate that the mesoscale graph measures (i.e., the integration and recruitment coefficients) can effectively characterize the changes in sensorimotor, visual, and attention networks that occur in persons with chronic SCI. This has important implications for understanding the complex brain functional reorganizations in persons with chronic SCI by proposing a new investigative toolset for SCI research.Acknowledgements
This work is supported in part by NIH (R21 EB006120 and P41-EB015909), the Craig H. Neilsen Foundation (Project Number 338419), and DOD (W81XWH-08-1-0192).References
1. Jurkiewicz MT, Mikulis DJ, McIlroy WE, et al. Sensorimotor Cortical Plasticity During Recovery Following Spinal Cord Injury: A Longitudinal fMRI Study. Neurorehabil Neural Repair 2007;21(6):527–538; doi: 10.1177/1545968307301872.
2. Choe A, Belegu V, Yoshida S, et al. Extensive neurological recovery from a complete spinal cord injury: a case report and hypothesis on the role of cortical plasticity. Frontiers in Human Neuroscience 2013;7.
3. Min Y-S, Chang Y, Park JW, et al. Change of Brain Functional Connectivity in Patients With Spinal Cord Injury: Graph Theory Based Approach. Ann Rehabil Med 2015;39(3):374–383; doi: 10.5535/arm.2015.39.3.374.
4. Fallani FDV, Astolfi L, Cincotti F, et al. Cortical functional connectivity networks in normal and spinal cord injured patients: Evaluation by graph analysis. Human Brain Mapping 2007;28(12):1334–1346; doi: 10.1002/hbm.20353.
5. Farahani FV, Karwowski W, Lighthall NR. Application of Graph Theory for Identifying Connectivity Patterns in Human Brain Networks: A Systematic Review. Frontiers in Neuroscience 2019;13.
6. Cox RW. AFNI: software for analysis and visualization of functional magnetic resonance neuroimages. Comput Biomed Res 1996;29(3):162–173; doi: 10.1006/cbmr.1996.0014.
7. Jo HJ, Reynolds RC, Gotts SJ, et al. Fast detection and reduction of local transient artifacts in resting-state fMRI. Computers in Biology and Medicine 2020;120:103742; doi: 10.1016/j.compbiomed.2020.103742.
8. Schaefer A, Kong R, Gordon EM, et al. Local-Global Parcellation of the Human Cerebral Cortex from Intrinsic Functional Connectivity MRI. Cereb Cortex 2018;28(9):3095–3114; doi: 10.1093/cercor/bhx179.
Figures