2671
Uncovering the biological mechanism of depression based on edge-centric functional connectivity: a correlation study
Fanghui Dong1, Tongpeng Chu1, Ning Mao1, and Haizhu Xie1
1Yantai Yuhuangding Hospital, Yantai, China
1Yantai Yuhuangding Hospital, Yantai, China
Synopsis
Keywords: Brain Connectivity, fMRI (resting state), Major depressive disorder, edge-centric functional connectivity, gene expression
This study aims to use the combination of the edge-centric functional network (eFC) model with transcribed gene datasets to explore the molecular basis of depression. In our study, we for the first time reported the correlation between eFC and transcriptional profiles in MDD patients. These findings revealed eFC phenotypes in MDD and bridged the gap between transcriptome and neuroimaging. It advanced our understanding of the neurobiological mechanism underlying depression and provided potential biomarkers for the evaluation of MDD treatment.Background
Major depression disorder (MDD) is a ubiquitous global psychiatric disorder, but the current understanding of the pathophysiology is unclear due to altered brain structure and function and therapeutic inconsistency. While the traditional network analysis method only describes the topological relationship between the nodes, and does not consider the interaction relationship between the edges. Alternatively, the molecular basis underlying the variability of brain function in depression remains an open question. This study aims to use the combination of the edge-centric functional network (eFC) model with transcribed gene datasets to explore the molecular basis of the disease.Methods
The study included neuroimaging data from two independent cohorts (discovery cohort 119 MDD and 136 healthy control (HC), validation cohorts 126 MDD and 124 HC) and a publicly available transcriptomic dataset. First, the eFC was constructed based on the processing of the resting-state functional images of AAL-90 atlas. Then the T test was used to calculate the MDD-HC differences between the different regions. In other hand, gene expression profiles from the 45 regions of the Allen Human Brain Atlas (left hemisphere only) were averaged across six postmortem brains. We used partial least squares regression (PLS) to identify associations of imaged transcription. Finally, the enrichment analysis of the gene list associated with the first component of the PLS, including the GO pathway, cell type analysis, PPI network, etc.Results
The eFC analysis showed differences in brain region function compared with controls, with decreased changes in the superior frontal, inferior frontal, and inferior temporal gyrus, and increased changes in the hippocampus, caudate nucleus, and olfactory cortex. Using human brain gene expression data, we observed that the expression of depression-related genes was associated with differences in the eFC. Furthermore, to explore the role of depression-related genes in the PLS analysis, we found 24 MDD-related genes with prior knowledge, and then obtained 13 overlapping genes from these 24 genes and the 15,633 background genes after pretreatment. In functional enrichment analysis, we investigated the biological pathways most involved to MDD. In addition, we found that the microglia and neuronal cells had the largest proportion. These changes explain most of the observed correlations with depression-specific eFC differences.Conclusion
Acknowledgements
We thank all subjects who participated in this study.References
No reference found.Figures
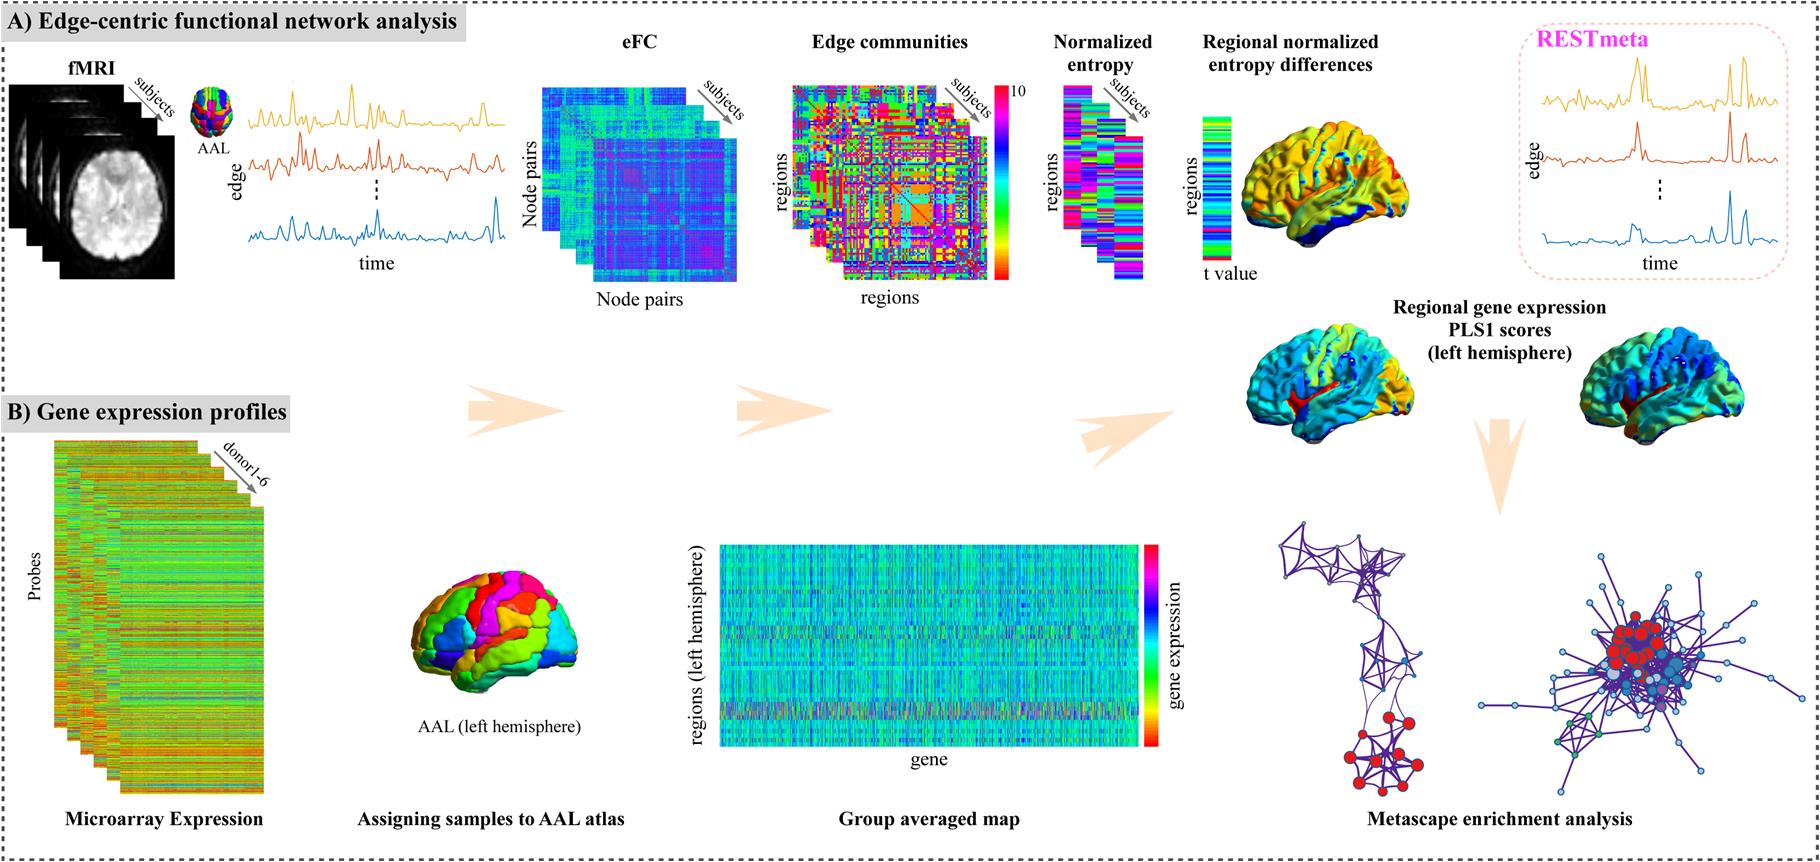
The flowchart of this study. A. The construction and analysis of edge-centric functional network. B. The brain gene expression data processing. Then the relationship between MDD-related changes in eFC and gene expressions was explored by PLS analysis. Finally, a series of functional enrichment analysis, including ontology pathways, cell type analysis, PPI networks and so on were performed. eFC, edge-centric functional network; PLS, partial least squares regression; PPI, Protein-Protein interaction.
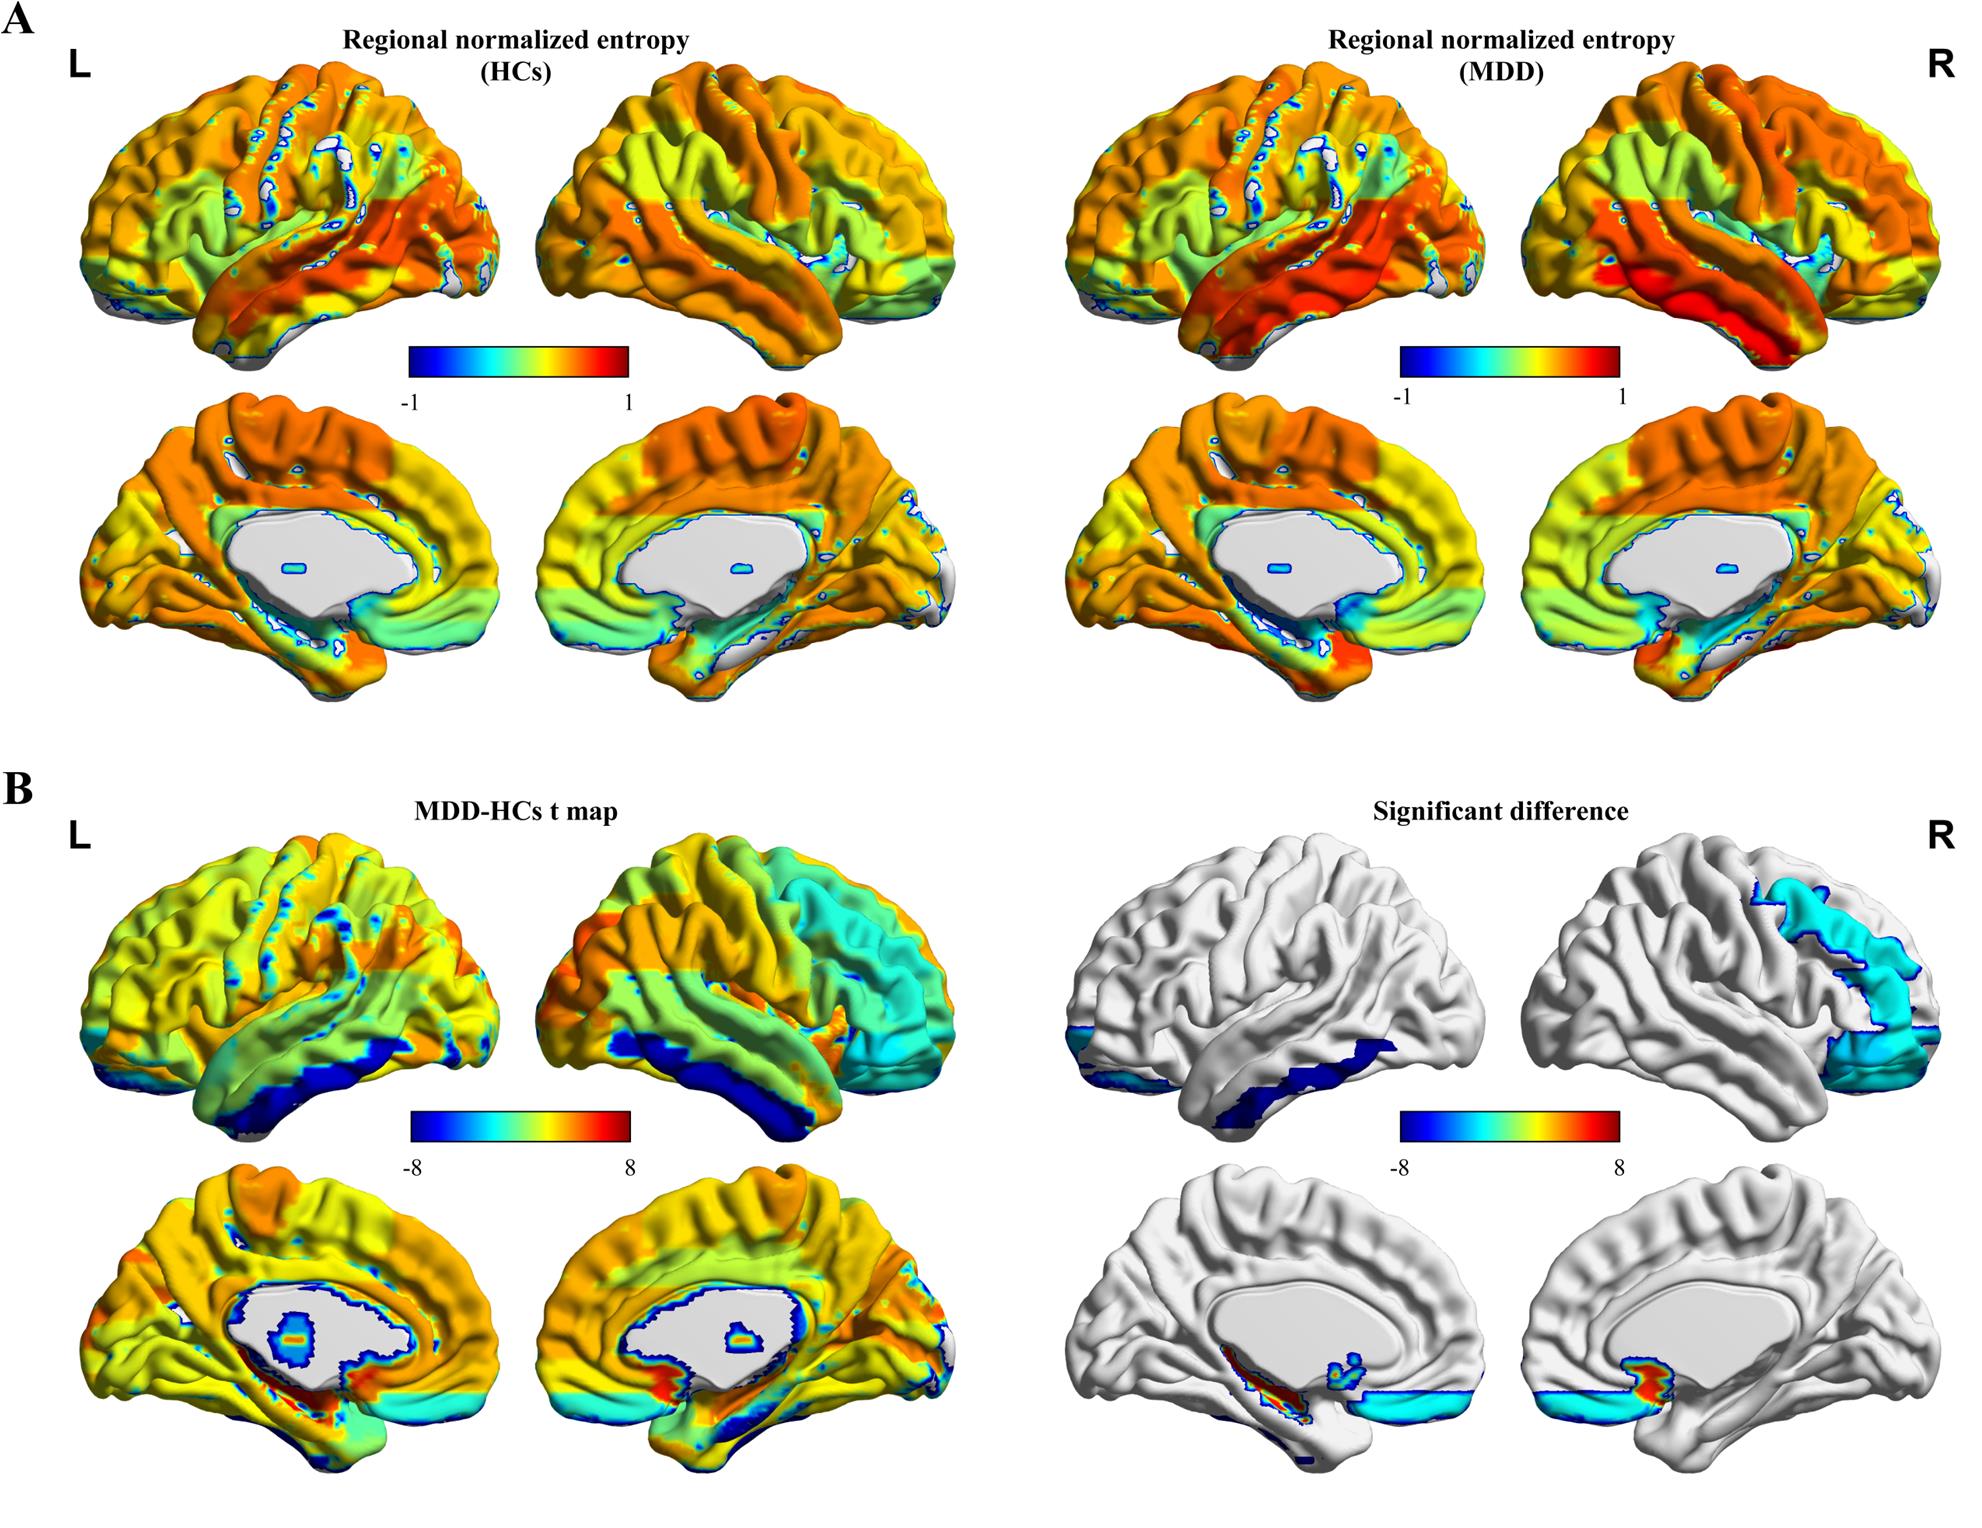
(A) Entropy values of eFC network in different brains between HC and MDD group. (B) Regions showing differences in the entropy values of eFC network between HC and MDD (p < 0.05 corrected by FDR). eFC, edge-centric functional network; HC, healthy control; MDD, Major depression disorder.
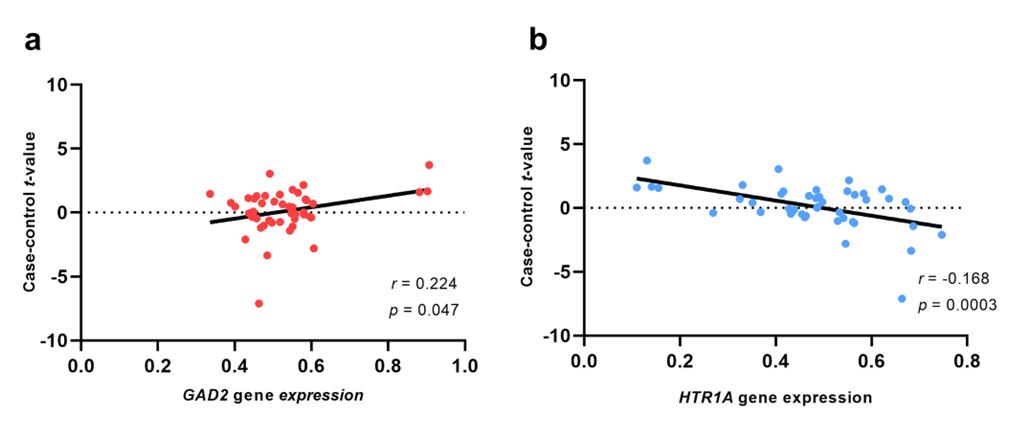
MDD-related genes expression correlated with case-control t-map. (a) The GAD2 gene expression was positively correlated case-control t-map. (b) The HTR1A gene expression was negatively correlated case-control t-map. MDD, Major depression disorder.
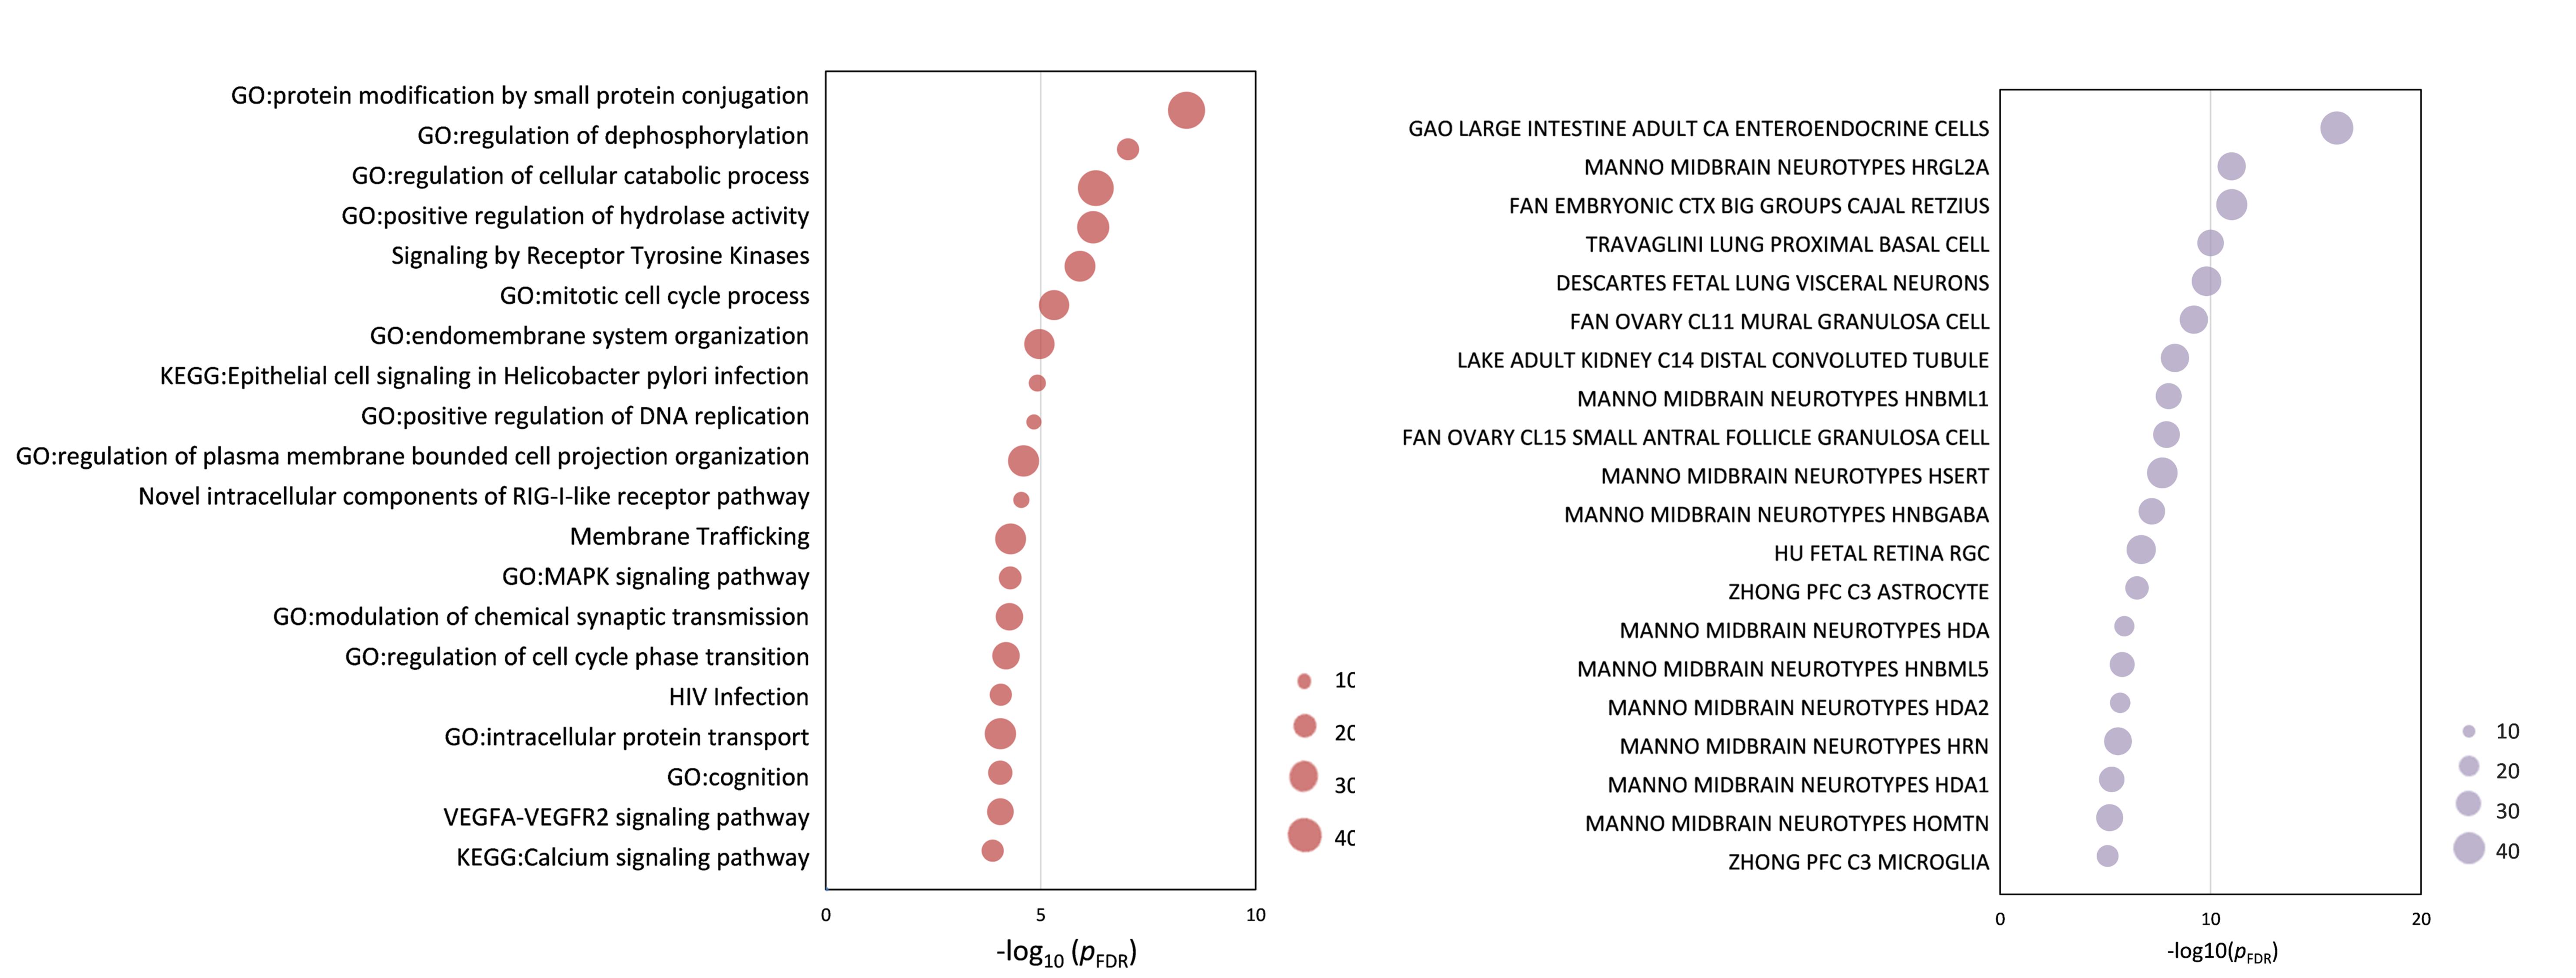
Functional enrichment of gene transcripts. (a) Ontology terms for PLS+ and PLS− genes (pFDR < 0.05). (b) Cell type-specific expression to changes in eFC-related genes. The size of the circle represents the number of genes involved in given term and cell types.
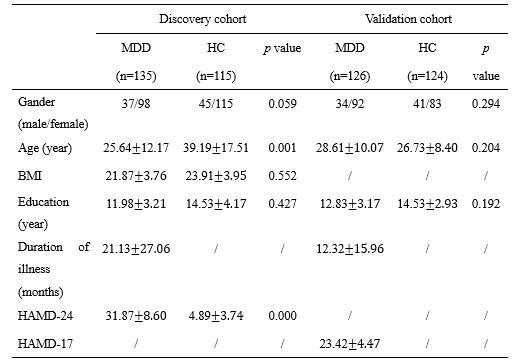
Demographic and clinical characteristics of all
subjects.
DOI: https://doi.org/10.58530/2023/2671