2662
Personalized fingerprint of neurodegenerative phenotypes using model-based simulations of brain networks
Anita Monteverdi1, Fulvia Palesi2, Michael Schirner3,4,5,6,7, Francesca Argentino2, Mariateresa Merante2, Alberto Redolfi8, Francesca Conca9, Laura Mazzocchi10, Matteo Cotta Ramusino2,11, Alfredo Costa2,11, Anna Pichiecchio2,10, Lisa Maria Farina9, Stefano Cappa9,12, Viktor Jirsa13, Petra Ritter3,4,5,6,7, Claudia A.M. Gandini Wheeler-Kingshott1,2,14, and Egidio D’Angelo1,2
1Brain Connectivity Center, IRCCS Mondino Foundation, Pavia, Italy, 2Dept of Brain and Behavioral Sciences, University of Pavia, Pavia, Italy, 3Berlin Institute of Health at Charité, Universitätsmedizin Berlin, Berlin, Germany, 4Department of Neurology with Experimental Neurology, Charité, Universitätsmedizin Berlin, Berlin, Germany, 5Bernstein Focus State Dependencies of Learning and Bernstein Center for Computational Neuroscience, Berlin, Germany, 6Einstein Center for Neuroscience Berlin, Berlin, Germany, 7Einstein Center Digital Future, Berlin, Germany, 8Laboratory of Neuroinformatics, IRCCS Istituto Centro San Giovanni di Dio Fatebenefratelli, Brescia, Italy, 9IRCCS Mondino Foundation, Pavia, Italy, 10Advanced Imaging and Radiomics Center, IRCCS Mondino Foundation, Pavia, Italy, 11Unit of Behavioral Neurology, IRCCS Mondino Foundation, Pavia, Italy, 12University Institute of Advanced Studies (IUSS), Pavia, Italy, 13Institut de Neurosciences des Systèmes, INSERM, INS, Aix Marseille University, Marseille, France, 14NMR Research Unit, Queen Square MS Centre, UCL Queen Square Institute of Neurology, Department of Neuroinflammation, University College London, London, United Kingdom
1Brain Connectivity Center, IRCCS Mondino Foundation, Pavia, Italy, 2Dept of Brain and Behavioral Sciences, University of Pavia, Pavia, Italy, 3Berlin Institute of Health at Charité, Universitätsmedizin Berlin, Berlin, Germany, 4Department of Neurology with Experimental Neurology, Charité, Universitätsmedizin Berlin, Berlin, Germany, 5Bernstein Focus State Dependencies of Learning and Bernstein Center for Computational Neuroscience, Berlin, Germany, 6Einstein Center for Neuroscience Berlin, Berlin, Germany, 7Einstein Center Digital Future, Berlin, Germany, 8Laboratory of Neuroinformatics, IRCCS Istituto Centro San Giovanni di Dio Fatebenefratelli, Brescia, Italy, 9IRCCS Mondino Foundation, Pavia, Italy, 10Advanced Imaging and Radiomics Center, IRCCS Mondino Foundation, Pavia, Italy, 11Unit of Behavioral Neurology, IRCCS Mondino Foundation, Pavia, Italy, 12University Institute of Advanced Studies (IUSS), Pavia, Italy, 13Institut de Neurosciences des Systèmes, INSERM, INS, Aix Marseille University, Marseille, France, 14NMR Research Unit, Queen Square MS Centre, UCL Queen Square Institute of Neurology, Department of Neuroinflammation, University College London, London, United Kingdom
Synopsis
Keywords: Alzheimer's Disease, Modelling, Frontotemporal Dementia
This work provides the first personalized and non-invasive assessment of resting-state networks connectivity and excitatory/inhibitory balance in health and in neurodegenerative diseases (Alzheimer’s disease, Frontotemporal Dementia). Multiple networks were characterized at single-subject level performing brain dynamics simulations with The Virtual Brain (TVB). TVB-derived parameters identified specific network properties (at single network and inter-network level) and their disruption in neurodegeneration, underlined the relationship between neurophysiology and neuropsychology, and outlined a personalized fingerprint sensitive to clinical severity. This model-based simulation of brain networks functional dynamics lay the groundwork for customized biomarkers research and defines new trajectories for designing novel tailored interventional workflows.Introduction
Functional brain networks connectivity changes are a potential biomarker for neurodegenerative diseases1. Nevertheless, a simultaneous characterization of multiple networks has been rarely performed2, especially in atypical forms of Alzheimer’s disease (AD) or Frontotemporal Dementia (FTD). Moreover, while the role of excitation/inhibition (E/I) imbalance has already been recognized in neurodegeneration3, how such E/I imbalance at networks level is linked to connectivity changes and affects cognitive decline is still undetermined. The development of computational models and of simulation platforms, such as The Virtual Brain (TVB)4,5, recently enabled the non-invasive investigation of intrinsic brain features, such as the E/I balance6,7, at single-subject level. Thus, in this work we performed a comprehensive TVB-based assessment of brain network properties, to shed light on their E/I balance and their disruption in AD (typical and atypical) and FTD. TVB-derived parameters enable us to explore the relationship between neurophysiology of brain networks and neuropsychological performance. Moreover, we outlined personalized fingerprints of multiple phenotypes, showing sensitivity to clinical severity.Methods
Subjects: 10 healthy controls (HC)(6 females, 67±3y), 16 AD (13 females, 70±8y) and 7 FTD (1 female, 69±5y) underwent MRI examination using a 3T Siemens Skyra scanner. A detailed clinical assessment defined several phenotypes in both the AD and FTD groups (Table.1A). The imaging protocol included resting-state fMRI (rs-fMRI) (GE-EPI, TR/TE=2400/30ms; voxel=3x3x3mm3, 200 volumes), diffusion-weighted images (SE-EPI, TR/TE=8400/93ms, voxel=2.5x2.5x2.5mm3, b=1000/2000s/mm2 per 30 directions, 7 b0-images), and 3DT1-weighted volume (MPRAGE, TR/TE/TI=2.3/2.96/900ms, voxel=1x1x1mm3). All subjects underwent a neuropsychological examination to assess their global cognitive status (Mini-Mental State Examination, MMSE) and different cognitive domains: memory, language, visuo-constructional abilities, attention and executive function.Preprocessing and tractography: diffusion-weighted and rs-fMRI images were preprocessed and whole-brain Anatomically-Constrained Tractography8 was performed estimating fibers orientation distribution with multi-tissue constrained spherical deconvolution and probabilistic tractography9.
Structural connectivity (SC) and experimental functional connectivity (expFC) matrices: an ad-hoc atlas was created combining 93 cerebral (AAL10) (including cortical/subcortical structures) and 31 cerebellar (SUIT11) labels. For each subject, the parcellation of whole-brain tractography led to a whole-brain SC matrix with atlas labels as nodes and weighted by the normalized number of streamlines (edges). The time-course of BOLD signals was extracted from rs-fMRI data for each node, and six networks known to support specific functions (Fig.1) were selected according to Buckner12 and Yeo13 atlases. For each of these six functional networks, SC matrices were obtained extracting a subset of nodes and connections from the whole-brain SC. Both static (expFC) and dynamic (expFCD) network FC were reconstructed from experimental data.
TVB simulation: analysis was conducted at single-subject level (Fig.2). The Wong-Wang model14 was chosen to simulate brain dynamics in each network endowing subject and network specific connectivity and E/I levels. A series of model parameters were tuned to gain a description of long-range connectivity (G), excitatory (JNMDA) and inhibitory (Ji) synaptic strength and recurrent excitation (w+). At each iteration of the tuning process, simulated FC (simFC) and FCD (simFCD) were computed. Parameters were adjusted iteratively to maximize matching between simulated and experimental FC and FCD of each network individually15.
Statistics (SPSSv21): general linear model was used to assess parameter differences between functional networks and changes of such differences due to pathologies. A multiple regression analysis was performed to investigate the relationship between neuropsychological scores and optimal model parameters. K-mean cluster analysis stratified subjects according to cognitive networks TVB-derived properties.
Results
TVB parameters identified differences between functional networks, suggesting the presence of a specific network-dependent connectivity and E/I balance. Going from healthy to pathological groups, these inter-network differences changed (Fig.3A), implying a neurodegenerative impact on inter-network relationships. Interestingly, the impact of neurodegeneration was different in AD and FTD, with TVB-derived parameters of the Default Mode Network (DMN) mostly altered in AD and the ones of the Frontoparietal Network mainly altered in FTD (Fig.3B). Changes were detected not only in cognitive networks (Limbic, Attention, DMN) but also in sensorimotor ones (Visual, Somatomotor). In backward regression, neuropsychological scores variance was explained primarily by TVB-derived parameters of those networks known to be functionally involved with each cognitive domain (Table.1B). Finally, clustering analysis identified connectivity and inhibition levels of cognitive networks as the most informative features to perform patients’ stratification (Fig.4A). Notably, different clinical phenotypes were scattered across clusters, while patients presenting the worst MMSE scores gathered in clusters with a similar networks profile (Fig.4B).Discussion
This work represents the first characterization of multiple brain networks in single subjects, recognizing the importance of networks E/I balance together with connectivity in neurodegeneration. TVB parameters showed a different impact of neurodegeneration in AD and FTD, suggesting specific network-dependent patterns of connectivity, excitation and inhibition. Interestingly, alterations affected cognitive networks but also sensory ones, not conventionally linked with neurodegeneration. The relationship found between TVB parameters and subjects’ neuropsychological performance underlined the link between neurophysiology of brain networks and cognition. Looking at cognitive network properties, clustering analysis outlined a personalized fingerprint splitting multiple phenotypes across different clusters, capturing both subjects’ cognitive status and clinical severity. Overall, our findings establish a new method to non-invasively explore networks properties and their dysfunction at single-subject level. The results achieved so far lay the groundwork for customized biomarkers research, defining new trajectories in differential diagnosis and tailored interventional workflows.Acknowledgements
This work was performed at the IRCCS Mondino Foundation and was supported by the Italian Ministry of Health (RC2022-2024). ED’A and FP received funding by the H2020 Research and Innovation Action Grants Human Brain Project 785907 and 945539 (SGA2 and SGA3), and ED’A received funding by the MNL Project “Local Neuronal Microcircuits” of the Centro Fermi (Rome, Italy). CG received funding from Horizon2020 (Human Brain Project SGA3, Specific Grant Agreement No. 945539), BRC (#BRC704/CAP/CGW), MRC (#MR/S026088/1), Ataxia UK, MS Society (#77), Wings for Life (#169111) and is a shareholder in Queen Square Analytics Ltd.References
- Hohenfeld, C., Werner, C.J. and Reetz, K. (2018) ‘Resting-state connectivity in neurodegenerative disorders: Is there potential for an imaging biomarker?’, NeuroImage: Clinical, 18(February), pp. 849–870.
- Castellazzi, G., Palesi, F., Casali, S., Vitali, P., Wheeler-Kingshott, C.A.M., Sinforiani, E., et al. (2014) ‘A comprehensive assessment of resting state networks: Bidirectional modification of functional integrity in cerebro-cerebellar networks in dementia’, Frontiers in Neuroscience, 8(8 JUL), pp. 1–18.
- Maestú, F., de Haan, W., Busche, M.A. and DeFelipe, J. (2021) ‘Neuronal excitation/inhibition imbalance: core element of a translational perspective on Alzheimer pathophysiology’, Ageing Research Reviews, 69, p. 101372.
- Sanz-Leon P, Knock SA, Spiegler A, Jirsa VK (2015) Mathematical framework for large-scale brain network modeling in The Virtual Brain. Neuroimage 111:385–430
- Sanz-Leon P, Knock SA, Woodman MM, Domide L, Mersmann J, Mcintosh AR, Jirsa V (2013) The virtual brain: A simulator of primate brain network dynamics. Front Neuroinform 7.
- Zimmermann, J., Perry, A., Breakspear, M., Schirner, M., Sachdev, P., Wen, W., et al. (2018) ‘Differentiation of Alzheimer’s disease based on local and global parameters in personalized Virtual Brain models’, NeuroImage: Clinical, 19(April), pp. 240–251.
- Monteverdi, A., Palesi, F., Costa, A., Vitali, P., Pichiecchio, A., Cotta Ramusino, M., et al. (2022) ‘Subject-specific features of excitation/inhibition profiles in neurodegenerative diseases’, Frontiers in Aging Neuroscience, 14(August), pp. 1–17.
- Smith RE, Tournier JD, Calamante F, Connelly A (2012) Anatomically-constrained tractography: Improved diffusion MRI streamlines tractography through effective use of anatomical information. Neuroimage 62:1924–1938
- Tournier JD, Calamante F, Connelly A (2012) MRtrix: Diffusion tractography in crossing fiber regions. Int J Imaging Syst Technol 22:53–66.
- Tzourio-Mazoyer, N., Landeau, B., Papathanassiou, D., Crivello, F., Etard, O., Delcroix, N., et al. (2002). Automated anatomical labeling of activations in SPM using a macroscopic anatomical parcellation of the MNI MRI single-subject brain. Neuroimage 15, 273–289.
- Diedrichsen J, Balsters JH, Flavell J, Cussans E, Ramnani N (2009) A probabilistic MR atlas of the human cerebellum. Neuroimage 46:39–46
- Buckner, R.L., Krienen, F.M., Castellanos, A., Diaz, J.C. and Thomas Yeo, B.T. (2011) ‘The organization of the human cerebellum estimated by intrinsic functional connectivity’, Journal of Neurophysiology, 106(5), pp. 2322–2345.
- Yeo T, B.T., Krienen, F.M., Sepulcre, J., Sabuncu, M.R., Lashkari, D., Hollinshead, M., et al. (2011) ‘The organization of the human cerebral cortex estimated by intrinsic functional connectivity’, Journal of Neurophysiology, 106(3), pp. 1125–1165.
- Deco G, Ponce-Alvarez A, Hagmann P, Romani GL, Mantini D, Corbetta M (2014) How local excitation-inhibition ratio impacts the whole brain dynamics. J Neurosci 34:7886–7898.
- Kong, X., Kong, R., Orban, C., Wang, P., Zhang, S., Anderson, K., et al. (2021) ‘Sensory-motor cortices shape functional connectivity dynamics in the human brain’, Nature Communications, 12(1).
Figures
Fig.1| The six functional networks considered for modeling of brain dynamics: visual, somatomotor, attention, limbic, frontoparietal, default mode network. These networks were defined according to Buckner and Yeo atlases and extracted from whole-brain structural connectivity matrices of each subject, choosing a subset of nodes and connections. Nodes and edges considered for each network are differently colored.
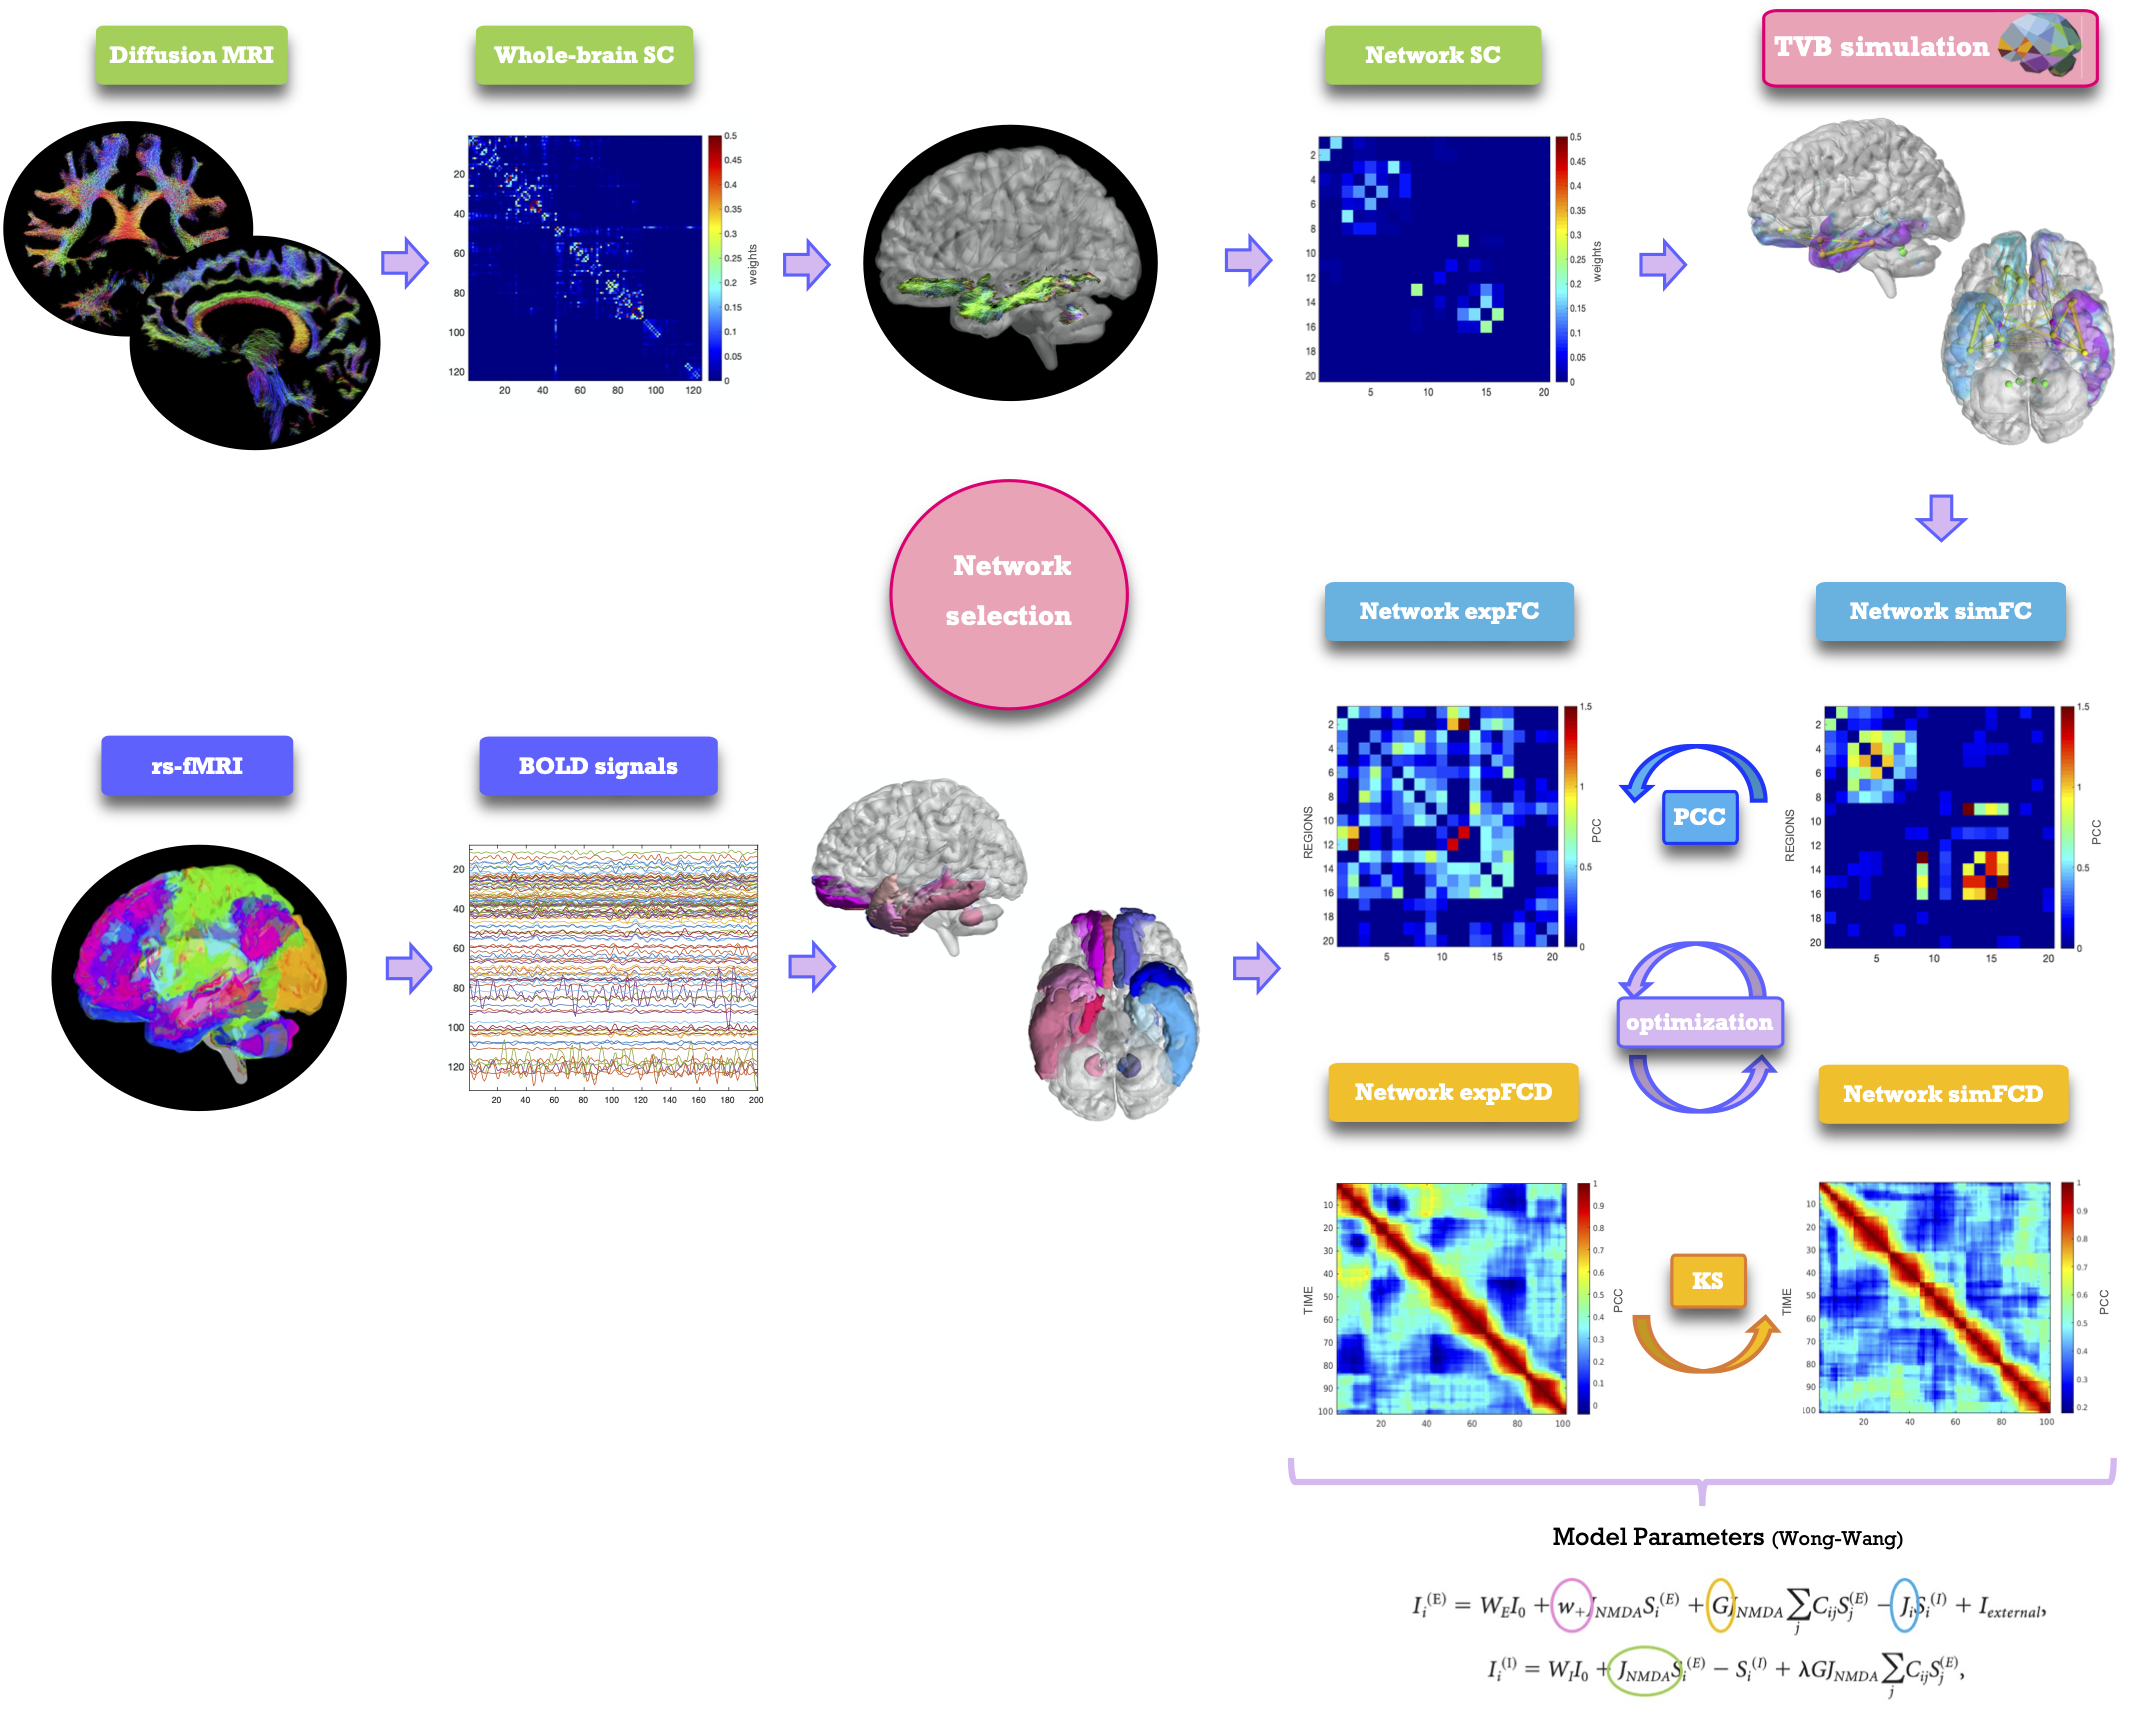
Fig.2| Schematic representation of analysis workflow. From top left, clockwise: diffusion-weighted images after preprocessing and tractography, whole-brain structural connectivity (SC) matrix reconstruction, extraction of a network, TVB simulation performed for the network, reconstruction of a simulated static and dynamic (simFC and simFCD) functional connectivity matrix of the network, optimization of the simulation using a model inversion with the experimental FC and FCD (expFC and expFCD), derived from BOLD signals of the nodes belonging to the network, as target.
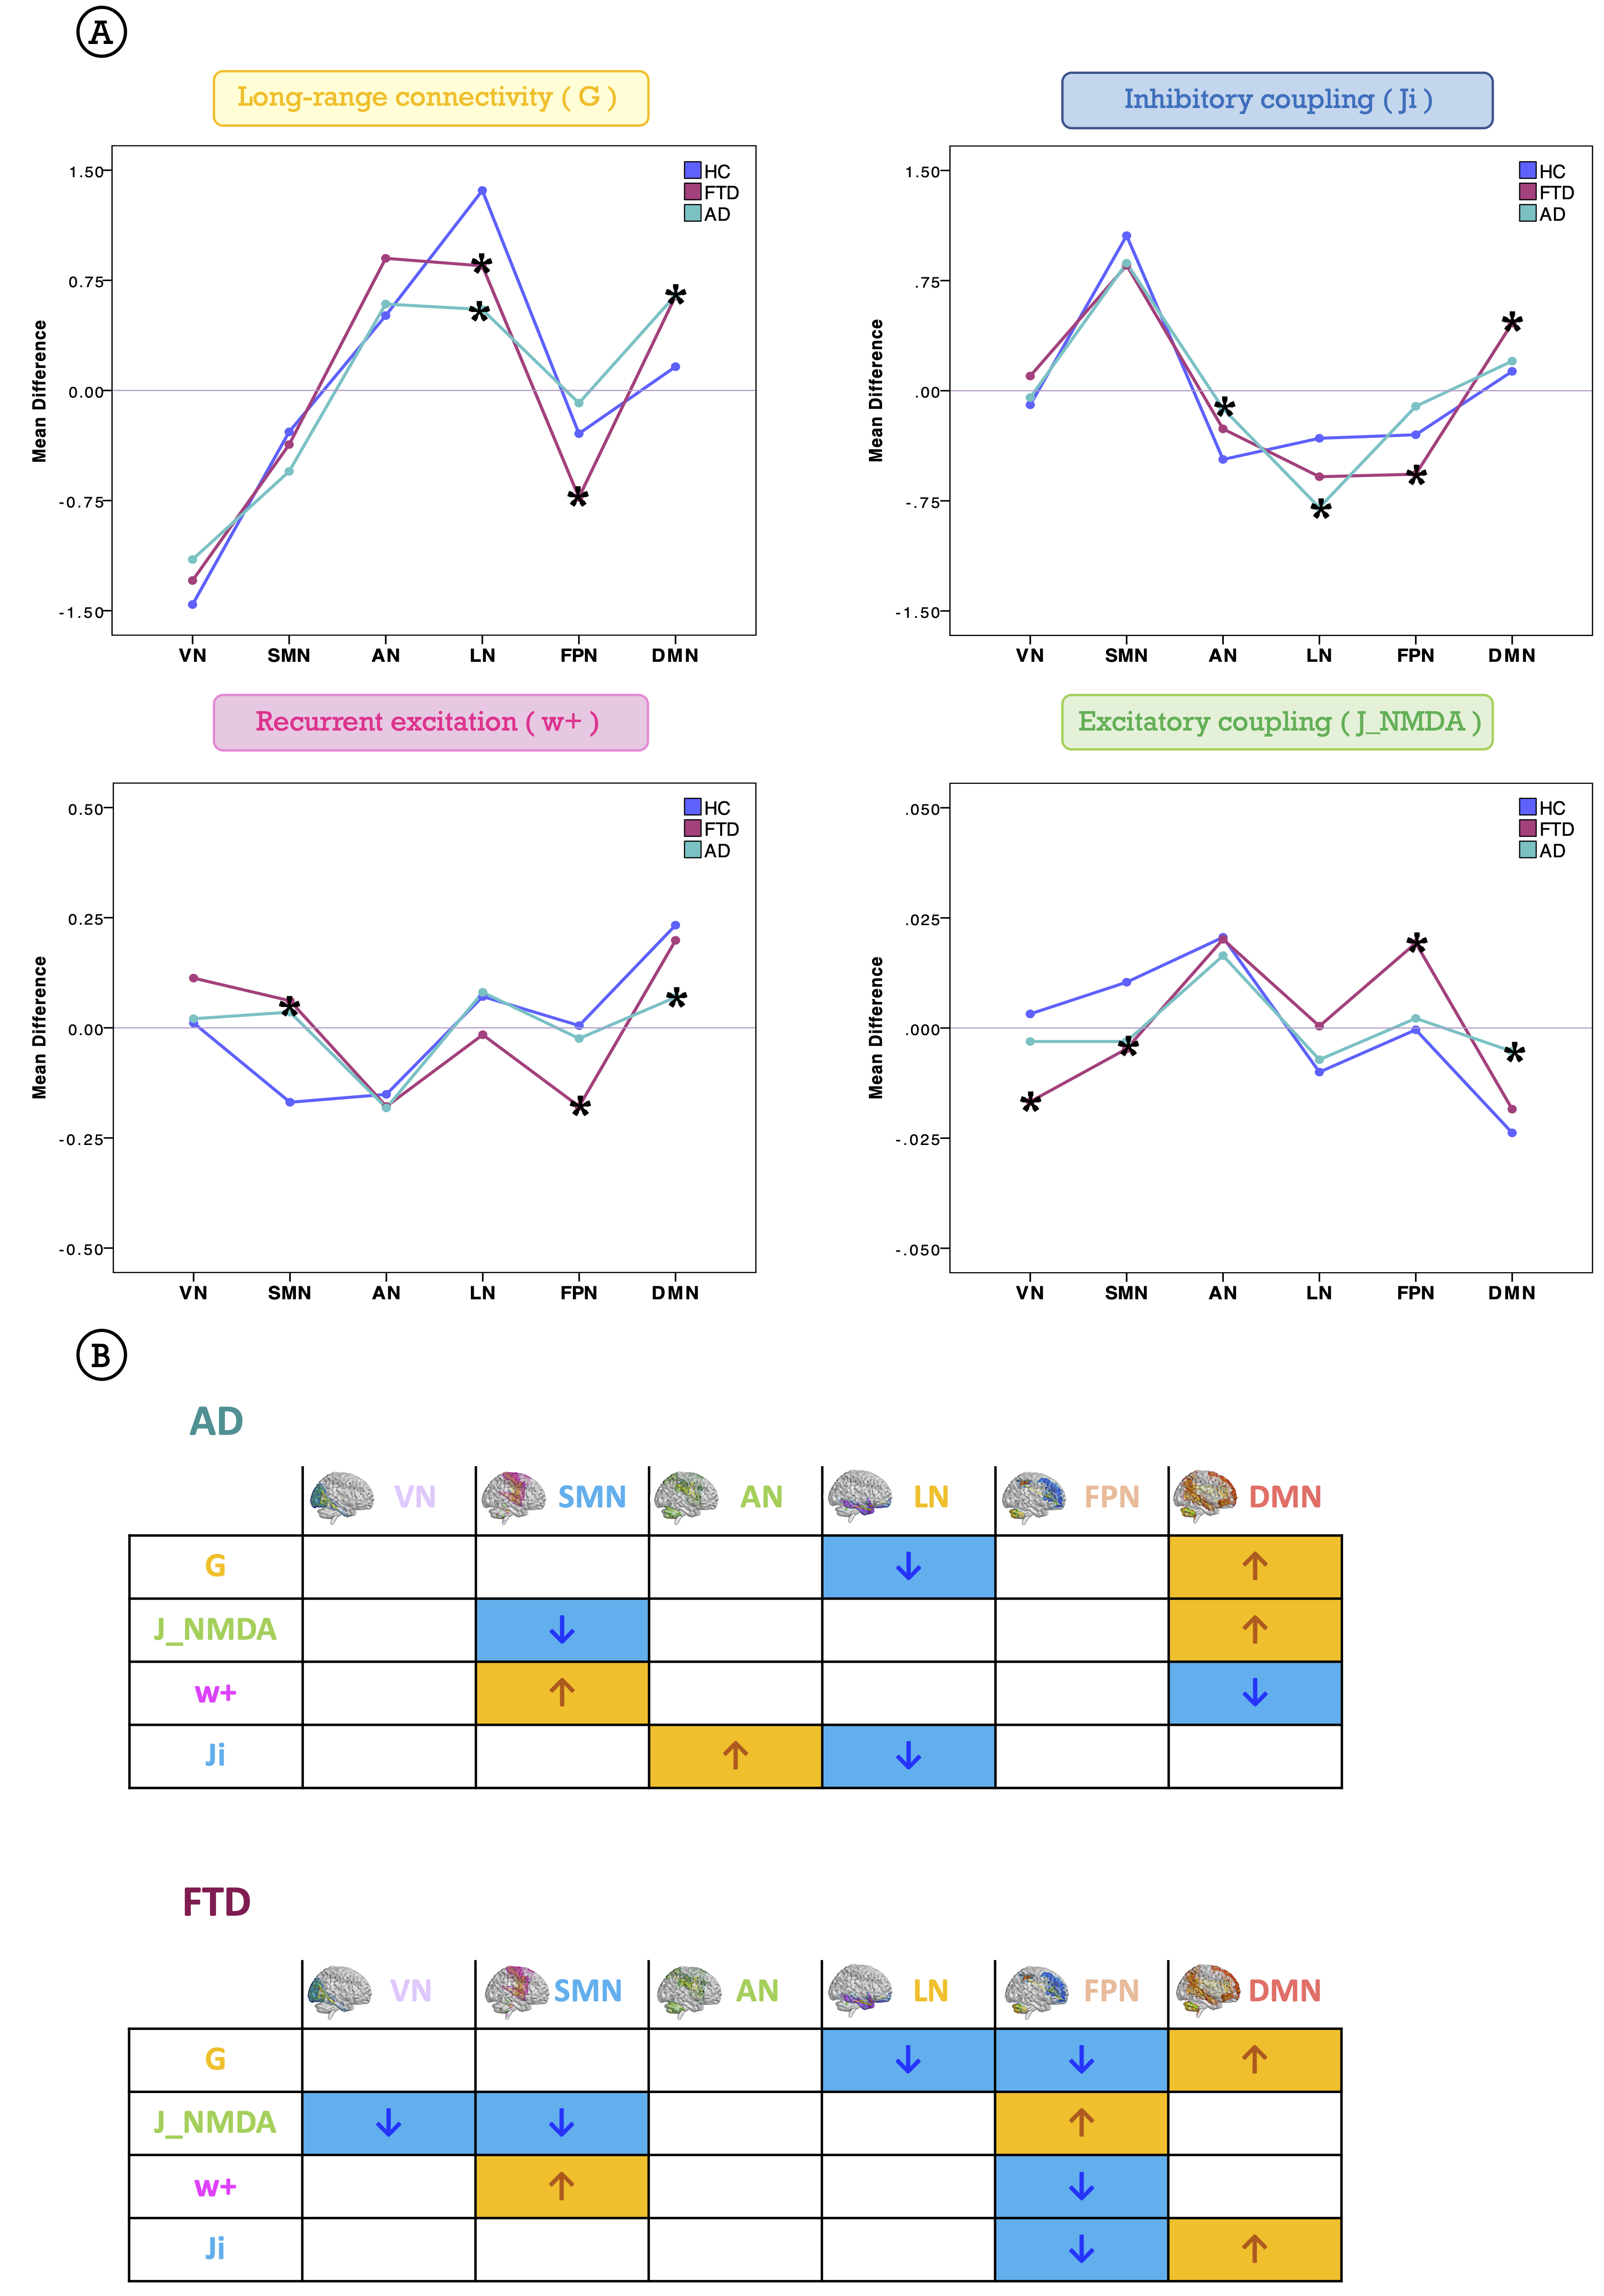
Fig.3| A) Mean difference of each TVB-derived parameter between its value for a network (VN=visual SMN=somatomotor AN=attention LN=limbic FPN=frontoparietal DMN=default mode) against the others. Positive/negative values mean a higher/lower network parameter. Asterisks represent significant differences (p<0.05) between clinical groups (HC=Healthy Controls FTD=Frontotemporal Dementia AD=Alzheimer’s Disease). B) Pathological impact on inter-networks relationship. Arrows indicate the increase or decrease of one network TVB parameters with respect to the others.
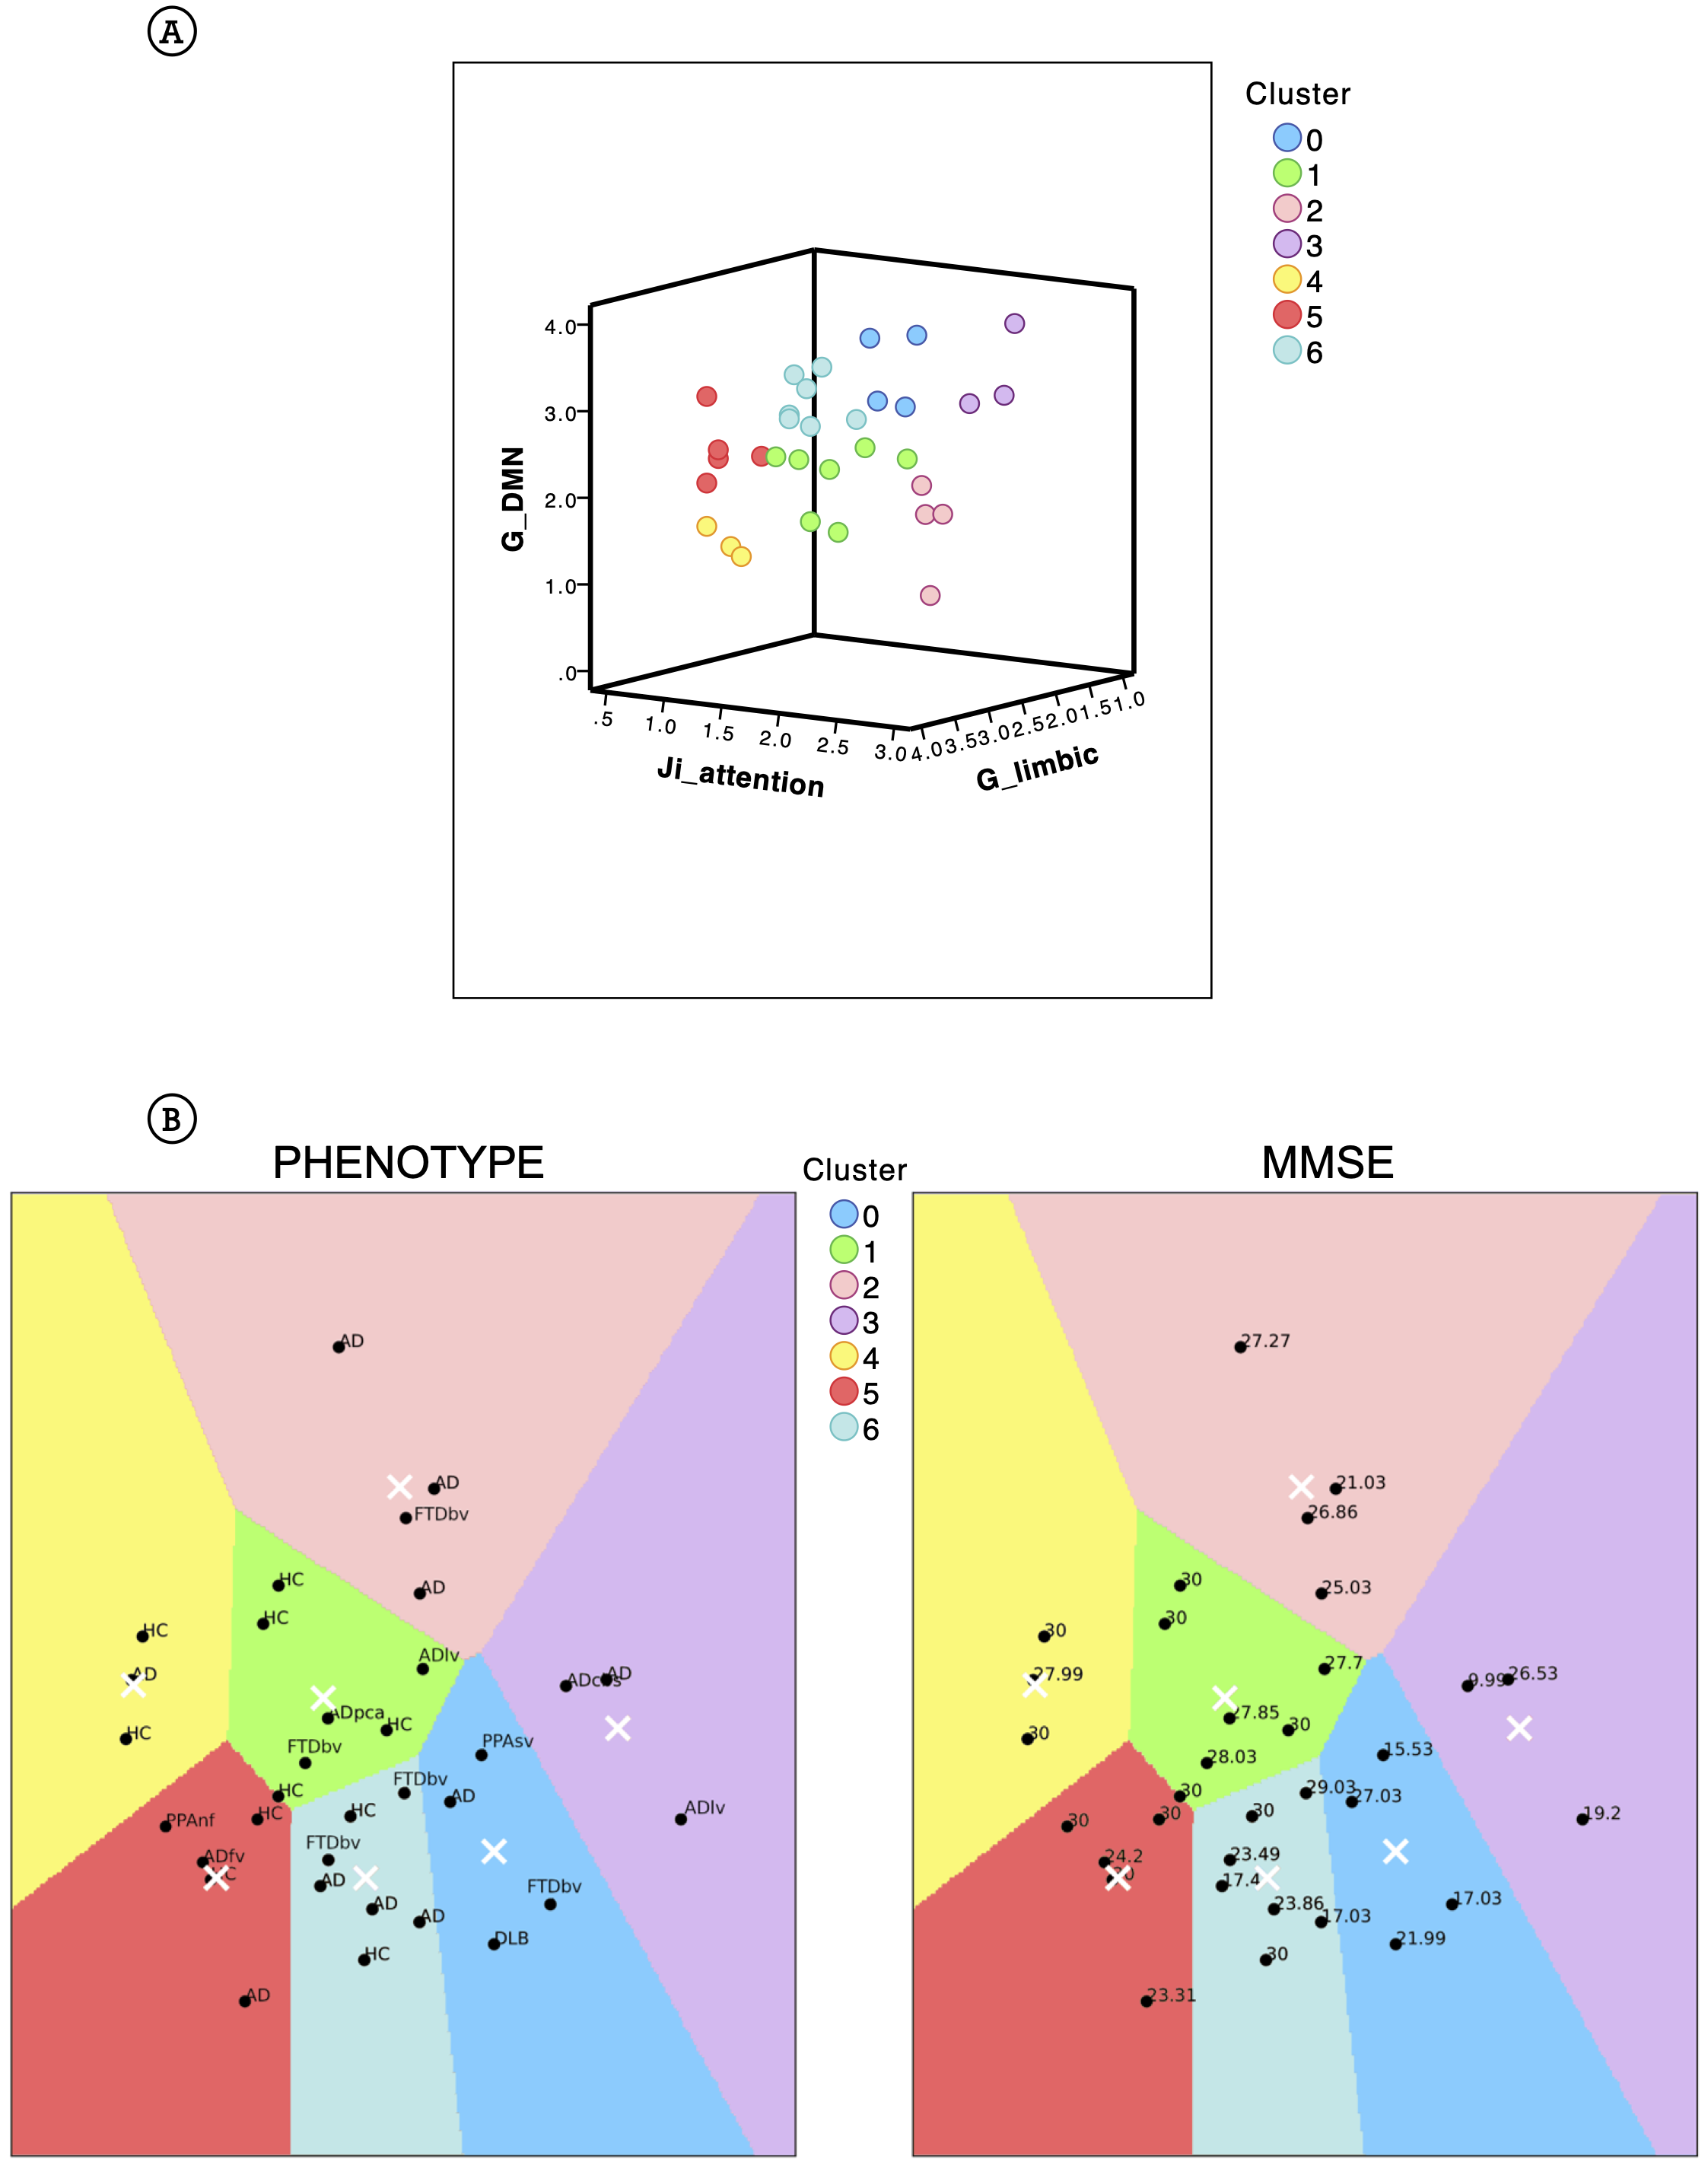
Fig.4| A) Visual representation of the clusters (in different colors) identified looking at cognitive networks’ properties (inhibitory strength of the attention network, long-range connectivity of limbic and default mode networks). Each cluster is characterized by a combination of low/high TVB parameters. B) Distribution of subjects into the clusters, outlining a personalized fingerprint based on cognitive networks properties. Different clinical phenotypes scattered across clusters (left) and patients presenting worst cognitive status (low MMSE) gathered (right).
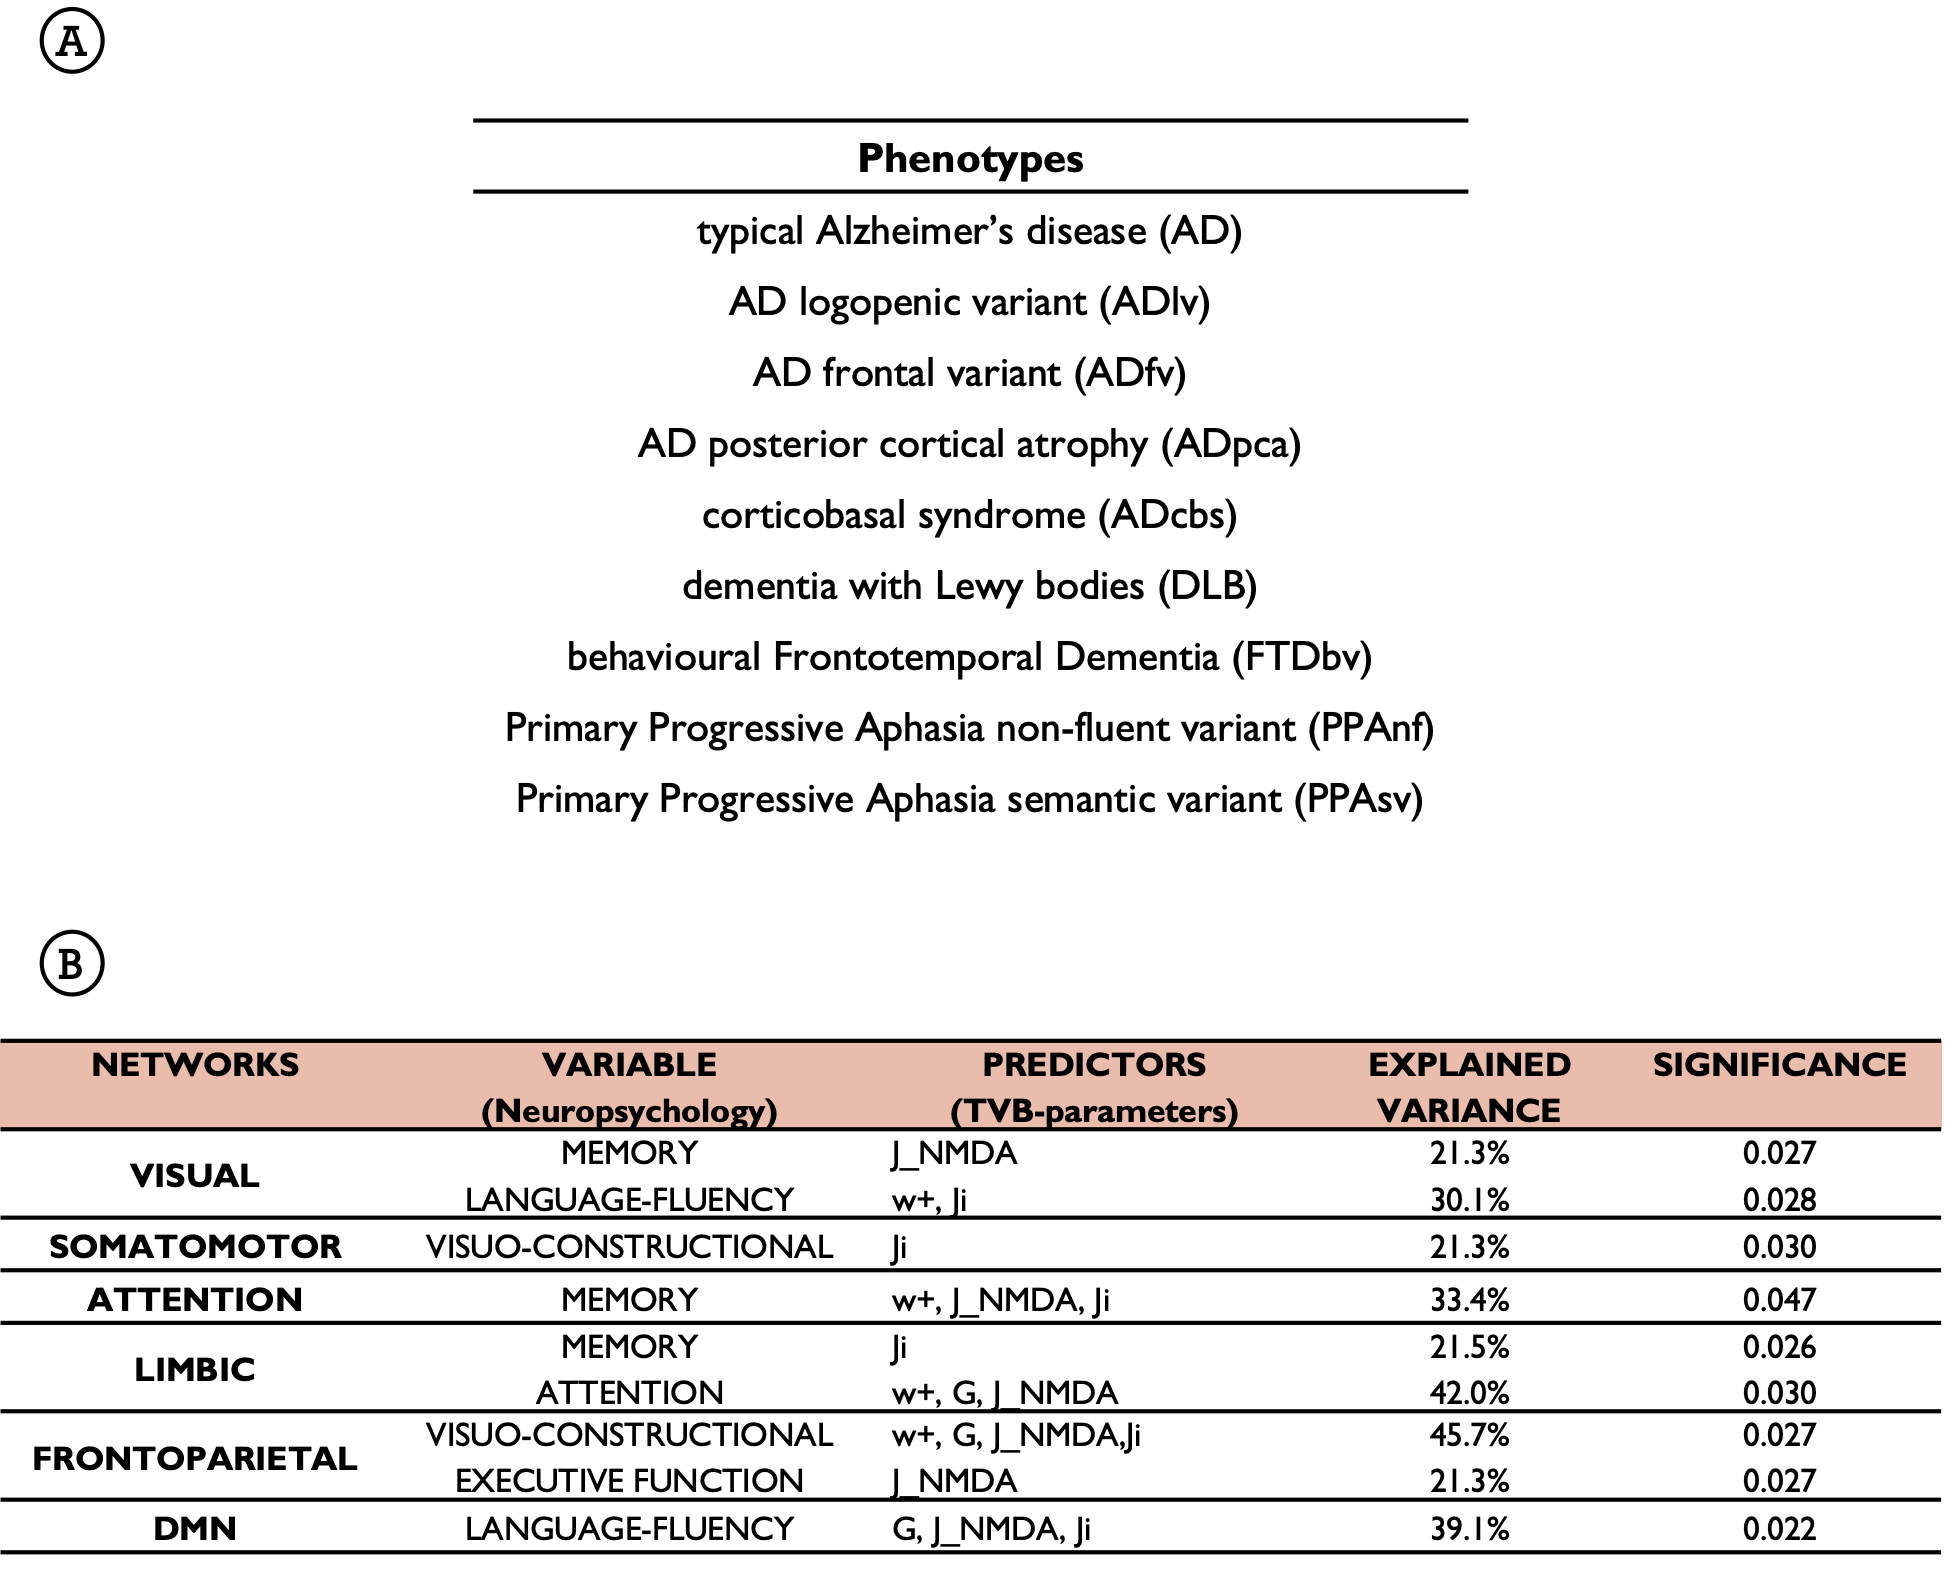
Table.1| A) Typical and atypical clinical phenotypes considered for the analysis. B) The variance explained by the parameters used in backward regressions is calculated with the R2 index, with significant threshold set at p<0.05. Networks specific levels of excitation, inhibition and long-range connectivity contributed to significantly (p<0.05) explain neuropsychological scores variance not in all the cognitive domains, but only in those in which the network itself was known to be involved. This underlines TVB-derived parameters clinical relevance.
DOI: https://doi.org/10.58530/2023/2662