2658
Effects of Subcortical Atrophy and Alzheimer’s pathology on Cognition in Elderly Type 2 Diabetes
Wen Zhang1 and Bing Zhang2
1Radiology, The Affiliated Drum Tower Hospital of Nanjing University Medical School, Nanjing, China, 2The Affiliated Drum Tower Hospital of Nanjing University Medical School, Nanjing, China
1Radiology, The Affiliated Drum Tower Hospital of Nanjing University Medical School, Nanjing, China, 2The Affiliated Drum Tower Hospital of Nanjing University Medical School, Nanjing, China
Synopsis
Keywords: Alzheimer's Disease, Diabetes
Subcortical atrophy and increased cerebral β-amyloid and tau deposition are linked to cognitive decline in type 2 diabetes. However, whether and how subcortical atrophy is related to Alzheimer’s pathology in diabetes remains unclear. We investigated the subcortical structural alterations induced by diabetes and the relationship between subcortical alteration, Alzheimer’s pathology and cognition. Our results suggested that although both type 2 diabetes and AD are correlated with subcortical neurodegeneration, type 2 diabetes have no direct or indirect effect on the cerebral amyloid deposition and CSF p-tau.Introduction
Subcortical atrophy and increased cerebral β-amyloid and tau deposition are linked to cognitive decline in type 2 diabetes1. However, whether and how subcortical atrophy is related to Alzheimer’s pathology in diabetes remains unclear2. This study therefore aimed to investigate subcortical structural alterations induced by diabetes and the relationship between subcortical alteration, Alzheimer’s pathology and cognition.Methods
Participants were 150 patients with type 2 diabetes and 598 propensity score-matched controls without diabetes from the Alzheimer’s Disease Neuroimaging Initiative. All subjects underwent cognitive assessments, magnetic resonance imaging (MRI), and apolipoprotein E (ApoE) genotyping, with a subset that underwent amyloid positron emission tomography (PET) and cerebrospinal fluid (CSF) assays to determine cerebral β-amyloid deposition (n = 337) and CSF p-tau (n = 433). Subcortical structures were clustered into five modules based on Pearson’s correlation coefficients of volumes across all subjects: the ventricular system, the corpus callosum, the limbic system, the diencephalon, and the striatum. Using structural equation modeling (SEM)3, we investigated the relationships among type 2 diabetes, subcortical structural alterations, and AD pathology.Results
Compared with the controls, the diabetic patients had significant reductions in the diencephalon and limbic system volumes; moreover, patients with longer disease duration (> 6 years) had more severe volume deficit in the diencephalon. SEM suggested that type 2 diabetes, age, and the ApoE ε4 allele (ApoE-ε4) can affect cognition via reduced subcortical structure volumes (total effect: age > ApoE-ε4 > type 2 diabetes). Among them, age and ApoE-ε4 strongly contributed to AD pathology, while type 2 diabetes neither directly nor indirectly affected AD biomarkers.Conclusion
Our study suggested the subcortical atrophy mediated the association of type 2 diabetes and cognitive decline. Although both type 2 diabetes and AD are correlated with subcortical neurodegeneration, type 2 diabetes have no direct or indirect effect on the cerebral amyloid deposition and CSF p-tau.Acknowledgements
Date of this study were obtained from the Alzheimer’s Disease NeuroimagingInitiative (ADNI) database (adni.loni.usc.edu).References
- Dos Santos Matioli MNP, Suemoto CK, Rodriguez RD, Farias DS, da Silva MM, Leite REP, Ferretti-Rebustini REL, Farfel JM, Pasqualucci CA, Jacob Filho W, Arvanitakis Z, Naslavsky MS, Zatz M, Grinberg LT, Nitrini R. Diabetes is Not Associated with Alzheimer's Disease Neuropathology. J Alzheimers Dis. 2017;60(3):1035-1043.
- Kandimalla R, Thirumala V, Reddy PH. Is Alzheimer's disease a Type 3 Diabetes? A critical appraisal. Biochim Biophys Acta Mol Basis Dis. 2017 May;1863(5):1078-1089.
- Cheung MW. Some reflections on combining meta-analysis and structural equation modeling. Res Synth Methods. 2019 Mar;10(1):15-22.
Figures
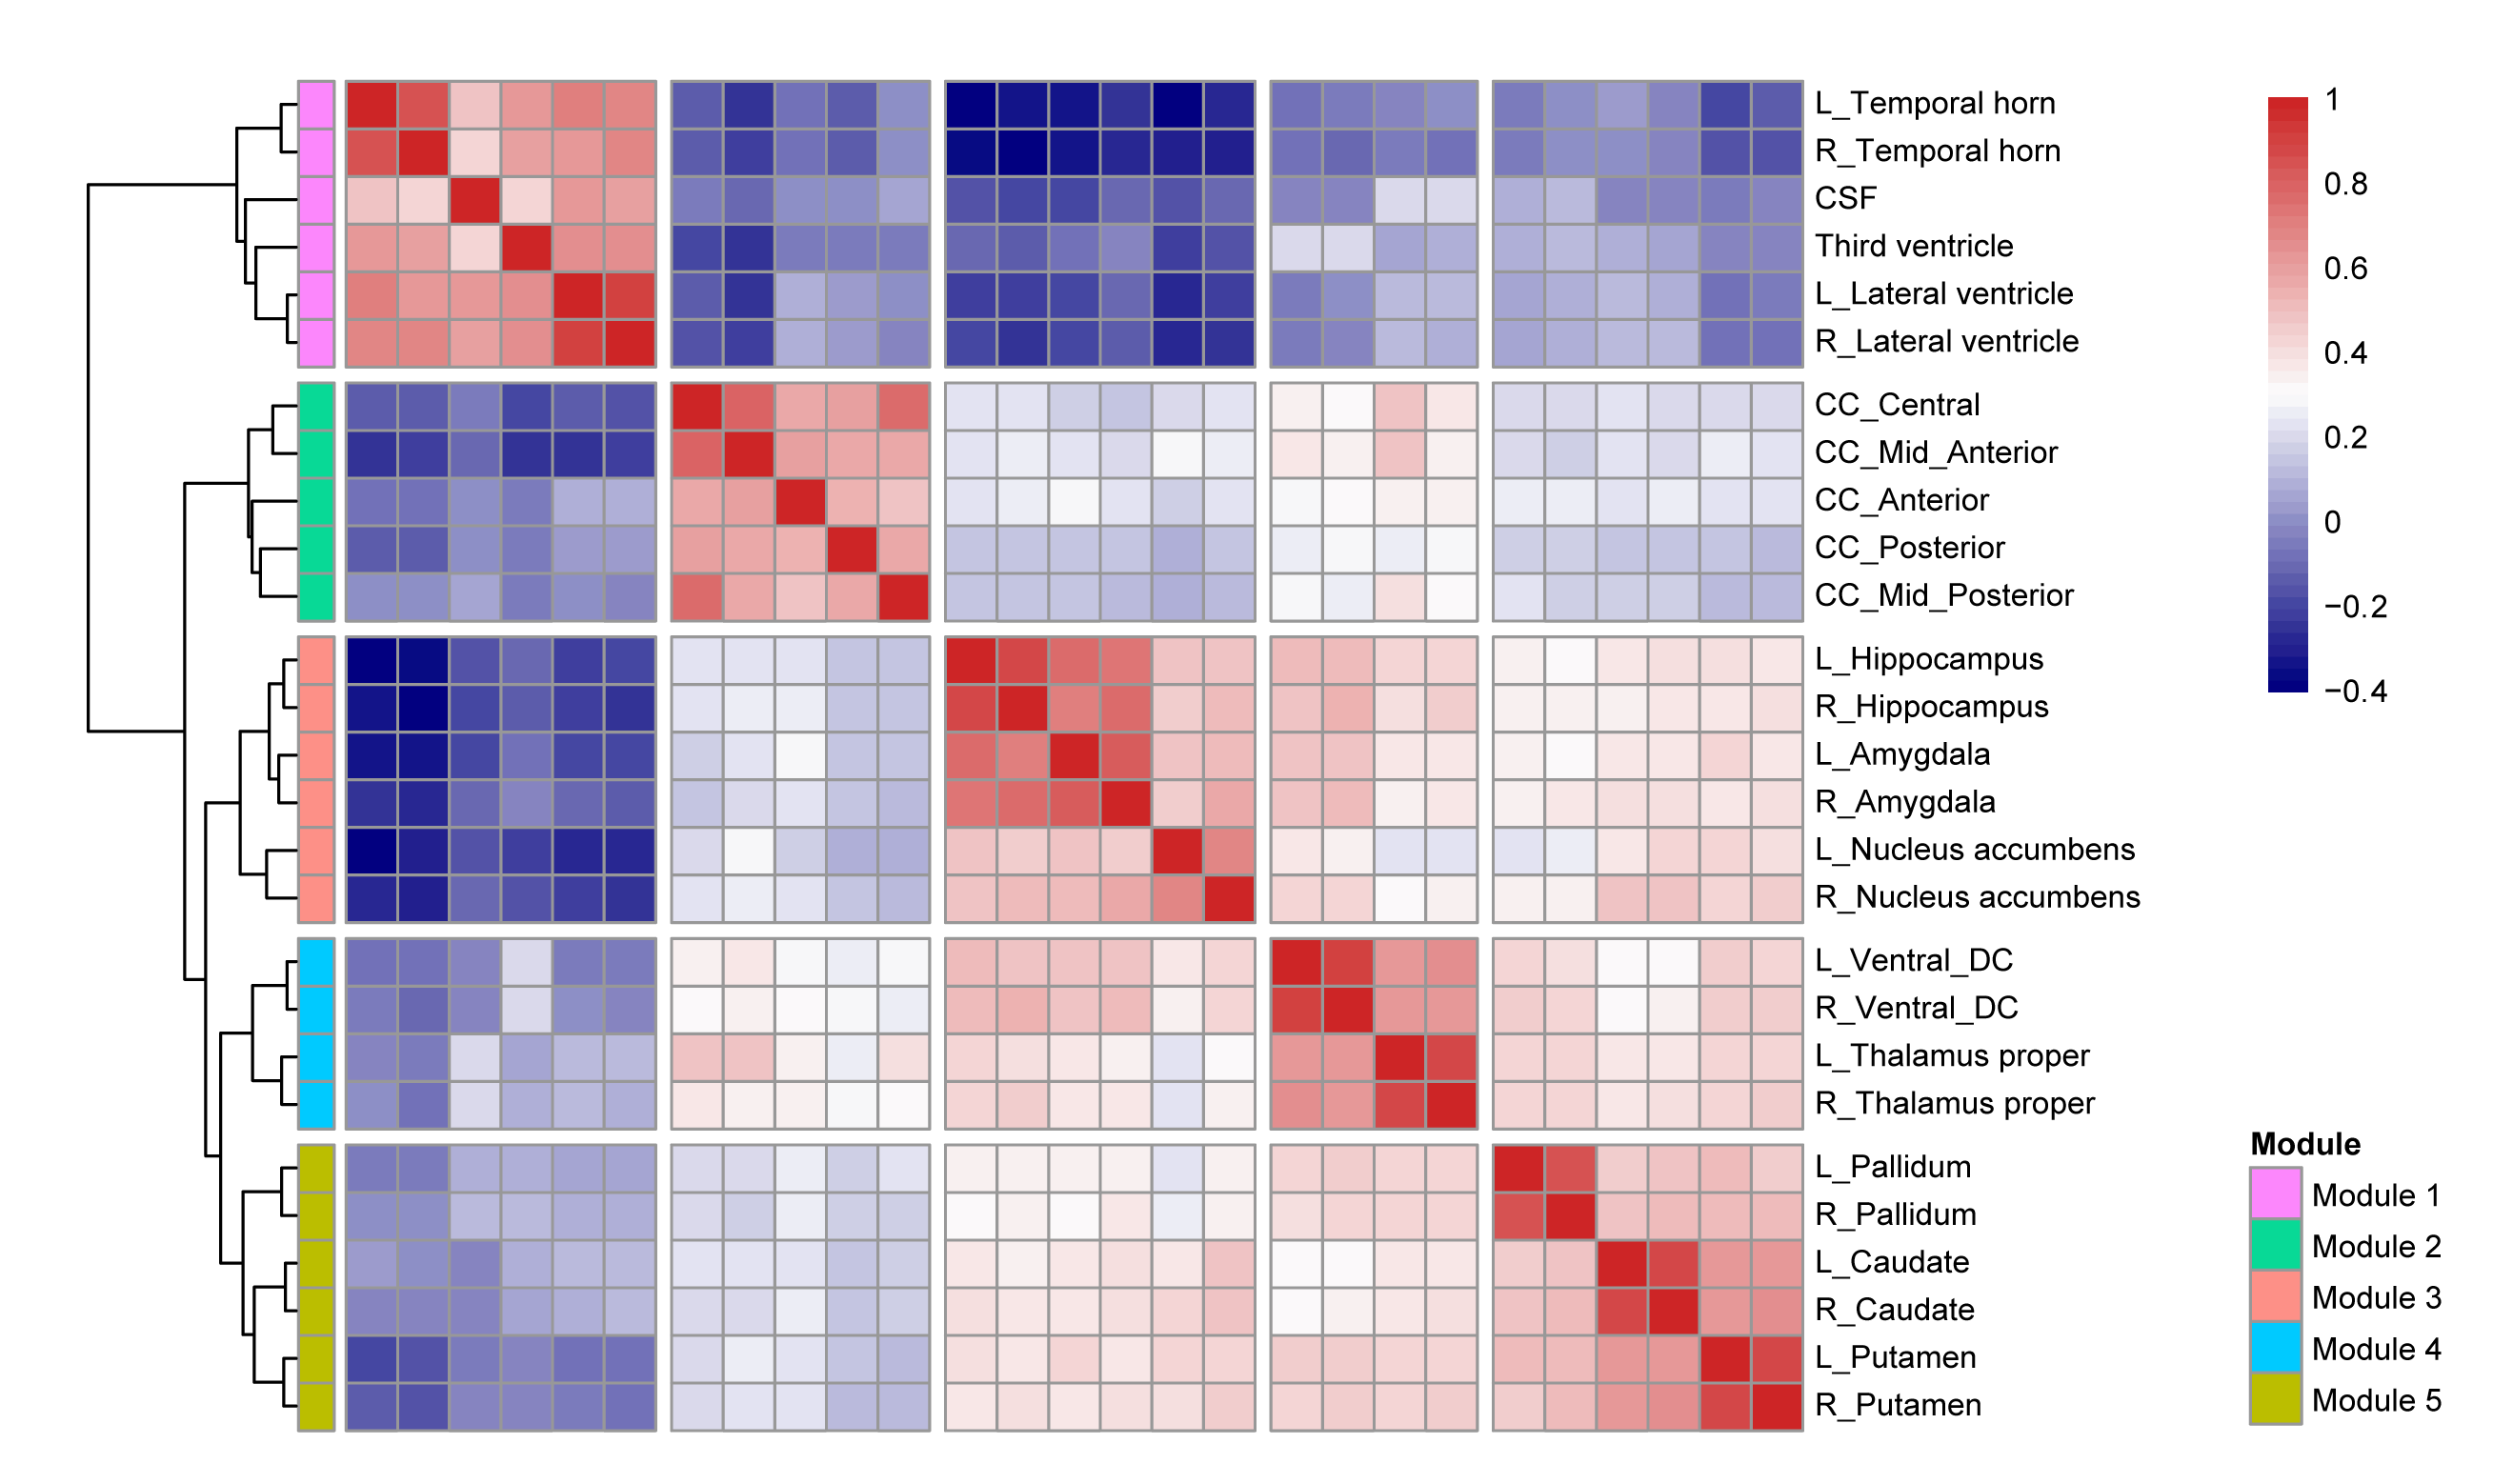
Hierarchical clustering and correlation heatmap of 27 subcortical structures across all subjects.
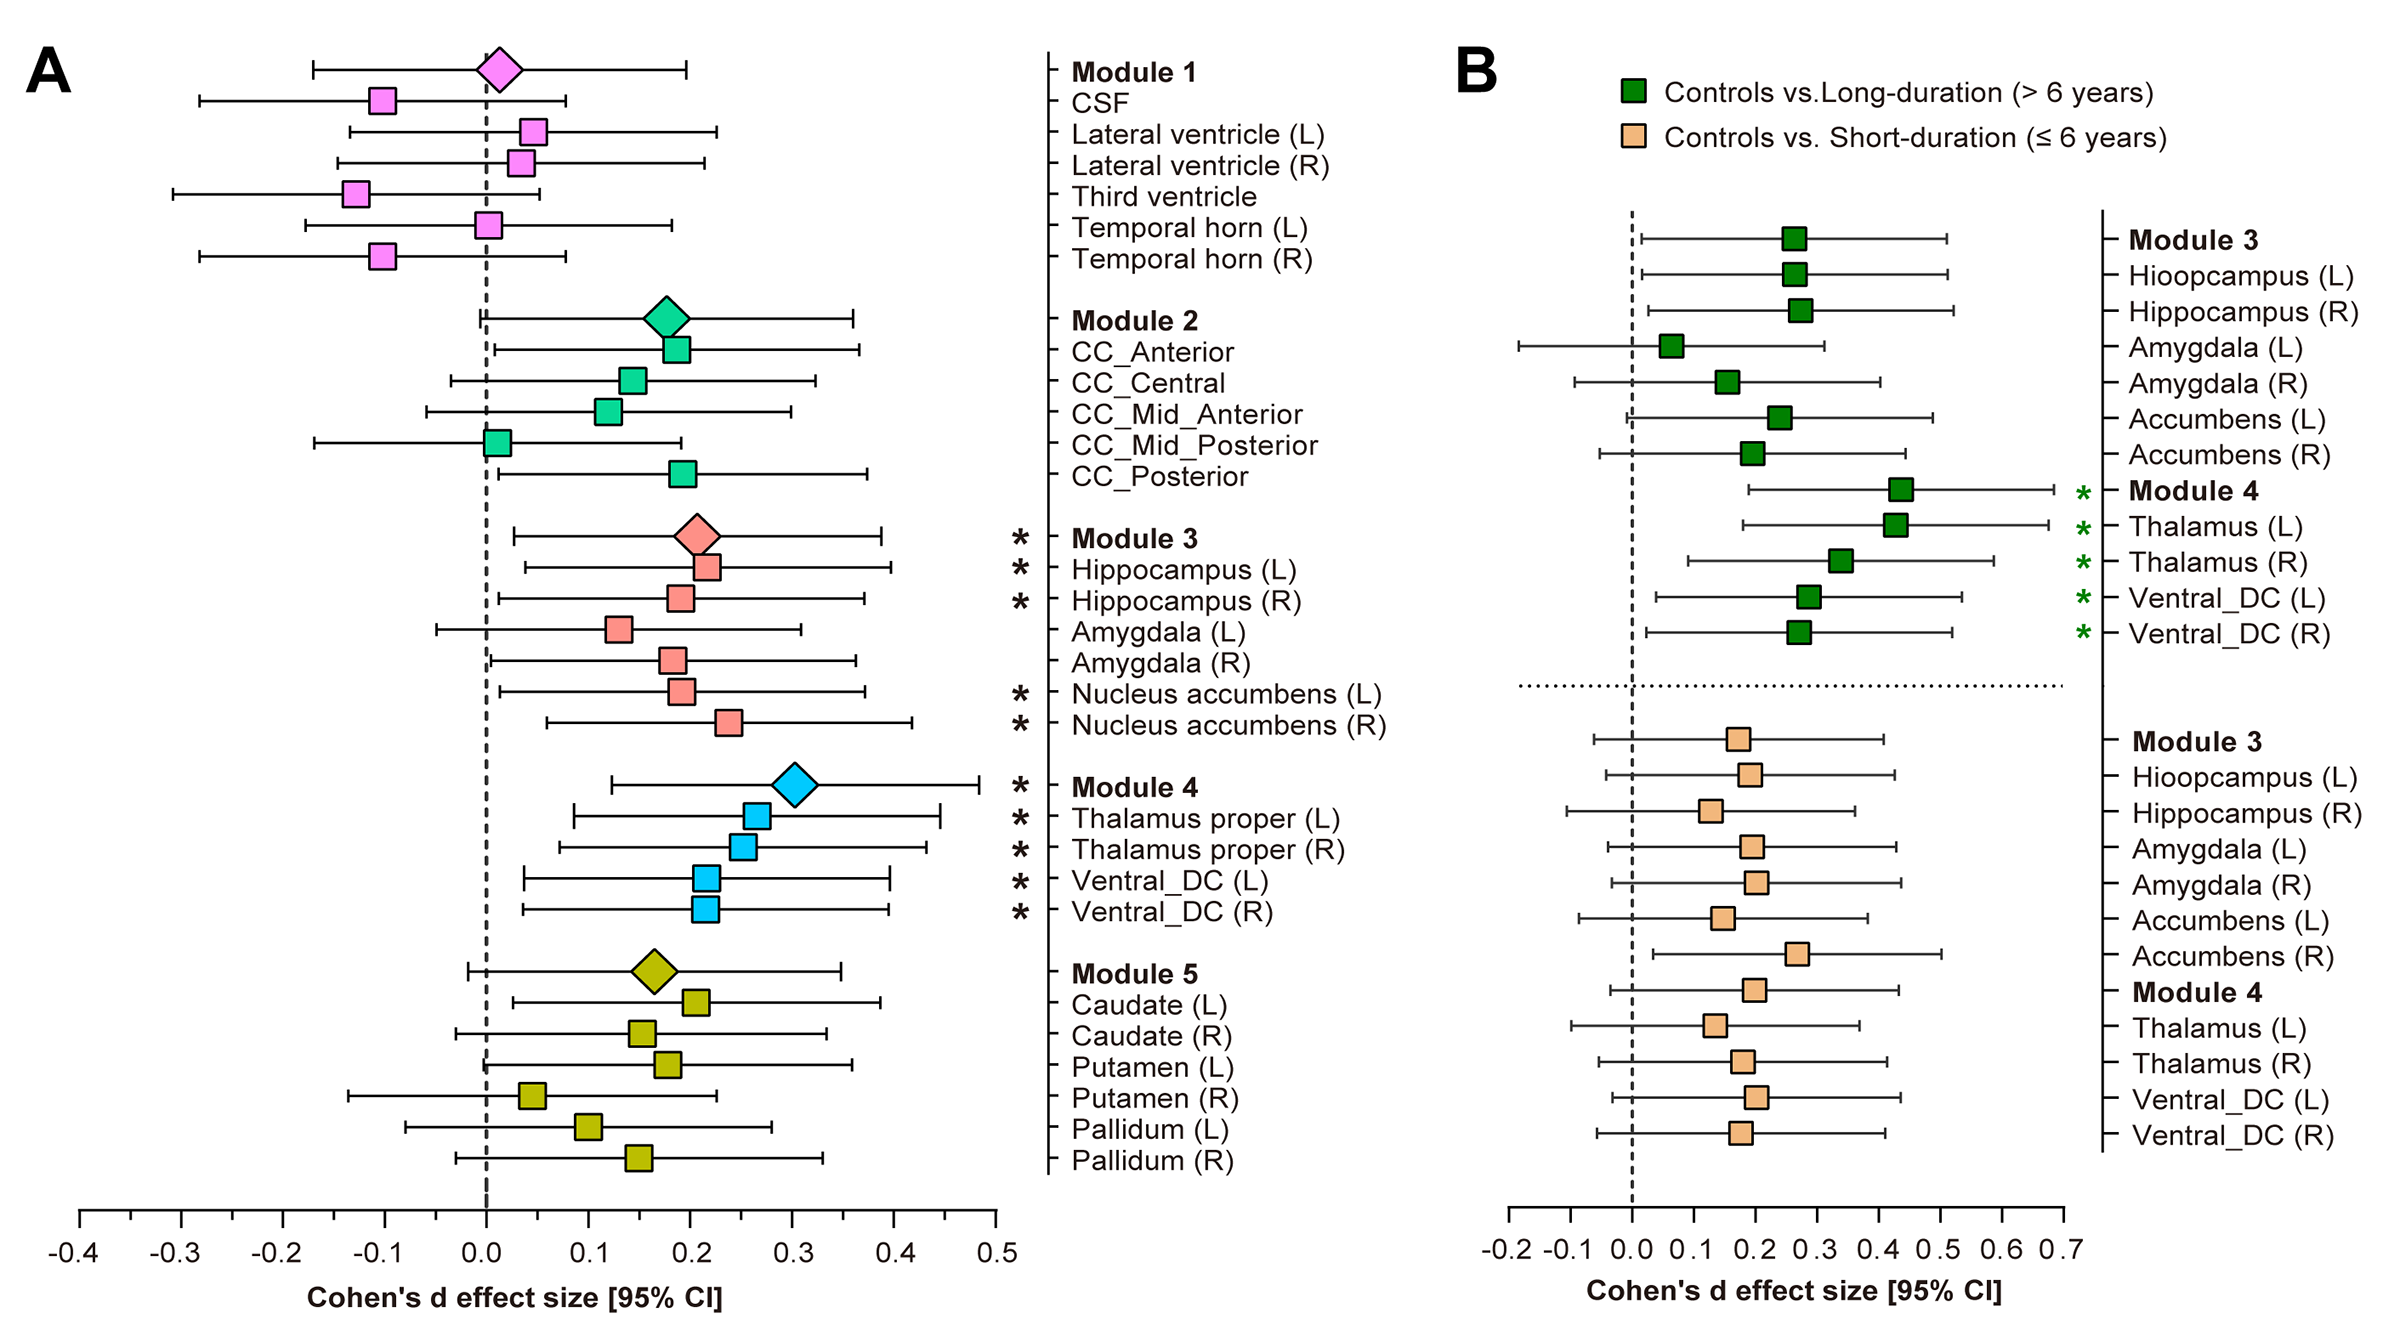
Volumetric trait module-based analysis of subcortical structures between
type 2 diabetes and controls. (A) Cohen’s d effect size and 95% CI for the differences in subcortical
structures between controls and type 2 diabetes patients. (B) Cohen’s d effect size and 95% CI for the subcortical
volume differences in Modules 3 and 4 between long-duration (green pattern) and
short-duration (orange pattern) diabetes patients, vs. controls. *Indicates p < 0.05 after false discovery rate (FDR) correction per
module.
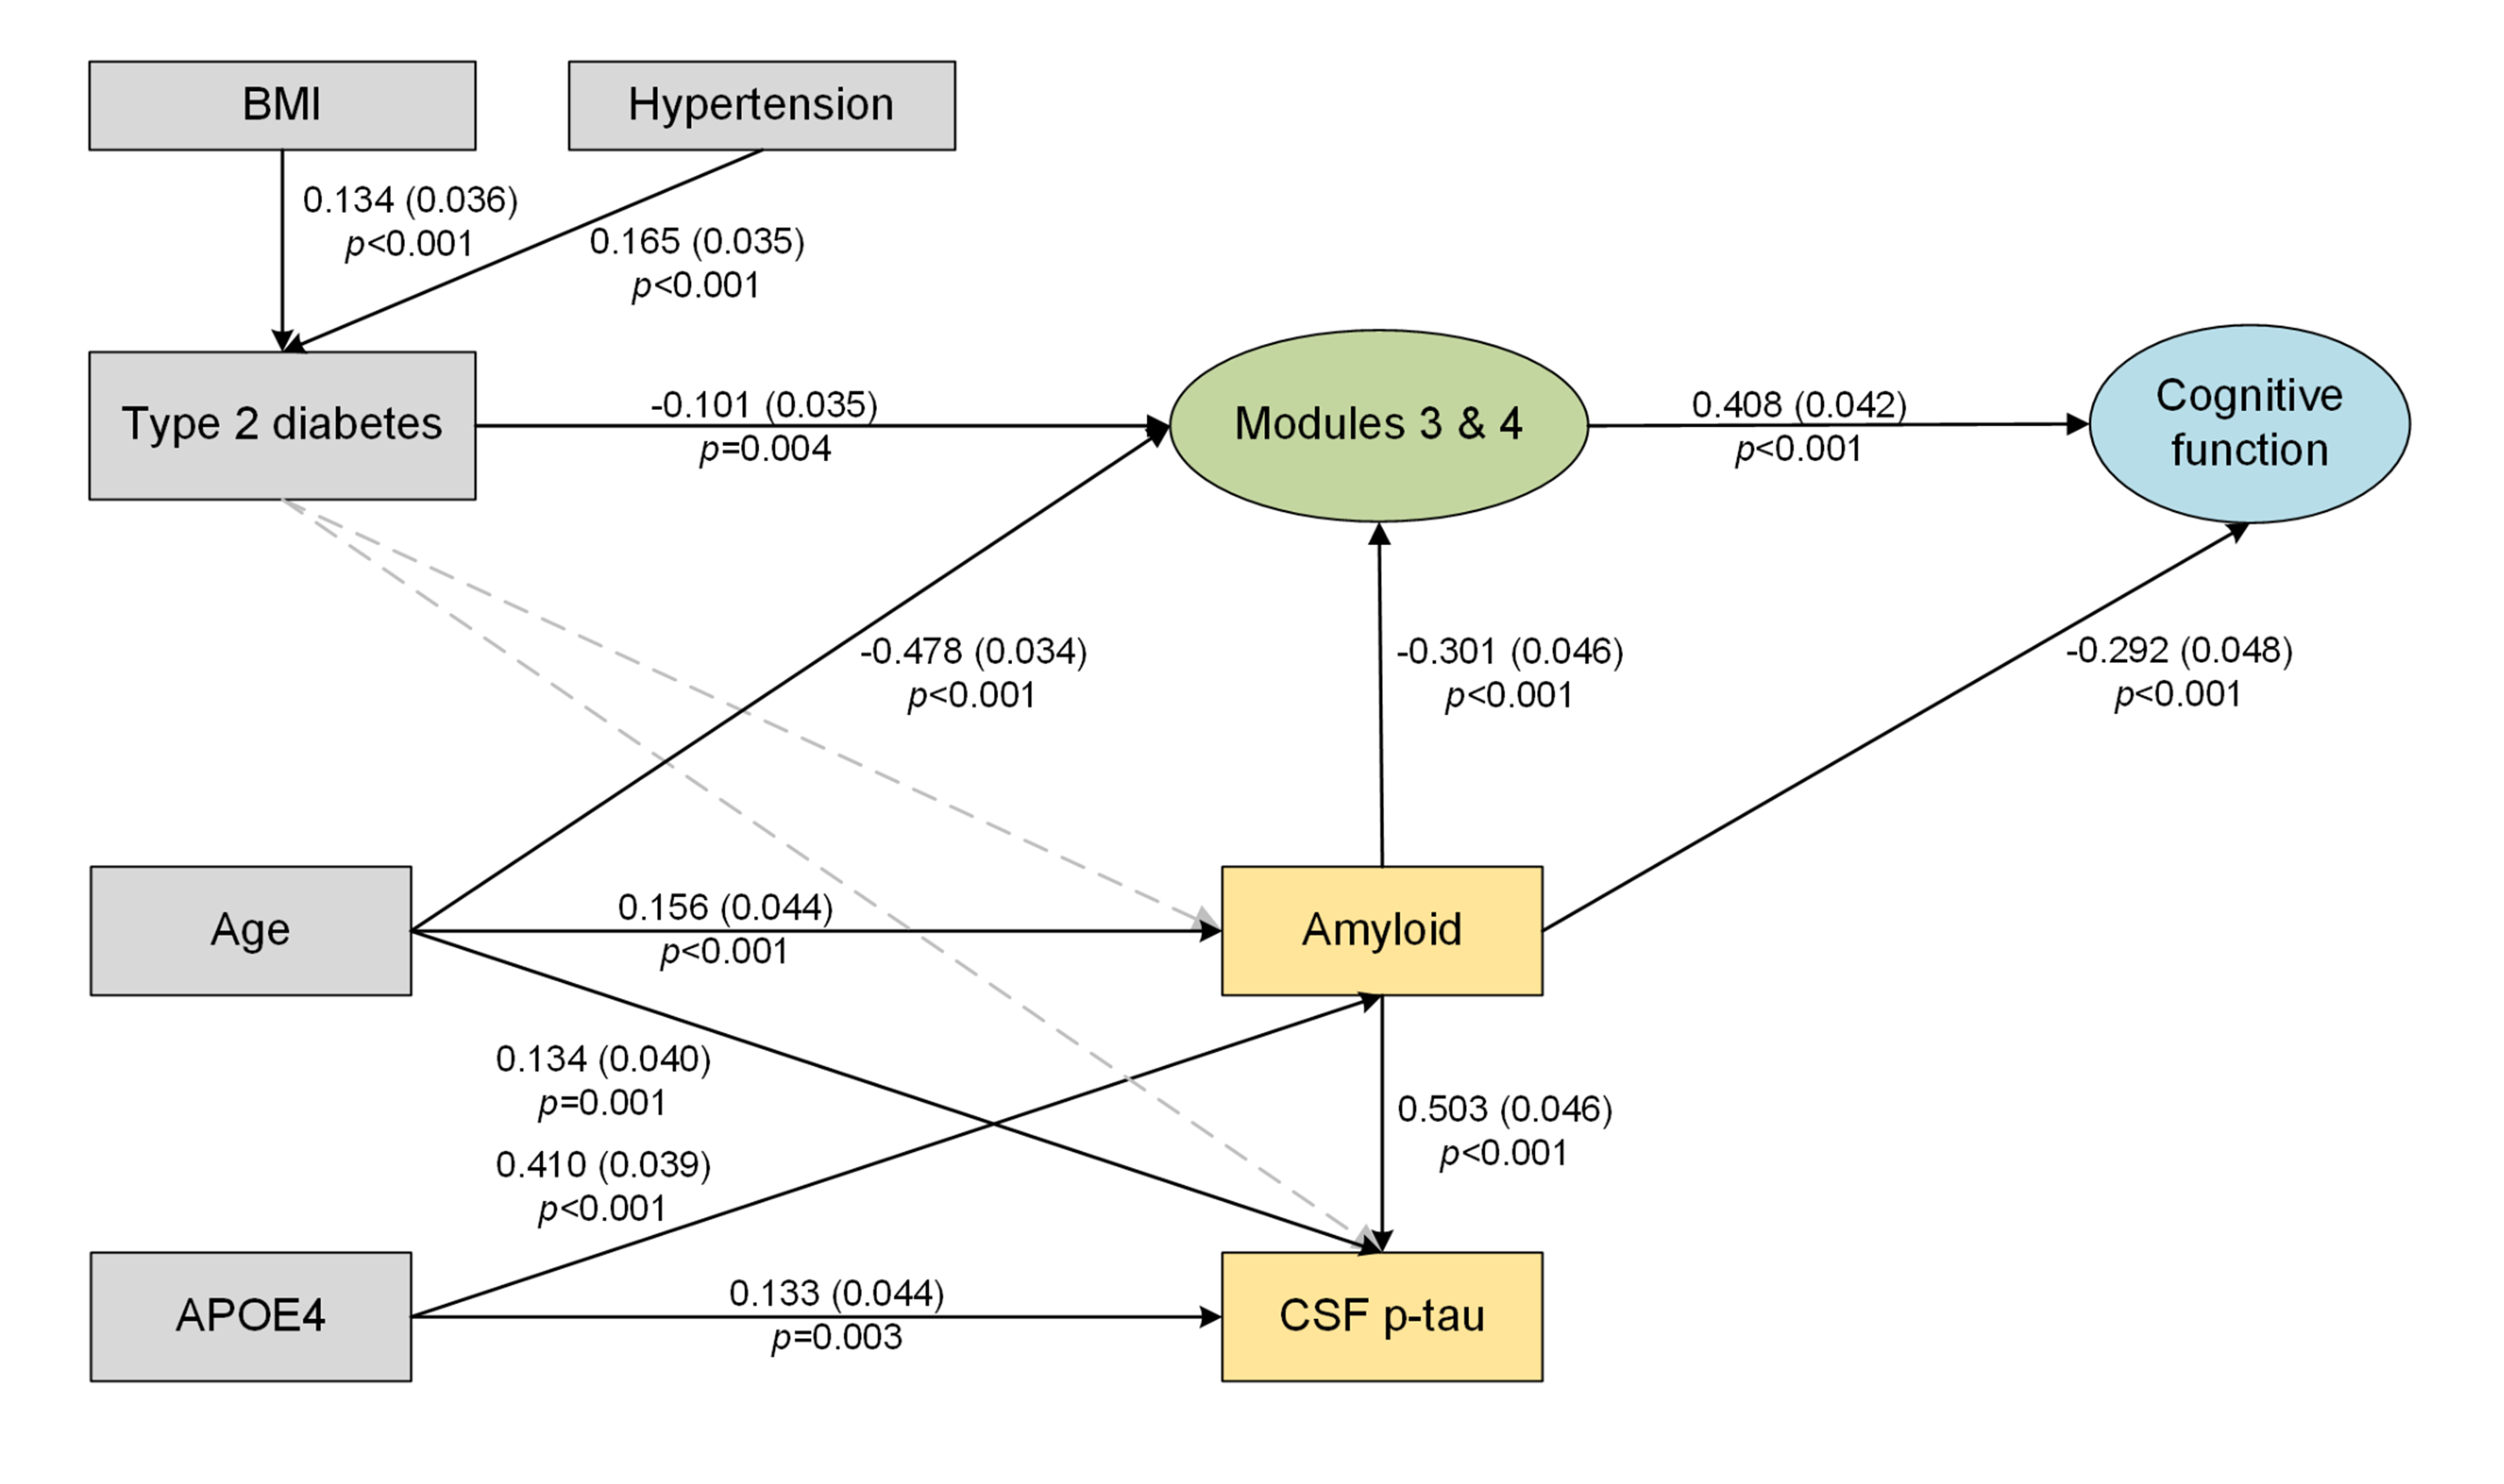
Structural equation model of subcortical structures (Modules 3 and 4), AD
biomarkers and cognitive function. Solid line arrows are statistically
significant associations in the model. The standardized coefficients, standard
errors (in brackets), and P-values are shown beside the solid arrows.
DOI: https://doi.org/10.58530/2023/2658