2657
Microstructure of the Fornix Correlates with Cognitive Status in Alzheimer’s Disease1The Cleveland Clinic, Cleveland, OH, United States, 2Imaging Institute, The Cleveland Clinic, Cleveland, OH, United States, 3Brain Health and Memory Center, Neurological Institute, University Hospitals Cleveland Medical Center, Cleveland, OH, United States, 4Lou Ruvo Center for Brain Health, The Cleveland Clinic, Cleveland, OH, United States
Synopsis
Keywords: Alzheimer's Disease, Dementia
Imaging measures of tissue microstructure of the fornix are are potential biomarkers for cognitive decline in Alzheimer’s disease (AD). However, partial volume averaging (PVA) between the fornix and cerobrospinal fluid can be substantial. As a result, measured changes may reflect atrophy, not changes in tissue microstructure. Neurite Orientation Dispersion and Direction Imaging and Free Water Elimination diffusion tensor imaging account for PVA. We present results from a cohort of AD patients, patients with mild cognitive impairment (MCI) and cognitively normal (CN) subjects, showing that NODDI and DTI measures correlate with specific scores cognitive status.INTRODUCTION
A number of biomarkers have shown a relationship to cognitive decline in Alzheimer’s Disease (AD), but reports have been mixed1-4. Imaging measures of tissue microstructure of the fornix are potential biomarkers for cognitive decline5. However, partial volume averaging (PVA) between the fornix and surrounding cerebrospinal fluid (CSF) can be substantial. As a result, measured changes may reflect atrophy, not changes in tissue microstructure. Neurite Orientation Dispersion and Direction Imaging (NODDI) accounts for PVA by modeling signal in terms of a tissue and a CSF component6 as do free water elimination diffusion tensor imaging (DTI) methods that take advantage acquisitions with multiple diffusion weightings7,8. We present results from a cohort of AD patients, patients with mild cognitive impairment (MCI) and cognitively normal (CN) subjects, showing that NODDI and DTI measures correlate with specific scores cognitive status.METHODS
Eighteen subjects were enrolled in the Cleveland Alzheimer’s Disease Research Center under an IRB approved protocol. A panel composed of neurologists and neuropsychologists completed a consensus diagnosis for each subject. Five were diagnosed with AD, six with MCI and seven were CN. Each subject was scanned on a 3T Siemens Prisma with a standard 32-channel head coil (Siemens Healthineers, Erlangen). Multishell diffusion imaging acquisitions (2mm isotropic voxels, 13/6/48/60 b=0/500/1000/2000 sec/mm2) underwent distortion, eddy current and motion correction with the topup and eddy packages9 followed by a voxelwise fit with the NODDI toolbox6,10. DTI parameters were determined with the free water elimination method proposed by Hoy et al.7 and implemented by Henriques et al.11. For DTI, only images with diffusion weighting less than 1500sec/mm2 were used in order to limit contributions from nongaussian diffusion12. A 1mm isotropic MPRAGE was used to define the fornix13 and coregistered to diffusion space with align_epi_anat14. Median values of NODDI and DTI measures of tissue microstructure in fornix were summarized as candidate biomarkers of cognitive status. ANOVA analysis was used to identify NODDI and DTI parameters that distinguish the AD, MCI and CN groups. Tests of cognitive function covered the domains of processing speed, executive function, memory and verbal fluency. Correlation between each of the microstructure and cognitive scores was calculated. A false discovery rate correction was performed to control for multiple comparisons15 with an type 1 error rate of 0.05. Uncorrected pvalues are reported.RESULTS
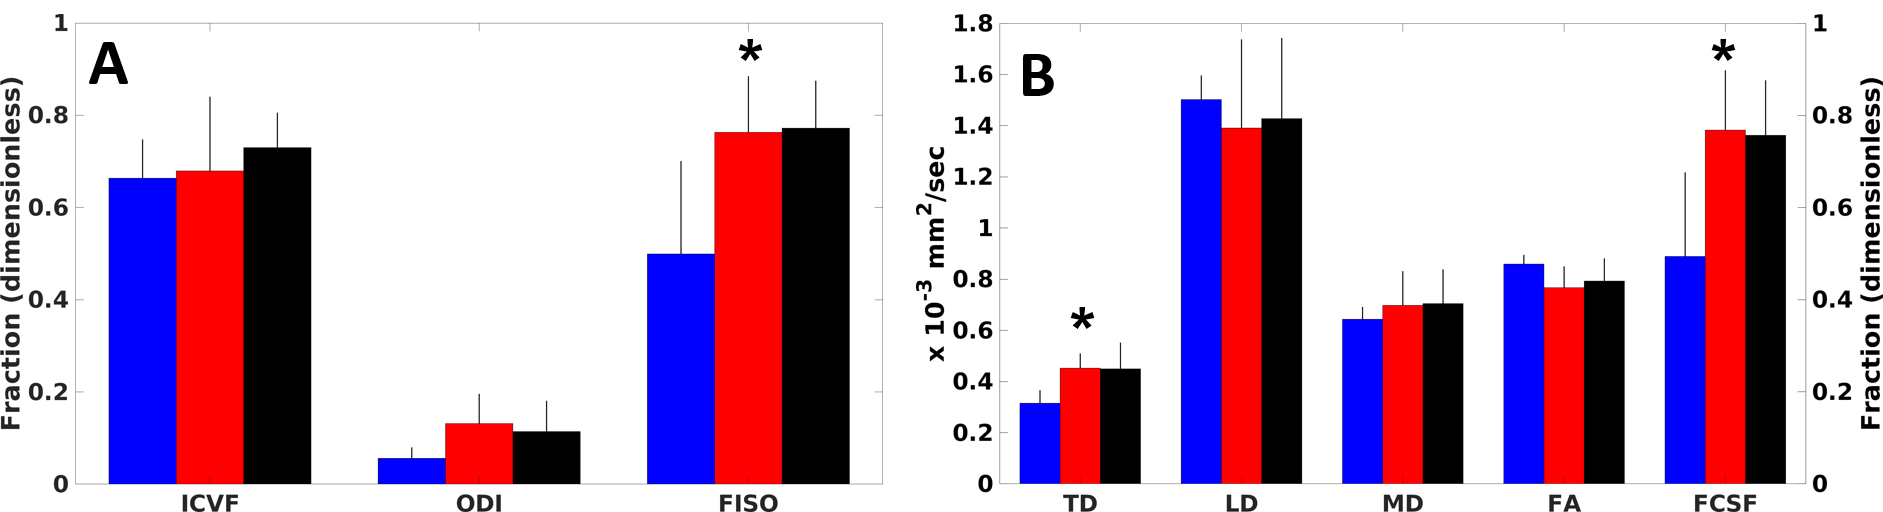
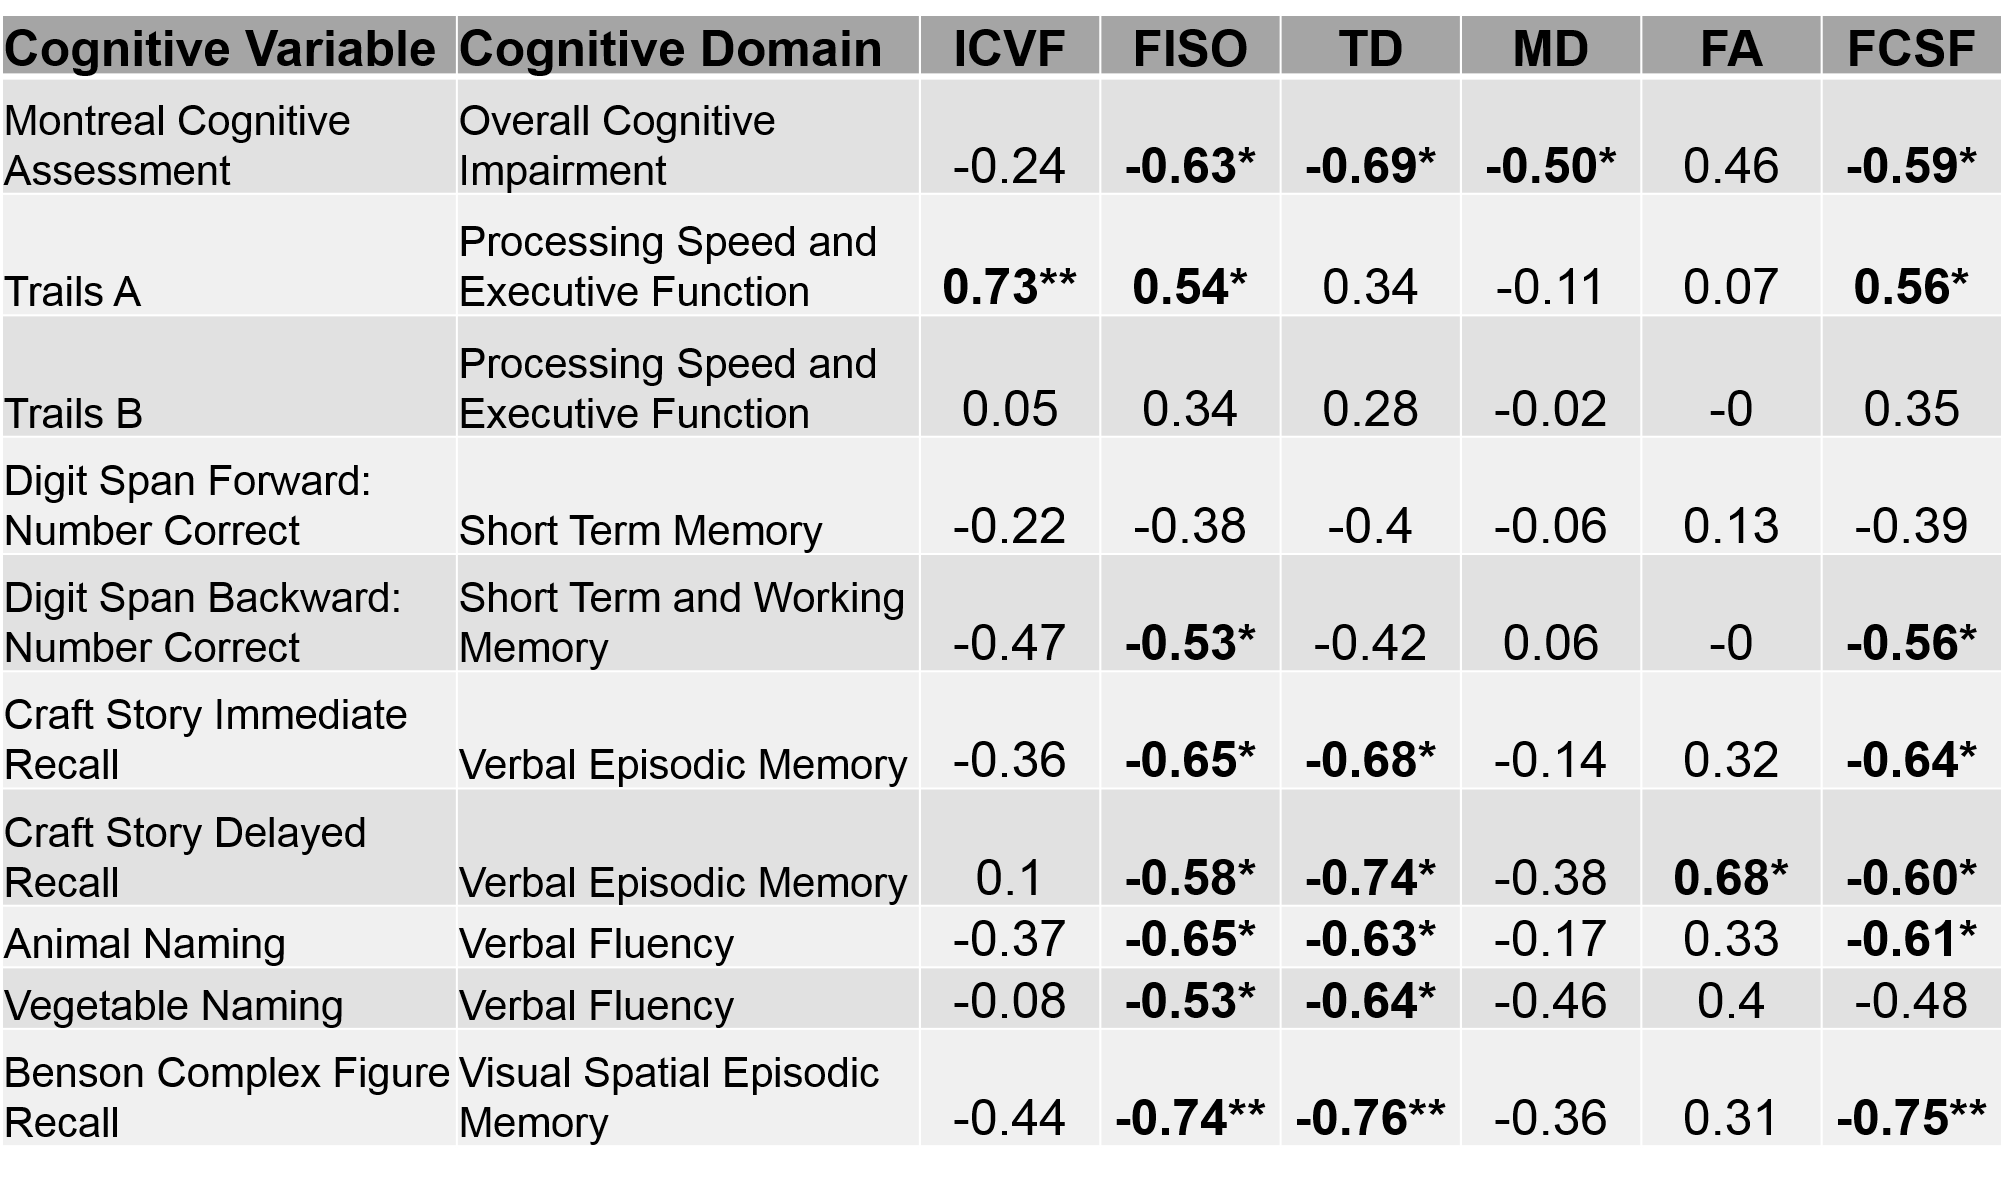
Figure 1 summarizes imaging parameters among the groups. NODDI generates three parameters, intracellular volume fraction (ICVF), orientation dispersion index (ODI) and isotropic volume fraction (FISO). FISO demonstrates significant differences between the groups (p < 0.01). DTI with free water elimination generates an estimate of cerebrospinal fluid fraction (FCSF) as well as standard microstructure parameters for the remaining tissue fraction (Fractional Anisotropy (FA), Mean Diffusivity (MD), Transverse Diffusivity (TD), Longitudinal Diffusivity (LD)). FCSF and TD show significant differences among groups (p < 0.008). Table 1 summarizes correlations among imaging and cognitive scores. Among NODDI measures, only FISO showed significant correlations with most of the cognitive measures (p < 0.04). ICVF shows a significant correlation with the trail-making test A, but the correlation is unexpectedly positive. Higher values of ICVF are associated with higher axonal density, and lower trail-making test scores indicate better performance, so a negative correlation was expected. Among DTI measures, FCSF shows behavior similar to that of FISO except for the vegetable-naming test of category fluency (p < 0.05). TD also shows behavior similar to FISO except for the trail-making test and digital number span test (p < 0.04). MD correlated with overall cognitive decline (p < 0.05). FA correlated with story recall (p < 0.04). LD and ODI showed no significant correlations.DISCUSSION
FISO and FCSF show differences between the cognitively normal (CN) and cognitively impaired (MCI and AD) as well as correlation with cognitive scores. These measures likely represent the degree of atrophy in the fornix, not tissue microstructure. Diffusion-based measurements therefore ought to account for PVA16. After correcting for PVA, TD showed differences between cognitively normal and cognitively impaired groups. TD also correlates with cognitive scores, largely in the verbal memory and fluency domains. As TD is a correlate of myelination17, this result may indicate added value of diffusion measurements. Measures of atrophy alone can be accomplished with anatomical images. Microstructure measurements from NODDI showed no meaningful correlations with cognitive scores, which may be a reflection of the limited scope of tissue examined and the fact that the acquisition deviates from that proposed by Zhang et al.6 Other brain regions may show different results.CONCLUSION
There is an urgent need for biomarkers of cognitive performance in AD. The relationship of fornix microstructure measurements to cognitive function in this small sample suggests that investigation of fornix measures as predictors of cognitive decline is warranted.Acknowledgements
We are grateful for funding from NIH grants P30AG072959 and P30AG062428.
References
1. Kivisakk, P., Magdamo, C., Trombetta, B. A., Noori, A., Kuo, Y. K. E., Chibnik, L. B., Carlyle, B. C., Serrano-Pozo, A., Scherzer, C. R., Hyman, B. T., Das, S. & Arnold, S. E. Plasma biomarkers for prognosis of cognitive decline in patients with mild cognitive impairment. Brain Commun 2022; 4:fcac155.
2. Xiao, Z., Wu, X., Wu, W., Yi, J., Liang, X., Ding, S., Zheng, L., Luo, J., Gu, H., Zhao, Q., Xu, H. & Ding, D. Plasma biomarker profiles and the correlation with cognitive function across the clinical spectrum of Alzheimer's disease. Alzheimers Res Ther 2021; 13:123.
3. Tosun, D., Demir, Z., Veitch, D. P., Weintraub, D., Aisen, P., Jack, C. R., Jr., Jagust, W. J., Petersen, R. C., Saykin, A. J., Shaw, L. M., Trojanowski, J. Q., Weiner, M. W. & Alzheimer's Disease Neuroimaging, I. Contribution of Alzheimer's biomarkers and risk factors to cognitive impairment and decline across the Alzheimer's disease continuum. Alzheimers Dement 2022; 18:1370-1382.
4. Cullen, N. C., Leuzy, A., Palmqvist, S., Janelidze, S., Stomrud, E., Pesini, P., Sarasa, L., Allué, J. A., Proctor, N. K., Zetterberg, H., Dage, J. L., Blennow, K., Mattsson-Carlgren, N. & Hansson, O. Individualized prognosis of cognitive decline and dementia in mild cognitive impairment based on plasma biomarker combinations. Nature Aging 2021; 1:114-123.
5. Nowrangi, M. A. & Rosenberg, P. B. The fornix in mild cognitive impairment and Alzheimer's disease. Front Aging Neurosci 2015; 7:1.
6. Zhang, H., Schneider, T., Wheeler-Kingshott, C. A. & Alexander, D. C. NODDI: practical in vivo neurite orientation dispersion and density imaging of the human brain. Neuroimage 2012; 61:1000-1016.
7. Hoy, A. R., Koay, C. G., Kecskemeti, S. R. & Alexander, A. L. Optimization of a free water elimination two-compartment model for diffusion tensor imaging. Neuroimage 2014; 103:323-333.
8. Bergmann, O., Henriques, R., Westin, C. F. & Pasternak, O. Fast and accurate initialization of the free-water imaging model parameters from multi-shell diffusion MRI. NMR Biomed 2020; 33:e4219.
9. Jenkinson, M., Beckmann, C. F., Behrens, T. E., Woolrich, M. W. & Smith, S. M. Fsl. Neuroimage 2012; 62:782-790.
10. NODDI toolbox, <http://mig.cs.ucl.ac.uk/index.php?n=Tutorial.NODDImatlab> (
11. Henriques, R. N., Rokem, A., Garyfallidis, E., St-Jean, S., Peterson, E. T. & Correia, M. M. [Re] Optimization of a free water elimination two-compartment model for diffusion tensor imaging. ReScience 2017; 3:2.
12. Assaf, Y., Freidlin, R. Z., Rohde, G. K. & Basser, P. J. New modeling and experimental framework to characterize hindered and restricted water diffusion in brain white matter. Magn Reson Med 2004; 52:965-978.
13. Greve, D. N., Billot, B., Cordero, D., Hoopes, A., Hoffmann, M., Dalca, A. V., Fischl, B., Iglesias, J. E. & Augustinack, J. C. A deep learning toolbox for automatic segmentation of subcortical limbic structures from MRI images. Neuroimage 2021; 244:118610.
14. Cox, R. W. AFNI: software for analysis and visualization of functional magnetic resonance neuroimages. Comput Biomed Res 1996; 29:162-173.
15. Benjamini, Y. & Hochberg, Y. Controlling the False Discovery Rate - a Practical and Powerful Approach to Multiple Testing. J R Stat Soc B 1995; 57:289-300.
16. Metzler-Baddeley, C., O'Sullivan, M. J., Bells, S., Pasternak, O. & Jones, D. K. How and how not to correct for CSF-contamination in diffusion MRI. Neuroimage 2012; 59:1394-1403.
17. Budde, M. D., Kim, J. H., Liang, H. F., Schmidt, R. E., Russell, J. H., Cross, A. H. & Song, S. K. Toward accurate diagnosis of white matter pathology using diffusion tensor imaging. Magn Reson Med 2007; 57:688-695.
Figures