2651
Decreased pH in the mouse brain of Alzheimer’s disease revealed by guanidinium and amide CEST at 3T1Department of Biomedical Engineering, Johns Hopkins University, Baltimore, MD, United States, 2F.M. Kirby Research Center for Functional Brain Imaging, Kennedy Krieger Research Institute, Baltimore, MD, United States, 3Department of Biomedical Engineering, City University of Hong Kong, Hong Kong, China, 4Russell H. Morgan Department of Radiology and Radiological Science, Johns Hopkins University School of Medicine, Baltimore, MD, United States
Synopsis
Keywords: Alzheimer's Disease, CEST & MT, pH mapping
Guanidinium CEST (GuanCEST) and amideCEST are highly sensitive to pH change, while their correlations with pH are opposite. Thus taking (unitless) difference of GuanCEST and amideCEST provides a reliable indicator for pH. Polynomial and Lorentzian line-shape fitting (PLOF) method helps extract the two CEST signals precisely, and the (unitless) difference shows a significant increase (p=0.008, n=10) in Alzheimer’s disease (AD) mouse brain compared with that of wild type mouse at 3T. Our results light up a novel and promising method to detect the onset of AD noninvasively, bringing the recent breakthrough in AD mechanism to further clinical application.
Purpose
Alzheimer’s disease (AD) is one of the greatest health concerns accompanying the worldwide aging society, while the early detection is a tough challenge partly due to the unkown mechanism of AD. Acidification or decreased pH is universally acknowledged in AD (1, 2), and a recent study (3) has pointed out that the faulty autolysosome acidification leads to amyloid beta deposition, which is a distinguished hallmark for AD. Therefore, it is very promising to detect the early sign of AD by measuring the pH decrease of the brain. GuanCEST goes up and amideCEST goes down at the decline of pH at low B1 in vivo, and the (unitless) difference of them should be a sensitive detector for small pH change if two signals are acquired precisely. Furthermore, the difference signal can exclude the possible contaminations from protein aggregation and B1 variation. Polynomial and Lorentzian line-shape fitting (PLOF) (4-7) fulfills such strict requirement, and it has been shown the (unitless) difference in AD mice compared with WT mice is significantly higher.Methods
Ten 11-month AD model mice (5xFAD) and ten age-matched wild type (WT) mice were scanned on a horizontal bore 3T Bruker BioSpec system (Bruker, Ettlingen, Germany) with an 82 mm quadrature volume resonator. Continuous-wave (CW) saturation with B1 of 0.6 µT and saturation time of 3 s is followed by the rapid acquisition with refocused echoes (RARE) readout with RARE factor of 32 and TR of 5 s. The FOV is 18 × 18 mm2 and the matrix size is 96 × 96 with a thickness of 2 mm.With the PLOF method (8), firstly the background is fitted by a polynomial function Rback in the corresponding rotating-frame relaxation spectrum (R-spectrum) in two ranges together (0.5~1.1 ppm & 5.0~8.2 ppm). Then with the background fixed, the GuanCEST and amideCEST are fitted simultaneously by the sum of R (Rsum), which includes Rback and Lorentzian functions for Guan (RGuan) and amide (Ramide) on the remaining data dots (1.1~5.0 ppm) (Fig. 1a).
Difference of GuanCEST and amideCEST is defined as (GuanCEST – amideCEST), while the unitless difference is (GuanCEST – amideCEST)/(GuanCEST + amideCEST). One-sided two-sample t-test is performed.
Results and Discussion
Z-spectrum extracted from central brain slice are used for the PLOF fitting (Fig. 1b), and it is notable that averagely AD mice have higher GuanCEST (purple arrow in Fig.1a&b) and lower amideCEST (green arrow in Fig.1a&b) compared with WT mice. Decomposition into RGuan and Ramide shows clearer evidence that AD mice have higher RGuan and lower Ramide compared with WT mice (Fig. 1c). Typical MR images of both AD and WT mouse brain are demonstrated in Fig. 2a~b, together with the derived GuanCEST map (Fig. 2c~d), amideCEST map (Fig. 2e~f), RGuan map (Fig. 2c~d), and Ramide map (Fig. 2e~f) in the form of heat map. It shows an averagely warmer GuanCEST map and colder amideCEST map for AD mice.Since a low B1 of 0.6 µT has been used, the exchange rate of GuanCEST is above its Rabi frequency, therefore the intensity of GuanCEST is negatively correlated to the exchange rate, i.e., pH (9-12). Similarly, as the exchange rate of amideCEST is below its Rabi frequency, it is proportional to pH, as verified in literature (8). Notably, the aggregation of protein may also lead to decrease of amideCEST, but it would decrease the GuanCEST as well (13), which is contradictory to our experimental findings here. Therefore, the elevated GuanCEST is solid evidence confirming the pH decline in AD, which cannot be verified by amideCEST alone. The opposite response in GuanCEST and amideCEST to the change of pH is utilized collectively to detect the pH discrepancy and statistical results show a significant higher difference (Fig. 3a: p=0.011) in AD mice compared with WT mice. Unitless difference shows a smaller p=0.008 (Fig. 3b), which may be more appropriate as it considers individual baseline difference by a denominator of the sum of relevant GuanCEST and amideCEST. Both metrics show a significant pH decrease in AD mouse brain, coinciding with previous studies. More importantly, as revealed by a recent study on the AD mechanism that the failure of acidification in autolysosome may result in build-up of amyloid beta and plaques, and the consequential rupture of misfunctioned autolysosome will release contents at an acidic pH of 4.5~5 (3). Neuroinflammation also produces some immunogenic molecules triggering the immune system, which may decrease the pH but not impact the function of brain at an early stage of dementia (14). As the change in pH happens much before the clinical symptom of AD, the suggested CEST-based pH indicator, i.e., the unitless difference between GuanCEST and amideCEST, is promising to become a sign and standard of early AD.
Conclusion
PLOF is applied to extract GuanCEST and amideCEST simultaneously, and the (unitless) difference of them is significantly higher in AD mice compared with WT mice at 3T, indicating a pH decline in AD mouse brain. The results support recent explanations of the onset of AD as a failure of autolysosome, which leads to a decreased pH. Therefore, we bring up a novel idea to measure cerebral pH noninvasively, which is also a promising early indicator of AD.Acknowledgements
Kexin Wang and Dr. Jianpan Huang contribute equally to the abstract. Kexin Wang analyzed data and wrote the paper. Dr. Jianpan Huang provided all the mouse data. Authors also thank Prof. Kannie W. Y. Chan for constructive discussion.
References
1. Decker Y, Németh E, Schomburg R, et al. Decreased pH in the aging brain and Alzheimer's disease. Neurobiology of Aging. 2021; 101:40-9.
2. Prasad H, Rao R. Amyloid clearance defect in ApoE4 astrocytes is reversed by epigenetic correction of endosomal pH. Proc Natl Acad Sci U S A. 2018; 115(28):E6640-e9. doi:10.1073/pnas.1801612115
3. Lee J-H, Yang D-S, Goulbourne CN, et al. Faulty autolysosome acidification in Alzheimer’s disease mouse models induces autophagic build-up of Aβ in neurons, yielding senile plaques. Nature Neuroscience. 2022:1-14.
4. Chen L, Wei Z, Cai S, et al. High-resolution creatine mapping of mouse brain at 11.7 T using non-steady-state chemical exchange saturation transfer. NMR Biomed. 2019; 32(11):e4168. doi:10.1002/nbm.4168
5. Chen L, Barker PB, Weiss RG, et al. Creatine and phosphocreatine mapping of mouse skeletal muscle by a polynomial and Lorentzian line-shape fitting CEST method. Magn Reson Med. 2019; 81(1):69-78. doi:10.1002/mrm.27514
6. Chen L, Zeng H, Xu X, et al. Investigation of the contribution of total creatine to the CEST Z-spectrum of brain using a knockout mouse model. NMR Biomed. 2017; 30(12):e3834. doi:10.1002/nbm.3834
7. Chen L, Schar M, Chan KWY, et al. In vivo imaging of phosphocreatine with artificial neural networks. Nat Commun. 2020; 11(1):1072. doi:10.1038/s41467-020-14874-0
8. Wang K, Park S, Kamson DO, et al. Guanidinium and amide CEST mapping of human brain by high spectral resolution CEST at 3 T. Magnetic Resonance in Medicine. 2022.
9. Wang K, Sui R, Chen L, et al. The exchange rates of amide and arginine guanidinium CEST in the mouse brain. bioRxiv. 2022.
10. Chen L, van Zijl PCM, Wei Z, et al. Early detection of Alzheimer's disease using creatine chemical exchange saturation transfer magnetic resonance imaging. Neuroimage. 2021; 236:118071. doi:10.1016/j.neuroimage.2021.118071
11. Zong X, Wang P, Kim SG, et al. Sensitivity and source of amine‐proton exchange and amide‐proton transfer magnetic resonance imaging in cerebral ischemia. Magnetic resonance in medicine. 2014; 71(1):118-32.
12. Jin T, Kim SG. Approximated analytical characterization of the steady‐state chemical exchange saturation transfer (CEST) signals. Magnetic resonance in medicine. 2019; 82(5):1876-89.
13. Chen L, Wei Z, Chan KWY, et al. Protein aggregation linked to Alzheimer's disease revealed by saturation transfer MRI. Neuroimage. 2018; 188:380-90. doi:10.1016/j.neuroimage.2018.12.018
14. Sarhan M, Land WG, Tonnus W, et al. Origin and consequences of necroinflammation. Physiological reviews. 2018; 98(2):727-80.
Figures
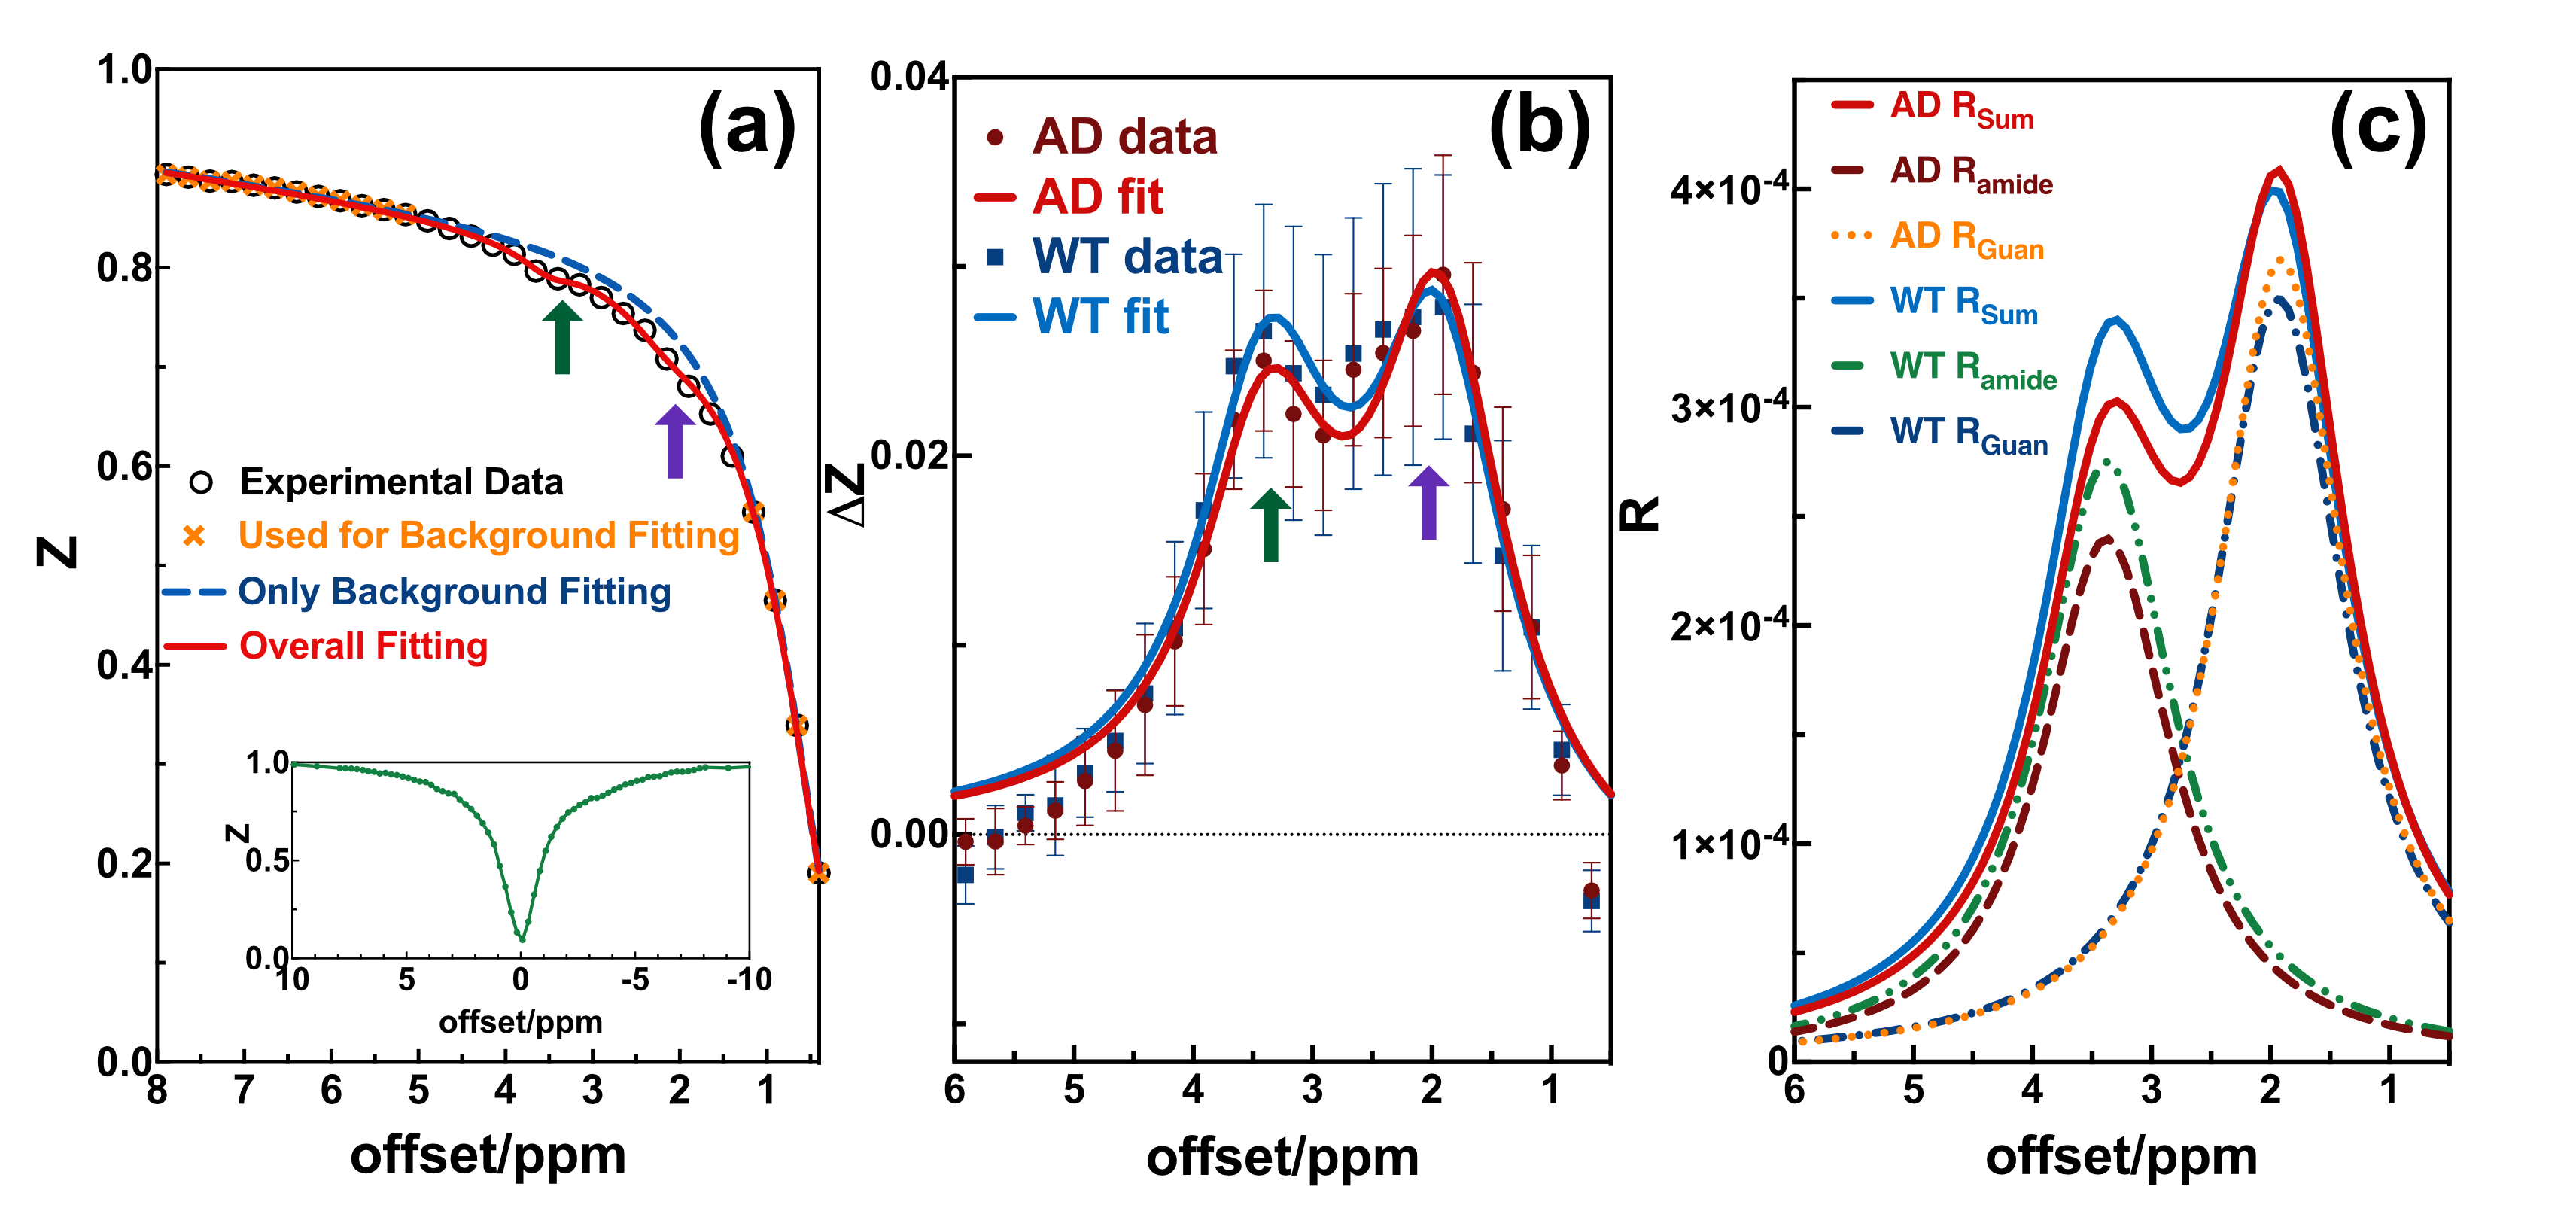
Figure 1. (a) Demonstration for PLOF. Open circles are experimental data, of which yellow crosses are used for background fitting. With background fixed, two peaks are fitted using the remaining open circles (1.1~5.0 ppm). The GuanCEST/amideCEST are labeled by a purple/green arrow (same in b). Inset: a typical full Z-spectrum. (b) Experimental data (n=10) and fitting of GuanCEST and amideCEST by PLOF. AD mice show larger GuanCEST and smaller amideCEST than that of WT mice. (c) Demonstration of fitted R curves for AD and WT mice. Ramide/RGuan is obtained by fitting only amide/Guan peak.
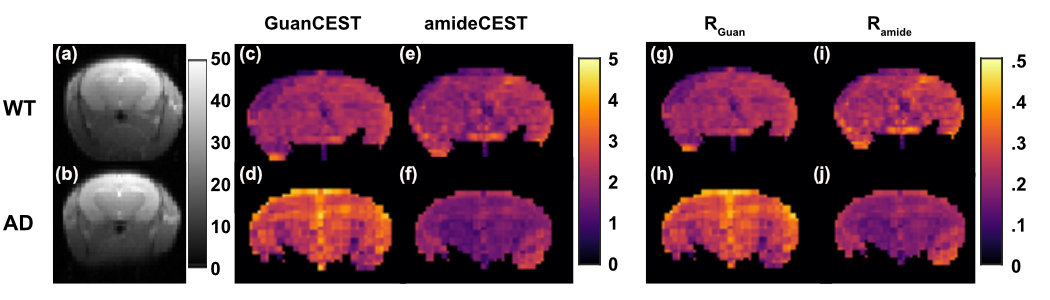
Figure 2. Typical plot of Z (CEST) map and R map for WT (first row) and AD mice (second row). MR image of WT (a) and AD (b) mouse brain. GuanCEST distribution for WT (c) and AD (d), and amideCEST distribution for WT (e) and AD (f) share the same color bar. RGuan map for WT (g) and AD (h), and Ramide distribution for WT (i) and AD (j) share the same color bar.
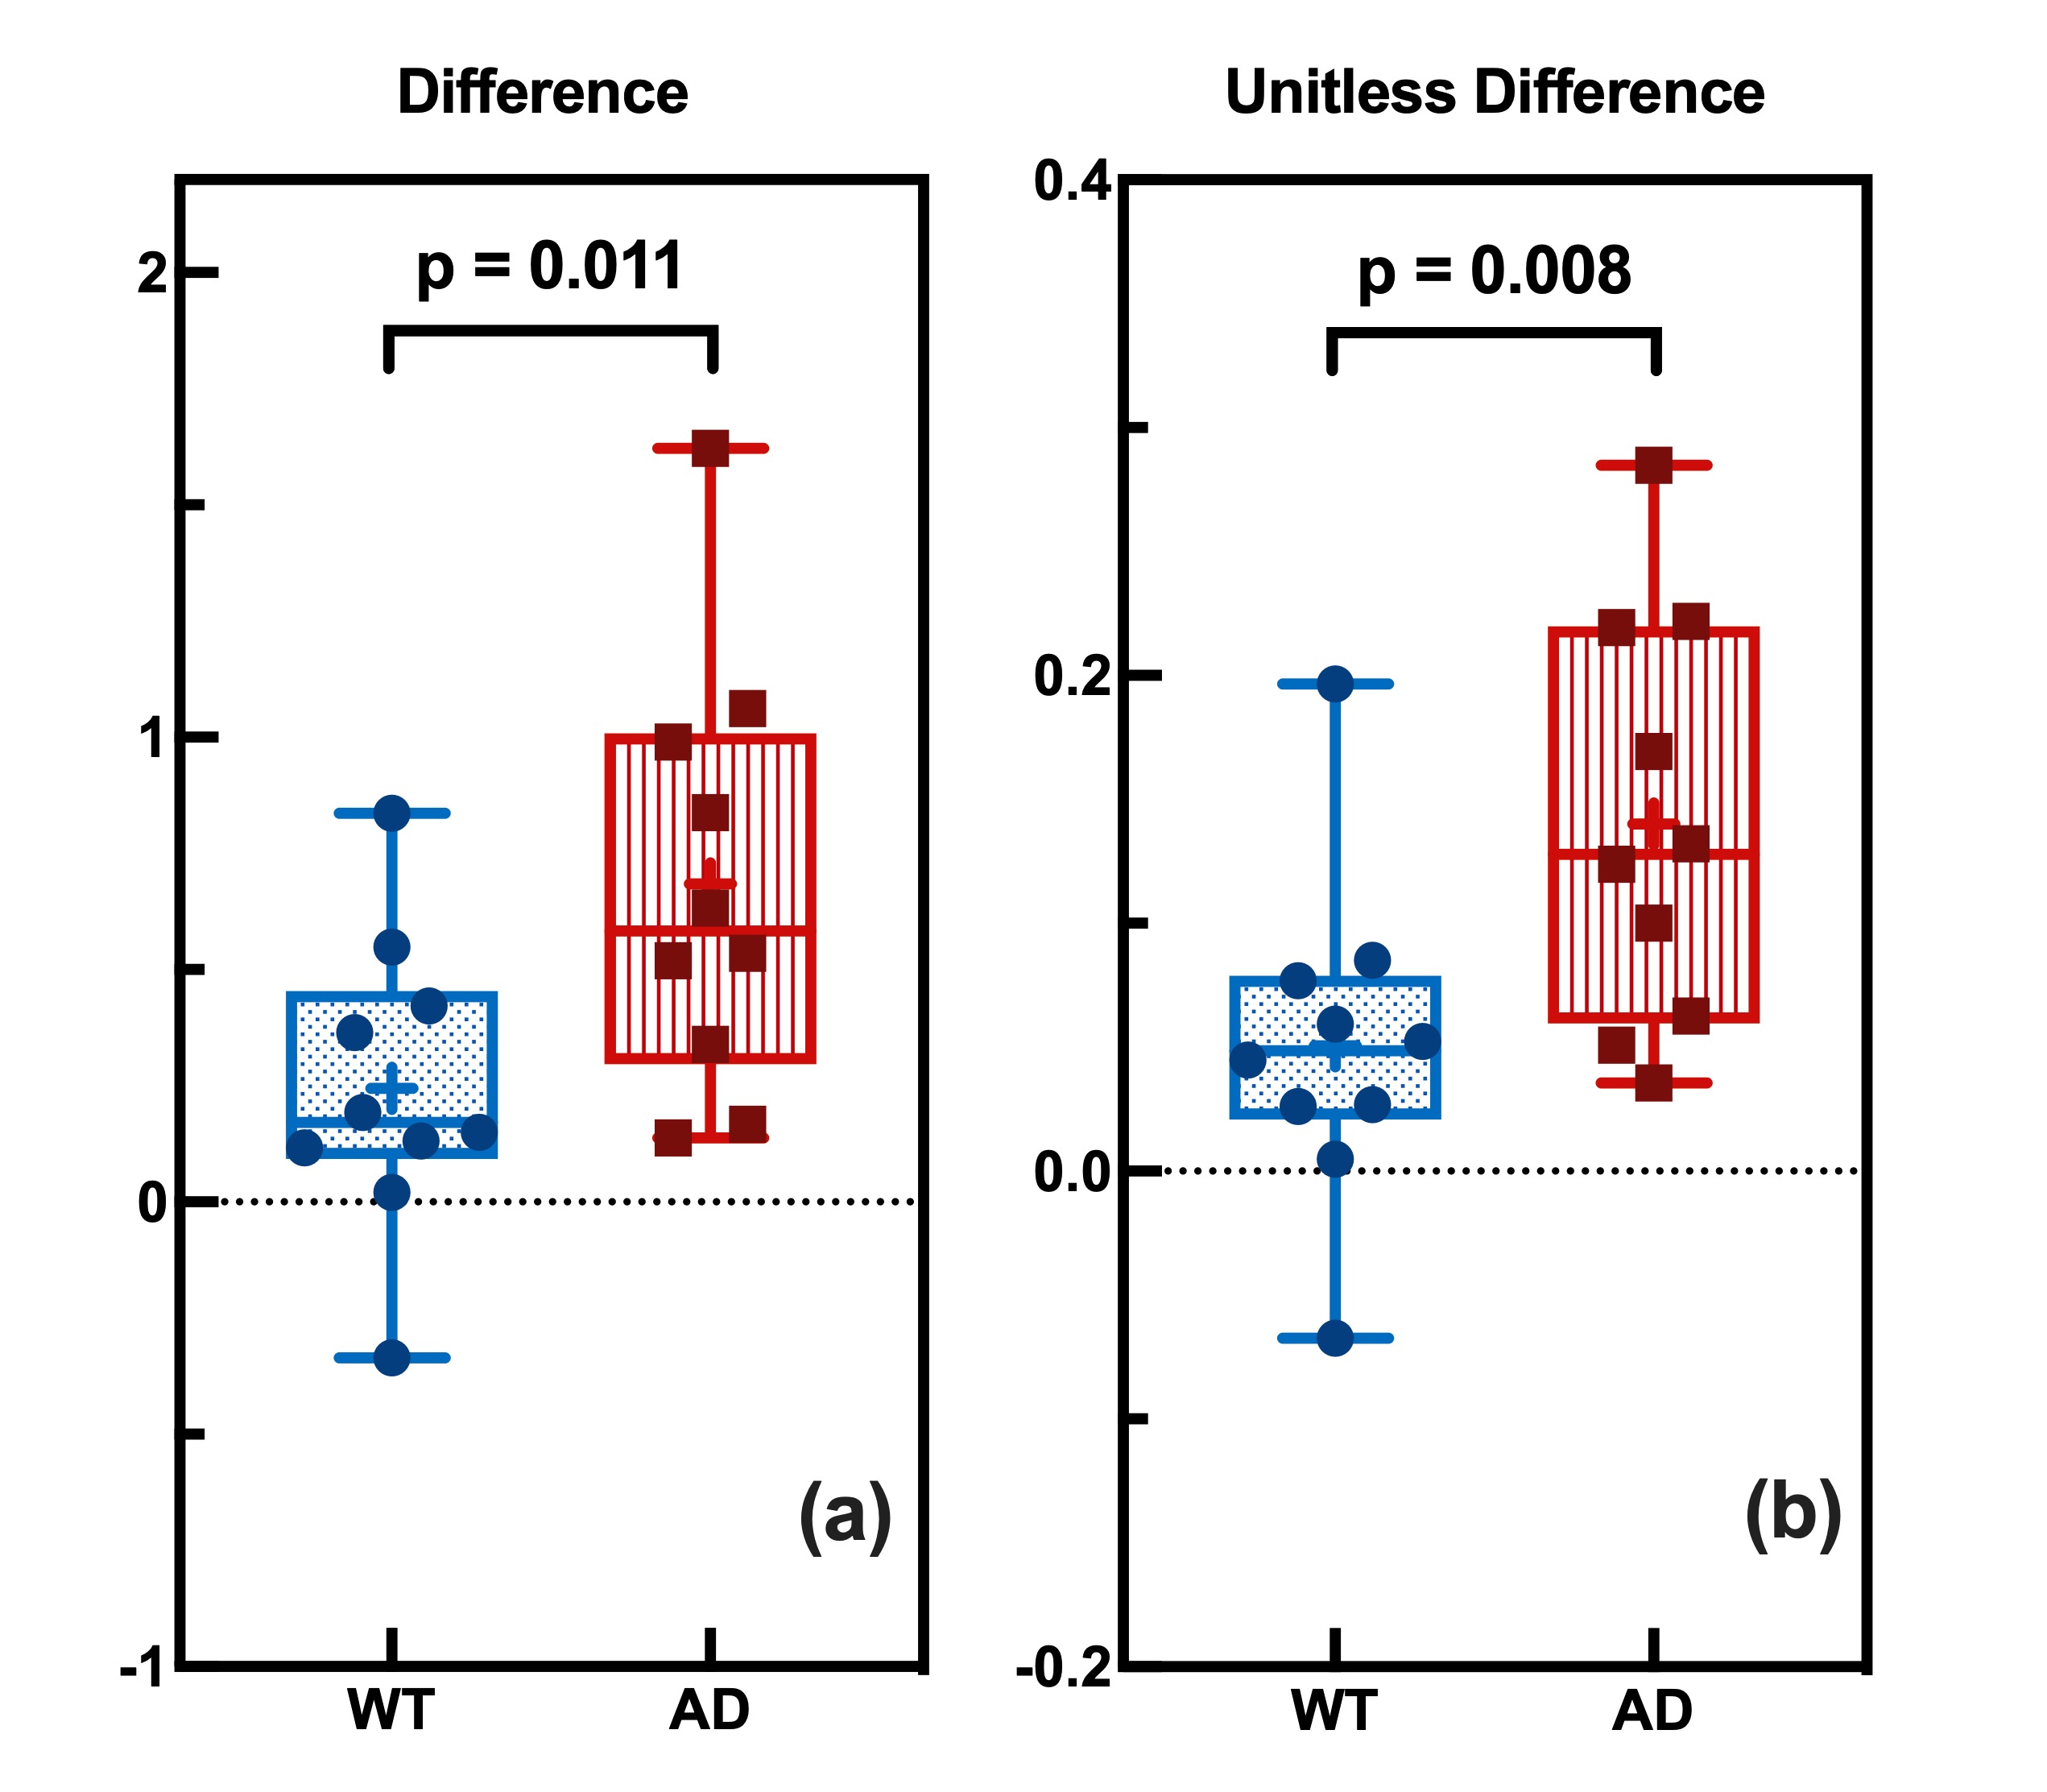
Figure 3. Statistical analysis of WT (blue) and AD (red) CEST signal. (a) Comparison of difference (GuanCEST-amideCEST) for WT and AD mice with p=0.01<0.05. (b) Comparison of unitless difference ( ) for WT and AD mice with p=0.008<0.05.