2649
CADASIL mice are characterized by simultaneous metabolic and vascular stress1Russell H. Morgan Department of Radiology and Radiological Science, Johns Hopkins University School of Medicine, Baltimore, MD, United States, 2F. M. Kirby Research Center for Functional Brain Imaging, Kennedy Krieger Research Institute, Baltimore, MD, United States, 3Department of Electronic Science, Xiamen University, Xiamen, China, 4Department of Psychiatry and Behavioral Sciences, Johns Hopkins University School of Medicine, Baltimore, MD, United States, 5Departments of Neurosurgery and Neuroscience, Yale School of Medicine, New Haven, CT, United States, 6The Solomon H. Snyder Department of Neuroscience, Johns Hopkins University School of Medicine, Baltimore, MD, United States, 7Department of Biomedical Engineering, Johns Hopkins University School of Medicine, Baltimore, MD, United States
Synopsis
Keywords: Dementia, Animals
Vascular cognitive impairment and dementia (VCID) is the second leading cause of dementia and is often mixed with other pathologies. Related mouse models with relatively pure vascular pathologies are used for mechanistic studies or therapeutic trials. CADASIL (Cerebral autosomal dominant arteriopathy with subcortical infarcts and leukoencephalopathy) is a monogenic condition causing lacunar strokes and vascular dementia. Using the established mouse model of CADASIL, we aimed to investigate potential microvascular dysfunctions with advanced non-contrast MRI techniques. We found that CADASIL mice displayed elevated oxygen consumption and impaired cerebrovascular reactivity, suggesting simultaneous metabolic and vascular stress.INTRODUCTION
Vascular cognitive impairment and dementia (VCID) is the second leading cause of dementia and is often mixed with other pathologies (e.g., Alzheimer’s disease).1,2 Mouse models of VCID provide important opportunities for mechanistic understanding of vascular dysfunction without the complications from other pathologies. Cerebral autosomal dominant arteriopathy with subcortical infarcts and leukoencephalopathy (CADASIL) is a monogenic condition causing lacunar strokes and vascular dementia in humans.3,4 Mouse models of CADASIL harboring mutations in NOTCH3, a protein important for vascular smooth muscle cell function, have been developed and extensively characterized with histological techniques;3,4 however, any physiological alterations, particularly microvascular functions, remain to be elucidated. In this study, we aimed to fill this knowledge gap with advanced MRI.METHODS
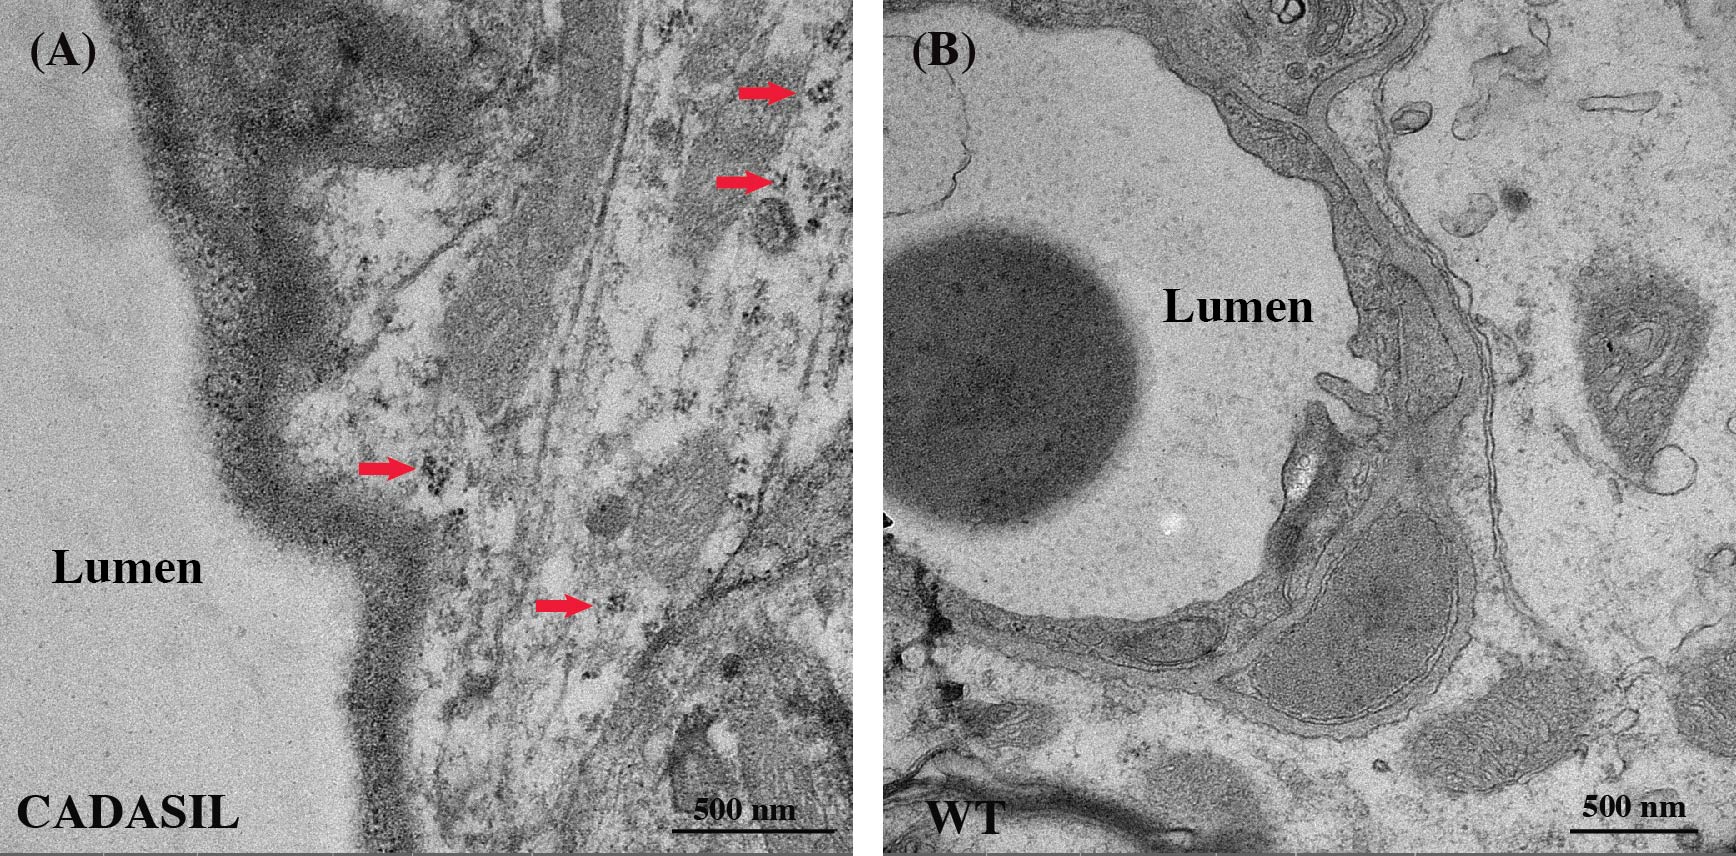
All experiments were approved by the local IACUC. An 11.7T Bruker Biospec system (maximum gradient of 0.74 T/m) with a 72-mm quadrature volume resonator (transmitter) and 2×2 phased-array coil (receiver) was utilized. Isoflurane (1.2%) was used as the anesthesia and delivered by medical air. A cohort of 12 mice (6 wildtype [WT] and 6 CADASIL mice) at the age of 9 months old were studied. CADASIL mice were crossbred from heterozygous Notch3-C455R and hemizygous SM22αCre mice following reported procedures.4Transmission electron microscope (TEM) was used to confirm the appearance of granular osmiophilic material (GOM) deposits, which are hallmarks of CADASIL3.
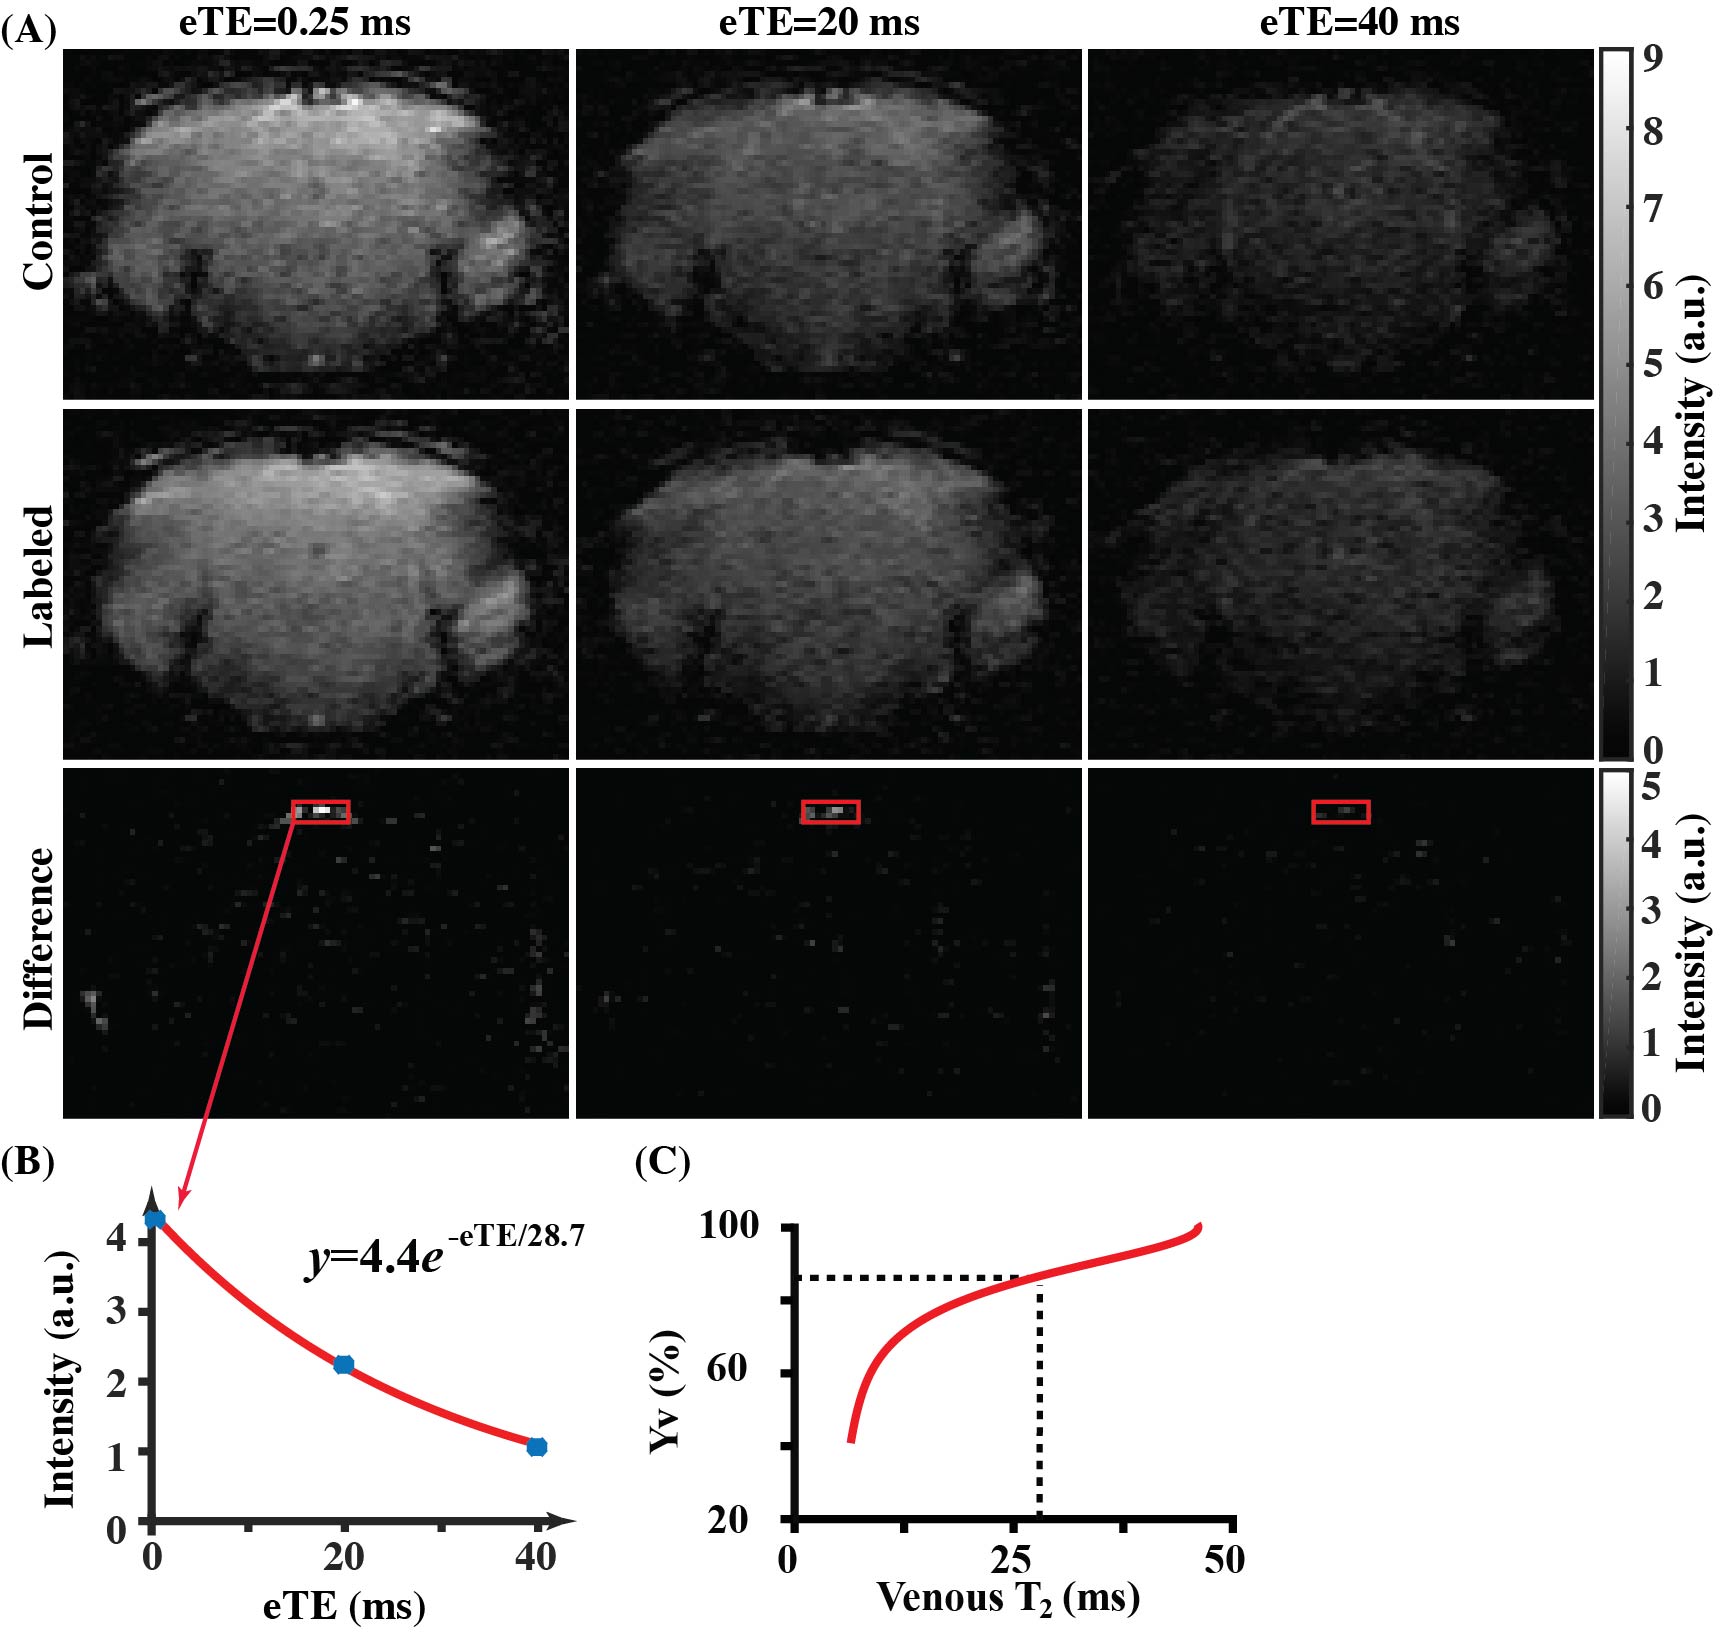
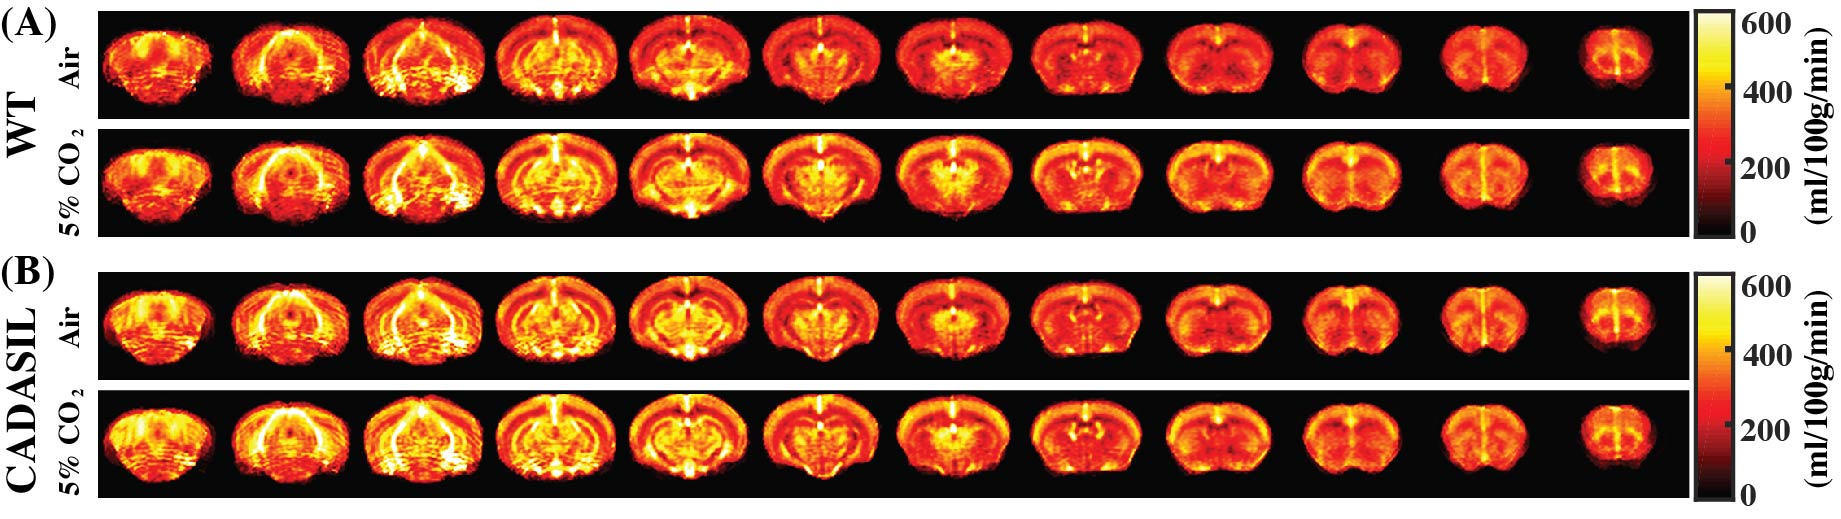
MRI scans were performed to assess different parameters as following: (a) oxygen extraction fraction (OEF), which denotes the arteriovenous oxygenation difference (i.e., OEF=Ya-Yv), was evaluated by T2-relaxation-under-spin-tagging (TRUST)5,6. Note that arterial oxygenation (Ya) is generally close to 1 and was assumed to 0.99.7 (b) Cerebral blood flow (CBF) was measured by pseudo-continuous arterial spin labeling (pCASL)8, and normalized to a mouse brain template9 before quantitative analyses. (c) Cerebrovascular reactivity (CVR), defined as $$$\frac{100(CBF_{hypercapnia}-CBF_{normocapnia})}{CBF_{normocapnia}}$$$ in the unit of percent (%) blood flow change, was evaluated with pCASL scans at normocapnia (medical air) and hypercapnia (gas containing 5% CO2). Cerebral metabolic rate of oxygen (CMRO2) was calculated following Fick principle, i.e., CMRO2=Ca·CBF·OEF, where Ca is a constant denoting the carrying capacity of hemoglobin. A T2-weighted anatomical scan was performed to evaluate brain volume.
Student’s t-test were used for statistical analyses (significance level at P<0.05).
RESULTS AND DISCUSSION
Figure 1 presents the TEM images of representative CADASIL and WT mice. GOM clusters can be seen at the space close to vessel lumen in CADASIL mouse (Fig. 1A), but not in WT mouse (Fig. 1B). Within the clusters, a single GOM deposit appears as a dark dot with a diameter of approximately 10-30 nm (Fig. 1A).Figure 2 shows a representative TRUST dataset. Fig. 2A shows the control and labeled images at different effective TE (eTE=0.25,20,40 ms). Pair-wise subtractions yielded the corresponding difference images. Signal intensities at the confluences of sagittal sinuses were fitted into a monoexponential model to estimate venous blood T2 (Fig. 2B), which was then converted into Yv with a calibration plot10 (Fig. 2C).
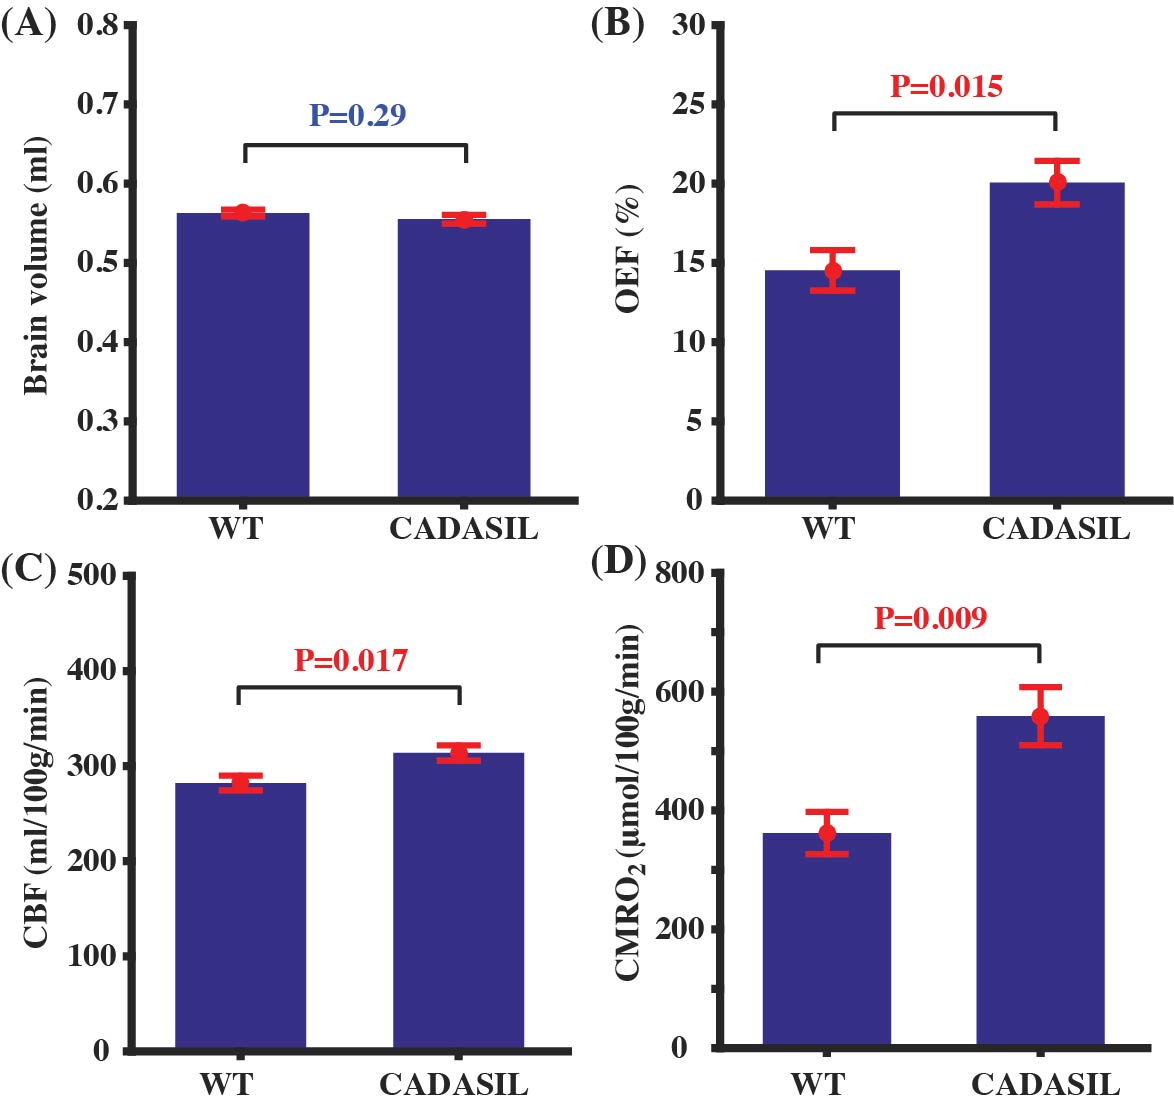
Figure 3 summarizes the results of physiological MRI in the CADASIL mice in comparison with WT mice. CADASIL mice did not show brain atrophy at this age (9 months) (Fig. 3A, P=0.29). On the other hand, they exhibited significantly elevated OEF (Fig. 3B, P=0.015, by 38.1%), CBF (Fig. 3C, P=0.017, by 11.2%), and CMRO2 (Fig. 3D, P=0.009, by 54.3%), suggesting that the CADASIL model was associated with a pronounced hypermetabolism.
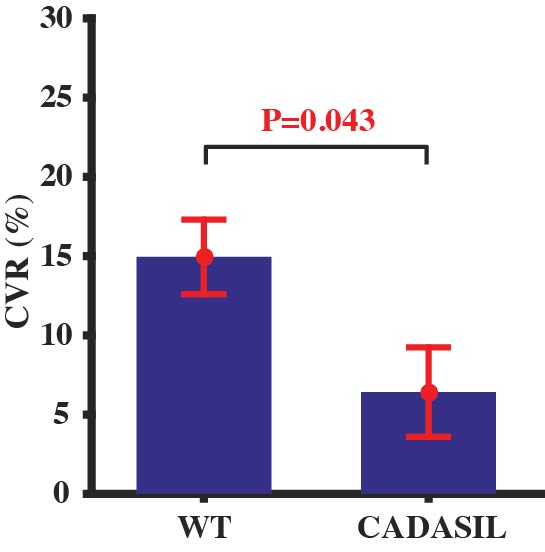
Averaged CBF maps of WT and CADASIL mice under normocapnia and hypercapnia were presented in Fig. 4. CBF increases from normocapnia to hypercapnia can be observed at different brain regions in both mouse groups. However, CVR in the CADASIL mice was dramatically lower than that in the WT mice (Fig. 3E, P=0.043, by -57.1%). Impaired CVR in the CADASIL mice is likely attributed to the developmental deficiency in smooth muscle cells11 as a result of NOTCH3 mutation.
Additional conventional MRI techniques were employed to investigate apparent diffusion coefficient (ADC), quantitative T1 and T2 values. There were no differences between WT and CADASIL mice in ADC (P≥0.42 for different regions), T1 (P≥0.21), and T2 (P≥0.13), possibly suggesting absences of microstructural changes at this age. Meanwhile, behavior tests were conducted to evaluate the cognitive function of CADASIL and WT mice. There was not a significant difference in spontaneous alternation performance (SAP) of Y-maze (P=0.16) or staying time in new arm of blocked Y-maze (P=0.77), suggesting relatively intact cognitive function in CADASIL mice at this stage.
We integrate the pathophysiological findings in this study as follows. At 9 months of age, CADASIL mice have not manifested brain volumetric and microstructural abnormalities, but functional changes are already apparent; the brain is not as efficient in energy consumption, thus requiring higher metabolic rate to support neural functions. Higher metabolism is accompanied by higher blood supply. Vascular smooth muscle cells are dysfunctional due to GOM deposits, which diminished the vasodilatory capacity (as measured by CVR). The mismatch between metabolic demand and vascular supply is expected to be more prominent during intensive brain processing.
CONCLUSION
CADASIL mice at 9 months of age are characterized by simultaneous metabolic and vascular stress despite a lack of brain volumetric and microstructural abnormalities.Acknowledgements
No acknowledgement found.References
1. Schneider JA, Arvanitakis Z, Bang W et al. Mixed brain pathologies account for most dementia cases in communitydwelling older persons. Neurology 2007; 69: 2197-2204.
2. Wolters FJ, Ikram MA. Epidemiology of Vascular Dementia. Arterioscler Thromb Vasc Biol 2019; 39(8): 1542-1549.
3. Arboleda-Velasquez JF, Manent J, Lee JH et al. Hypomorphic Notch 3 alleles link Notch signaling to ischemic cerebral small-vessel disease. Proc Natl Acad Sci U S A 2011; 108(21): E128-135.
4. Arboleda-Velasquez JF, Zhou Z, Shin HK et al. Linking Notch signaling to ischemic stroke. Proc Natl Acad Sci U S A 2008; 105(12): 4856-4861.
5. Lu H, Ge Y. Quantitative evaluation of oxygenation in venous vessels using T2-Relaxation-Under-Spin-Tagging MRI. Magn Reson Med 2008; 60(2): 357-363.
6. Wei Z, Xu J, Liu P et al. Quantitative assessment of cerebral venous blood T2 in mouse at 11.7T: Implementation, optimization, and age effect. Magn Reson Med 2018; 80(2): 521-528.
7. Lin AL, Qin Q, Zhao X et al. Blood longitudinal (T1) and transverse (T2) relaxation time constants at 11.7 Tesla. Magn Reson Mater Phy 2012; 25(3): 245-249.
8. Hirschler L, Debacker CS, Voiron J et al. Interpulse phase corrections for unbalanced pseudo-continuous arterial spin labeling at high magnetic field. Magn Reson Med 2018; 79(3): 1314-1324.
9. Meyer CE, Kurth F, Lepore S et al. In vivo magnetic resonance images reveal neuroanatomical sex differences through the application of voxel-based morphometry in C57BL/6 mice. Neuroimage 2017; 163: 197-205.
10. Li W, van Zijl PCM. Quantitative theory for the transverse relaxation time of blood water. NMR Biomed 2020; 33: e4207.
11. Domenga V, Fardoux P, Lacombe P et al. Notch3 is required for arterial identity and maturation of vascular smooth muscle cells. Genes Dev 2004; 18(22): 2730-2735.
Figures