2648
4D Oxy-wavelet MRI and Graph Theory in APOE KO mice: A new perspective into the role of mitochondria and brain connectivity1Department of Bioengineering, University of Pittsburgh, Pittsburgh, PA, United States, 2Department of Developmental Biology, School of Medicine, University of Pittsburgh, Pittsburgh, PA, United States, 3Department of Bioengineering, Swanson School of Engineering, University of Pittsburgh, Pittsburgh, PA, United States, 4Rangos Research Center Small Animal Imaging Core, Children's Hospital of Pittsburgh of UPMC, Pittsburgh, PA, United States, 5Rangos Research Center Animal Imaging Core, Children's Hospital of Pittsburgh of UPMC, Pittsburgh, PA, United States, 6Department of Pediatrics, University of Pittsburgh, School of Medicine, Pittsburgh, PA, United States, 7Rangos Research Center Small Animal Imaging Core, University of Pittsburgh, Pittsburgh, PA, United States, 8Biomedical Imaging Research Institue, Cedars-Sinai Medical Center, Los Angeles, CA, United States, 9Department of Pediatrics, School of Medicine, University of Pittsburgh, Pittsburgh, PA, United States
Synopsis
Keywords: Alzheimer's Disease, Brain Connectivity, Metabolism, fMRI
Apolipoprotein E (APOE) alleles are strong genetic risk factors for the Late-Onset-Alzheimer’s Disease (LOAD). In this study we utilize our novel 4D Oxy-wavelet functional MRI to study the bioenergetic footprint of APOE knockout (KO) mice compared to wild type (WT) mice. We have created neuronal networks in mice defined by bioenergetic dispersion throughout the whole brain, and demonstrated key differences between APOE KO and WT. We further validate our oxywavelet index for probing mitochondrial function non-invasively and present new signal processing methods for relevant biomarker extraction.
Background
The apolipoprotein E (APOE) gene is responsible for lipid metabolism and the transport of cholesterol in the blood stream1. APOE alleles are strong genetic risks for the Late-Onset Alzheimer’s disease (LOAD). Mitochondrial dysfunctions and bioenergetic defects are associated with LOAD. We have established a 4D Oxy-wavelet MRI that can probe in vivo mitochondrial functions in intact brains, leveraging the fact that acute1-5 adaptation to hypoxia requires mitochondrial functions. We seek to advance this tool by creating new methods of probing neuronal bioenergetics and defining the bioenergetic neuronal network in APOE KO mice. We propose a 4D fMRI pipeline for creating bioenergetic neuronal networks in APOE KO and WT mice. We believe that dysfunction in underlying mitochondrial function defines this network architecture, validated by our Oxywavelet fMRI method.Methods
Animal ModelAPOE KO mice were purchased from Jackson Labs: B6. 129P2-Apoetm1Unc/J. Age and sex matched C57BL/6J were used as wildtype (WT) controls.
Oxy-Wavelet fMRI
Our method uses a hybrid low-rank 6 and sparse 7 model to measure a dynamic BOLD image $$$\rho(\mathbf{r},t)$$$ (for spatial position $$$\mathbf{r}$$$ and time $$$t$$$) from undersampled $$$(\mathbf{k},t)$$$ -space data. The low-rank model expresses the image as the outer product of a set of $$$L$$$ basis images $$$\{\psi_\ell(\mathbf{r})\}_{\ell=1}^L$$$ and $$$L$$$ temporal functions $$$\{\varphi_\ell(t)\}_{\ell=1}^L$$$:$$\rho(\mathbf{r},t)=\sum_{\ell=1}^L\psi_\ell(\mathbf{r})\varphi_\ell(t)$$ This model exploits correlation of images over time8 and when transform sparsity9 of $$$\{\psi_\ell(\mathbf{r})\}_{\ell=1}^L$$$ is additionally enforced during image reconstruction. This allows for fMRI with high spatiotemporal resolution; furthermore, it can assess oxygen attenuation during the same single scan. During acquisition, short bursts of 3-min hypoxia (10% O2) interleaved with 3-min hyperoxia (100% O2) were supplied via a nose cone.
Signal Preprocessing and Image Segmentation
Basis images reconstructed from our 4D fMRI were used as the starting point for atlas-based brain segmentation using the Allen Mouse atlas 10. Each segmented region’s time-resolved BOLD trace was centered around the mean and then RMS-normalized. The signal itself was segmented between resting state and hypoxia challenge driving our fMRI signal.
Network Creation and Graph Theory
Prior to correlation analysis, the event-signal driving our fMRI hypoxia challenge was related to the output signal (BOLD traces from a given region), using Gram-Schmidt orthonormalization. That is, a vector that is ortho-normal to both the input, event signal and the output BOLD trace is utilized for the region-by-region correlation analysis.
After normalization, the resulting Gram-Schmidt BOLD traces for each brain region were cross-correlated with all other brain regions. The correlation value was normalized between 0 and 1, and the value of the cross-correlation function at lag equal to zero was kept. The result was a 72x72 adjacency matrix for the whole brain of each animal. These adjacency matrices were thresholded at 5 different levels corresponding to 15%, 25%, 35%, 55% and 75% of the total connections. Both binary and weighted networks were created. Small-worldness, transitivity, and global efficiency were calculated for all networks.
Results
APOE KO mice showed clear mitochondria dysfunction as demonstrated by poor oxywavelet indices and slower changes in the BOLD response to hypoxia. Namely, in regions associated with hippocampal and amygdala pathways. APOE KO mice show differences in bioenergetic network structures and network metrics. Figure 2 demonstrates that with increased connectivity thresholds, APOE KO mice have increased transitivity compared to WT mice. This represents an increased probability of node interconnectivity, representing subgroups of differing mitochondrial function compared to WT mice.Conclusion
We developed a pipeline that produces whole-brain networks from 4D time-resolved fMRI with hypoxia challenge. The hypoxia challenge underpinning our brain networks represents the mitochondrial relations between differing brain regions and how bioenergetics are passed through the network. This is unlike most fMRI studies that focus on how information is spread through the network, or diffusion connectome studies that seek to study physical connectivity. This serves as a novel tool to understand how bioenergetics and mitochondria play a role in neuronal network remodeling, neurodevelopment, and neuronal disorders such as LOAD.Acknowledgements
No acknowledgement found.References
1. Marshall JM. The Joan Mott Prize Lecture. The integrated response to hypoxia: from circulation to cells. Exp Physiol. 1999;84:449-70.
2. Giussani DA. The fetal brain sparing response to hypoxia: physiological mechanisms. The Journal of physiology. 2016;594:1215-30.
3. Lee P, Chandel NS and Simon MC. Cellular adaptation to hypoxia through hypoxia inducible factors and beyond. Nat Rev Mol Cell Biol. 2020;21:268-283.
4. Holmes AP, Ray CJ, Coney AM and Kumar P. Is Carotid Body Physiological O(2) Sensitivity Determined by a Unique Mitochondrial Phenotype? Frontiers in physiology. 2018;9:562.
5. Michiels C. Physiological and pathological responses to hypoxia. Am J Pathol. 2004;164:1875-82.
6. Christodoulou AG, Zhang H, Zhao B, Hitchens TK, Ho C and Liang ZP. High-resolution cardiovascular MRI by integrating parallel imaging with low-rank and sparse modeling. IEEE Trans Biomed Eng. 2013;60:3083-92.
7. Zhao B, Haldar JP, Christodoulou AG and Liang ZP. Image reconstruction from highly undersampled (k, t)-space data with joint partial separability and sparsity constraints. IEEE Trans Med Imaging. 2012;31:1809-20.
8. Liang Z-P. Spatiotemporal imaging with partially separable functions. Proc IEEE Int Symp Biomed Imaging. 2007:988-991.
9. Lustig M, Donoho D and Pauly JM. Sparse MRI: The application of compressed sensing for rapid MR imaging. Magnetic resonance in medicine. 2007;58:1182-95.
10. Wang Q, Ding SL, Li Y, Royall J, Feng D, Lesnar P, Graddis N, Naeemi M, Facer B, Ho A, Dolbeare T, Blanchard B, Dee N, Wakeman W, Hirokawa KE, Szafer A, Sunkin SM, Oh SW, Bernard A, Phillips JW, Hawrylycz M, Koch C, Zeng H, Harris JA and Ng L. The Allen Mouse Brain Common Coordinate Framework: A 3D Reference Atlas. Cell. 2020;181:936-953.e20.
Figures
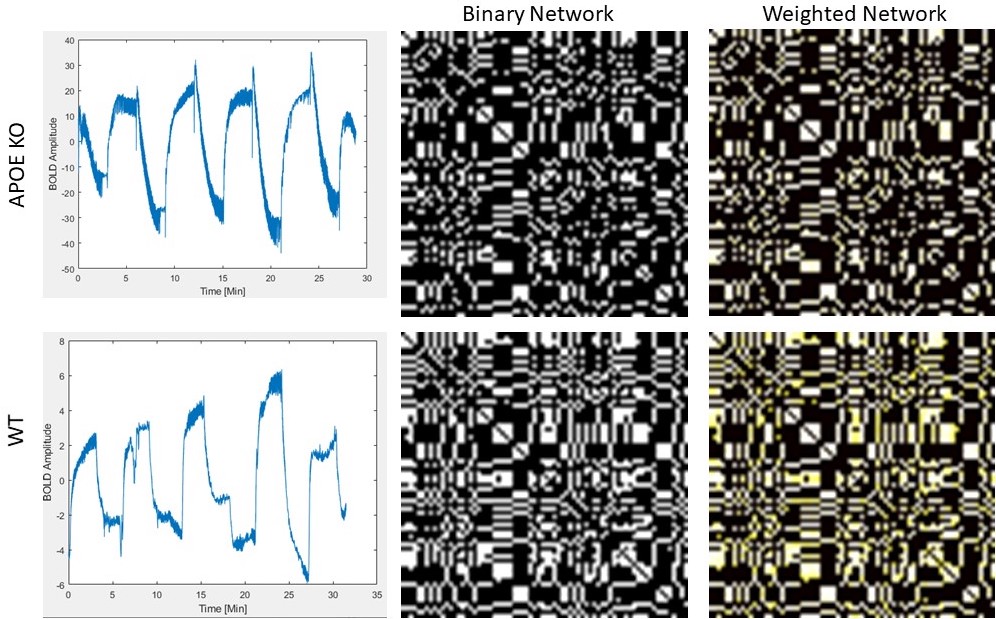
Figure 1) Example time-resolved BOLD traces (left), binary network adjacency matrices (middle), and weighted network adjacency matrices (right), for a single APOE KO animal (top row) and a single WT animal (bottom row). Note the opposite phase of the BOLD trace, signifying a passive response to hypoxia challenge. There is less connectivity and more groupings in the APOE KO network as compared to WT.
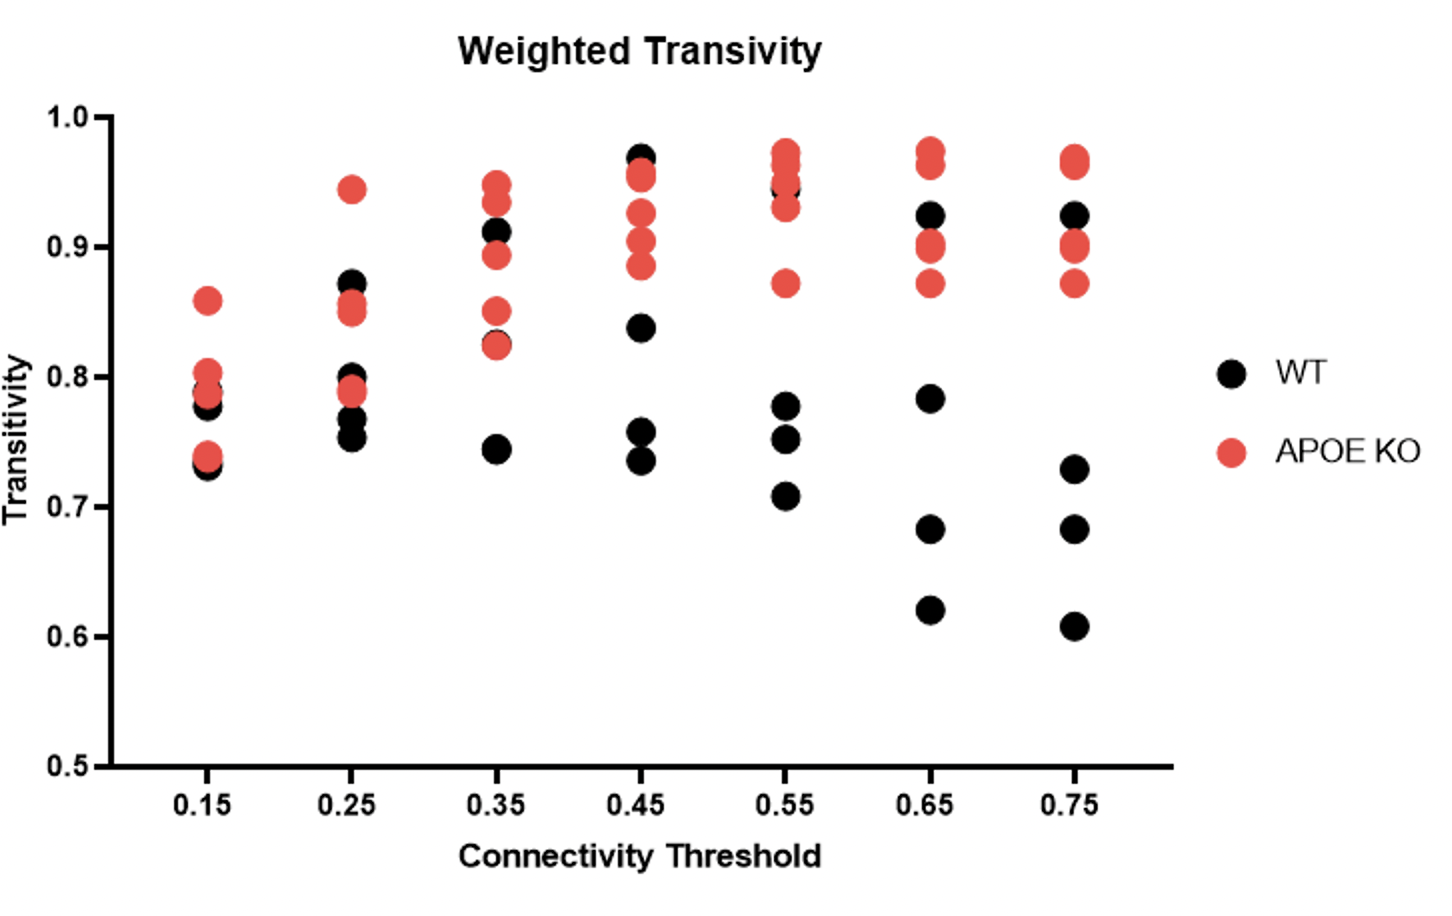
Figure 2) Bioenergetic network transitivity changes with increasing connectivity threshold. On average, APOE KO mouse increase with an increase in thresholding as compared to WT mice.