2645
Quantitative synthetic MRI reveals white matter alterations in patients with beta-thalassemia1Radiology Department of the First Affiliated Hospital of Guangxi Medical University, Nanning, China, 2Hematology Department of The First Affiliated Hospital of Guangxi Medical University, Nanning, China, 3MR Research, GE Healthcare, Beijing, China, Beijing, China
Synopsis
Keywords: White Matter, Blood, Beta-thalassemia
Beta-thalassemia (β-TM) is a genetically haematological disorder leading to reduced production of hemoglobin. Yet its alterations in white matter (WM) microstructure remain unclear. The present study aimed to analyze quantitative MRI parameters of WM in β-TM patients using synthetic MRI. The results showed that T1, T2 and T1/T2 ratio of widespread WM areas were affected by β-TM, which may be related to iron deposition and decrease of myelin concentration. Thus, we concluded that WM alterations in β-TM patients can be revealed by quantitative MRI parameters.Introduction
Beta-thalassemia (β-TM) is a common group of hereditary blood disorders in Southern China. Individuals with beta-thalassemia major usually present with severe anemia, requiring regular red blood cell transfusion1. Previous studies have shown that white matter (WM) volume was decreased in proportion to anemia severity2 and lower WM volume associated with cognitive performance3. However, the alterations of WM microstructure, which can be revealed by quantitative MRI parameters (T1, T2, etc.)4, have not been well investigated in β-TM patients. Therefore, in this study, we studied the quantitative T1 and T2 values of brain WM in patients with β-TM major through a whole brain analysis by synthetic magnetic resonance imaging (SyMRI).Methods
Eighteen patients with β-TM major (ages range from 4 to 18 years) and 8 healthy control (HC) subjects (ages range from 5 to 11 years) were recruited. The protocol of this study was approved by the ethics committee of First Affiliated Hospital of Guangxi Medical University and informed consent forms were signed for all participants.MRI data was obtained on a 3.0T scanner (SIGNA Premier GE Healthcare, WI, USA) using 48-channel head coils. For each participant, sagittal three-dimensional fast spoiled gradient echo-based sequence with 1.00 mm isotropic resolution was used to acquired T1-weighted (T1w) images. T1 and T2 mapping images were acquired using the SyMRI technique, which is based on the two-dimensional multiple-dynamic multiple-echo (MDME) sequence. The major parameters are as follow: repetition time (TR) = 10,205.0 ms; echo time (TE) =11.3 ms; flip angle (FA) = 20°; echo train length = 16; image resolution = 2.0 mm×2.0 mm; and slice thickness = 2 mm with no gap.
The T1 and T2 relaxation time in each WM region was obtained as follow: the vendor-provided postprocessing software (SyntheticMR, v11.2.2) was used to calculate T1- and T2- mapping (T1m and T2m) images. Then, rigid transformation was used to calculate liner transformation matrix between T1m and T1w images. And non-linear warped images between T1w images and T1w template images in MNI space were obtained by rigid, affine and non-linear (SyN) transformation in the Advanced Normalization Tools (ANTs). Using the above linear transformation matrix and non-linear warped images, T2m images were transformed to MNI space. Finally, mean T1 and T2 relaxation time in each WM region were extracted using the JHU DTI-based white-matter atlas. Group comparisons were preformed using a general linear mode with the group as the main factor and the effect of age and gender as covariates.
Results
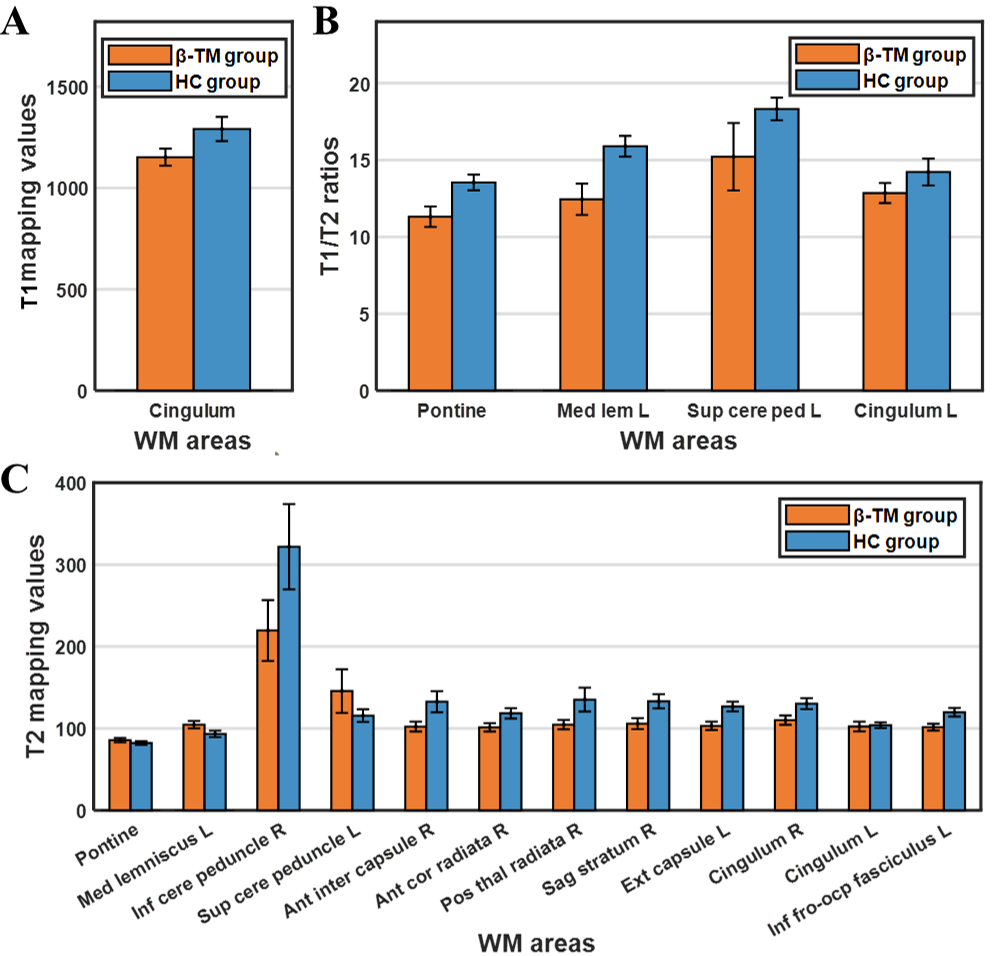
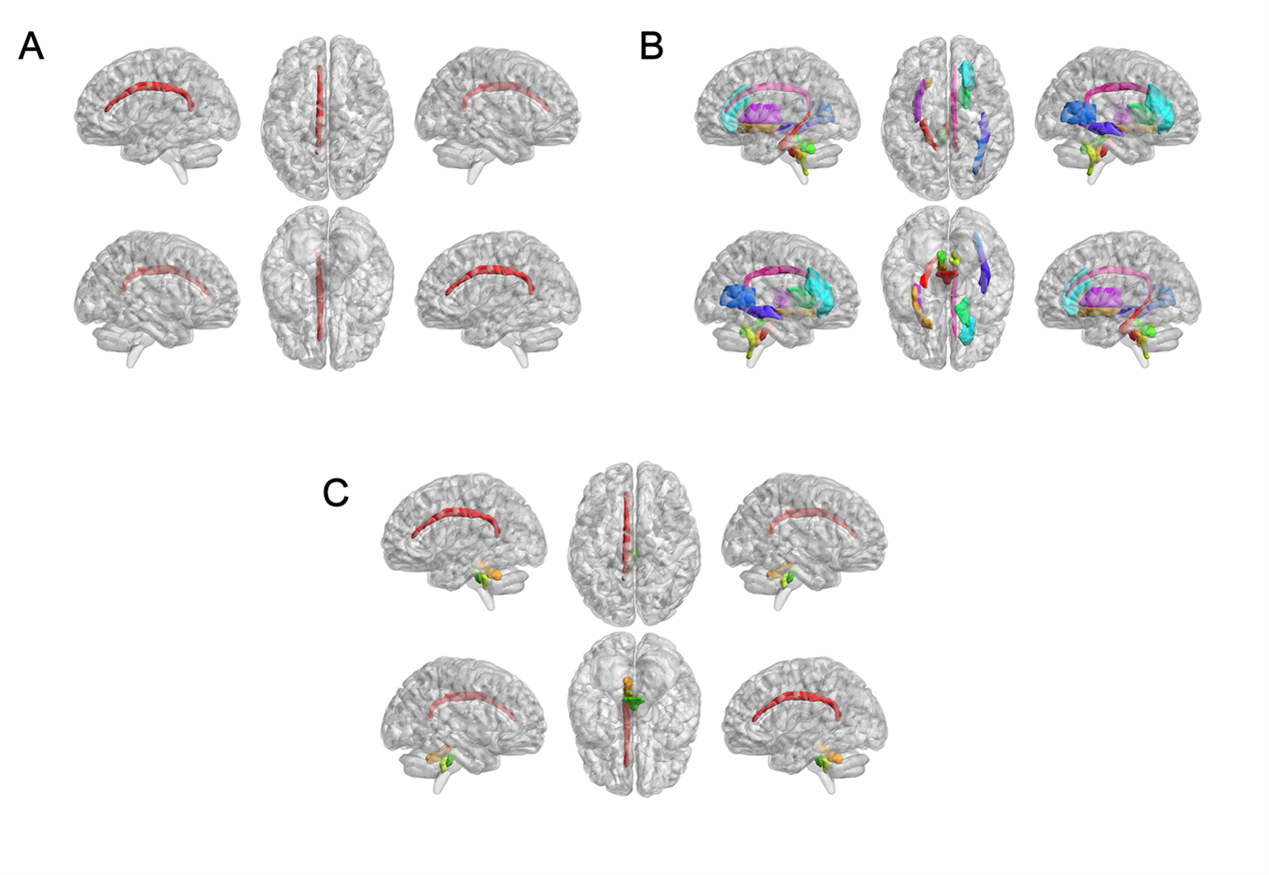
The main demographic characteristics of β-TM patients and HC subjects are shown in Table 1. The significant difference in age (P = 0.004) was found between the two groups, while no significant difference in gender was found (P = 0.472). Differences in T1 value, T2 value and T1/T2 ratio between β-TM and HC groups were showed in the Table 2 and Fig. 1. And corresponding WM regions with group difference were showed in Fig. 2. The T1 mapping value of the left cingulate gyrus was lower in the patients compared with the controls (P < 0.05). The T2 mapping value of the right inferior cerebellar peduncle, anterior limb of internal capsule, anterior corona radiata, posterior thalamic radiation, cingulate gyrus, sagittal stratum (P < 0.01), and left external capsule were lower in patients compared with the controls (P < 0.05), while the pontine crossing tract, left medial lemniscus, superior cerebellar peduncle, and hippocampus were higher in patients compared with the controls (P < 0.05). The T1/T2 ratio of the pontine crossing tract, left medial lemniscus, superior cerebellar peduncle, and cingulate gyrus were lower in patients compared with the controls (p < 0.05).Discussion
In patients with β-TM, the frequent therapy of blood transfusion and iron chelation can lead to the overload iron content in brain, and it may be the major factor causing the T2 decrease in the widespread WM regions. Besides, longer T2 relaxation time was also found in some WM regions. Considering that water trapped between myelin layers has a shorter T2 relaxation time than water in the intracellular and extracellular compartments5, WM regions showed increased T2 may be related to the decrease of myelin concentration. The lower T1/T2 ratio was also found in the part of WM regions showing increased T2 relaxation time, which may support the hypothesis of reduced myelin content in these regions. Moreover, most of WM regions with altered T1, T2 or T1/T2 ratio are responsible for cognitive processes6,7. It suggested that the alterations of WM microstructure could be related to the cognitive disorder in TM.There are some limitations to the present study, including the small sample size and the absence of neuropsychological assessments. A controlled study with a lager cohort including these measures is warranted in the future.
Conclusion
The quantitative MR imaging could reflect the WM microstructure alterations, which can extend our knowledge about the brain changes in β-TM.Acknowledgements
No acknowledgement found.References
1. Galanello R, Origa R. Beta-thalassemia. Orphanet J Rare Dis. 2010;5(1):11.
2. Choi S, O’Neil SH, Joshi AA, et al. Anemia predicts lower white matter volume and cognitive performance in sickle and non‐sickle cell anemia syndrome. Am J Hematol. 2019;94(10):1055–1065.
3. Choi S, Leahy RM, Wood JC. Lower white matter volume in beta‐thalassemia associated with anemia and cognitive performance. Am J Hematol. 2020;95(6):E144–E146.
4. Edwards LJ, Kirilina E, Mohammadi S, Weiskopf N. Microstructural imaging of human neocortex in vivo. Neuroimage. 2018;182184–206.
5. Does MD. Inferring brain tissue composition and microstructure via MR relaxometry. Neuroimage. 2018;182136–148.
6. Salman MS, Tsai P. The Role of the Pediatric Cerebellum in Motor Functions, Cognition, and Behavior. Neuroimag Clin N Am. 2016;26(3):317–329.
7. Apps MAJ, Rushworth MFS, Chang SWC. The Anterior Cingulate Gyrus and Social Cognition: Tracking the Motivation of Others. Neuron. 2016;90(4):692–707.
Figures