2642
Comparison of Myelin Water Imaging from Multi-echo T2 Decay Curve and Myelin Content from Synthetic MRI1Global MR Applications & Workflow, GE Healthcare, Vancouver, BC, Canada, 2Global MR Applications & Workflow, GE Healthcare, Menlo Park, CA, United States
Synopsis
Keywords: White Matter, Brain, myelin water imaging, Synthetic MRI, Myelin
Imaging myelin has long been a target in neuroimaging. Several MR techniques have been developed for in vivo measurement of myelin content. Myelin water fraction (MWF) from multi-echo T2 decay curve has been shown to be a reliable marker for myelin. Myelin content using quantitative synthetic MRI (SyMRI) has also been used to quantify myelin in the brain. In this work, we performed 3D GRASE and SyMRI (using multi-contrast 3D gradient echo) to estimate the myelin correlations between these two techniques. This work will provide guidance for future studies using myelin imaging techniques.
INTRODUCTION
Myelin is an electrically insulating material that consists of multiple lipid rich bilayers wrapped around the axons of neuron. Quantitative mapping of myelin would provide significant insight into development as well as the pathophysiology of myelin-related disorders, and could become a useful clinical tool for diagnosis and management of white matter diseases (1) .Myelin water fraction is one of the best validated and most commonly used quantitative measures for non-invasive assessment of myelin content in the brain (2). It uses a spin-echo based MR sequence to resolve the fraction of water molecules which are located between the layers of myelin. It is a valuable tool for investigating both normal and pathological brain structure in vivo. It was long been considered as the reference method (3).
Synthetic MRI is a technique that synthesizes contrast-weighted images using quantitative relaxometric parameters measured from multi-contrast images. Recently, myelin measurement using quantitative synthetic MRI was introduced to estimate the presence of myelin and edema in the brain (4).
In this study, we performed both 3D GRASE (Gradient and Spin-Echo) and SyMRI (using 3D gradient echo with 5 varying contrasts (5)) on 1.5T system. We compared myelin water fraction from myelin water imaging and myelin content from SyMRI. The aim of this study is to provide groundwork for comparing myelin assessment derived with different techniques. It can provide future guidance for improvement and optimization of the accuracy to measure myelin.
METHODS
All MR imaging experiments were performed on 1.5 T MRI (GE Healthcare, Waukesha, WI, USA) scanner using a 12-channel phased-array head coil for reception and the internal quadrature body coil for transmission. 3D Gradient and Spin-Echo (GRASE) data were acquired from healthy volunteer with the following parameters: FOV=230 × 230 × 100cm3, TR=1000ms, the GRASE factor was 3, the acquisition resolution was 1×1×5 mm3 and images were reconstructed to 1×1×2.5mm3. The scan time was 12:51 minutes. For comparison, 3D Synthetic MR was acquired with the same FOV and resolution (6). The inversion time was 100ms, RF flip angle = 4°, TR=7ms, TE=3.5ms, Bandwidth=31.25kHz. The scan time was 2:54 minutes.The myelin water imaging from GRASE was analyzed using DECAES software(7). The 3D Synthetic MR data was processed for myelin using synthetic MRI NEURO tool (SyntheticMR, Linkoping, Sweden).
RESULTS
The MWF maps (Figure 1(a)) showed substantial differences from the myelin content images (Figure 1(b)). We also compared the mean ROI MWFs and myelin content in five white matter structures (genu and splenium of the corpus callosum, minor and major forceps and the posterior internal capsules) and six gray matter structures (head of the caudate nucleus, putamen, thalamus, cingulate gyrus, insular cortex and cortical GM) (8). Figure 2 plots average MWF vs myelin content values from GRASE and synthetic MRI for each ROI.DISCUSSION
Although white matter appeared brighter on both MWF and myelin content maps (shown in Figure 1), maps created from the two methods for the same volunteer were markedly different. Since the definitions of myelin content and MWF are not identical; myelin content contains myelin water and myelin semisolids, it is expected that the two maps would be different. However, in the Synthetic MRI model, the MWF is proportional to the myelin content because the myelin water corresponds to the myelin proton density in the myelin content (4). Quantitively, the MWF and myelin content were linearly correlated; however, this correlation was primarily driven by the difference between grey matter and white matter ROIs. GRASE gave markedly different MWFs for different white matter structures while myelin content from SyMRI showed similar values for all white matter structures. Synthetic MRI has much shorter scan time and higher SNR. A thorough validation study on patients and healthy controls using both methods will be interesting in future research.CONCLUSION
In summary, MWF and SynMRI derived myelin content yield very different myelin estimates. More research is required to be able to rationalise the differences in myelin-associated parameter estimates. This work can provide more guidance to select the optimal MRI method for myelin applications. Artificial intelligence based undersampling and reconstruction will be explored in the future to improve the SNR efficiency and reduce the scan time of the GRASE MWF acquisition(9,10).Acknowledgements
We thank Fara Nikbeh for her assistance in data collection. We also thank the healthy volunteers for the help.
References
1. MacKay AL, Laule C. Magnetic Resonance of Myelin Water: An in vivo Marker for Myelin. Brain Plast. 2(1):71–91.
2. Prasloski T, Rauscher A, Mackay AL, Hodgson M, Vavasour IM, Laule C, et al. Rapid whole cerebrum myelin water imaging using a 3D GRASE sequence. Neuroimage. 2012 Jul 6;63(1):533–9.
3. Alonso-Ortiz E, Levesque IR, Pike GB. MRI-based myelin water imaging: A technical review. Magn Reson Med. 2014 Mar 6;
4. Warntjes M, Engström M, Tisell A, Lundberg P. Modeling the Presence of Myelin and Edema in the Brain Based on Multi-Parametric Quantitative MRI. Frontiers in Neurology [Internet]. 2016 [cited 2022 Nov 8];7. Available from: https://www.frontiersin.org/articles/10.3389/fneur.2016.00016
5. Fujita S, Hagiwara A, Takei N, Hwang KP, Fukunaga I, Kato S, et al. Accelerated Isotropic Multiparametric Imaging by High Spatial Resolution 3D-QALAS With Compressed Sensing: A Phantom, Volunteer, and Patient Study. Investigative Radiology. 2021 May;56(5):292–300.
6. Takei N, Shin D, Rettmann D, Fujita S, Fukunaga I, Hagiwara A, et al. Prospective motion corrected 3D multi-parametric imaging. In: Proc Intl Soc Mag Reson Med 28 (2020). 2020. (0880).
7. Doucette J, Kames C, Rauscher A. DECAES - DEcomposition and Component Analysis of Exponential Signals. Z Med Phys. 2020 Nov;30(4):271–8.
8. Whittall KP, MacKay AL, Graeb DA, Nugent RA, Li DK, Paty DW. In vivo measurement of T2 distributions and water contents in normal human brain. Magn Reson Med. 1997 Jan;37(1):34–43.
9. Lee J, Lee D, Choi JY, Shin D, Shin HG, Lee J. Artificial neural network for myelin water imaging. Magnetic Resonance in Medicine. 2020;83(5):1875–83.
10. Liu H, Xiang QS, Tam R, Dvorak AV, MacKay AL, Kolind SH, et al. Myelin water imaging data analysis in less than one minute. NeuroImage. 2020 Apr 15;210:116551.
Figures
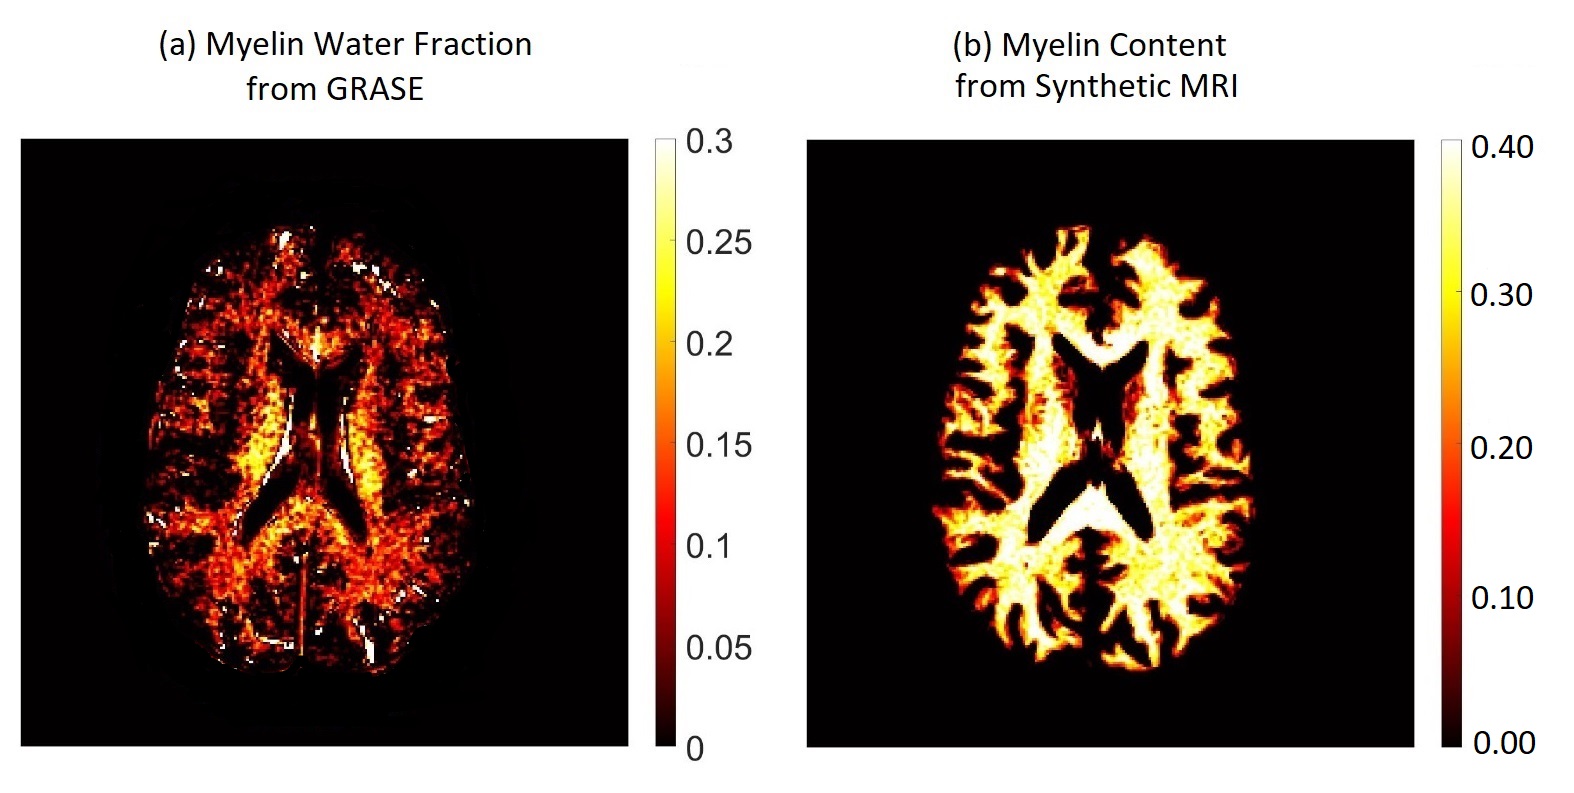
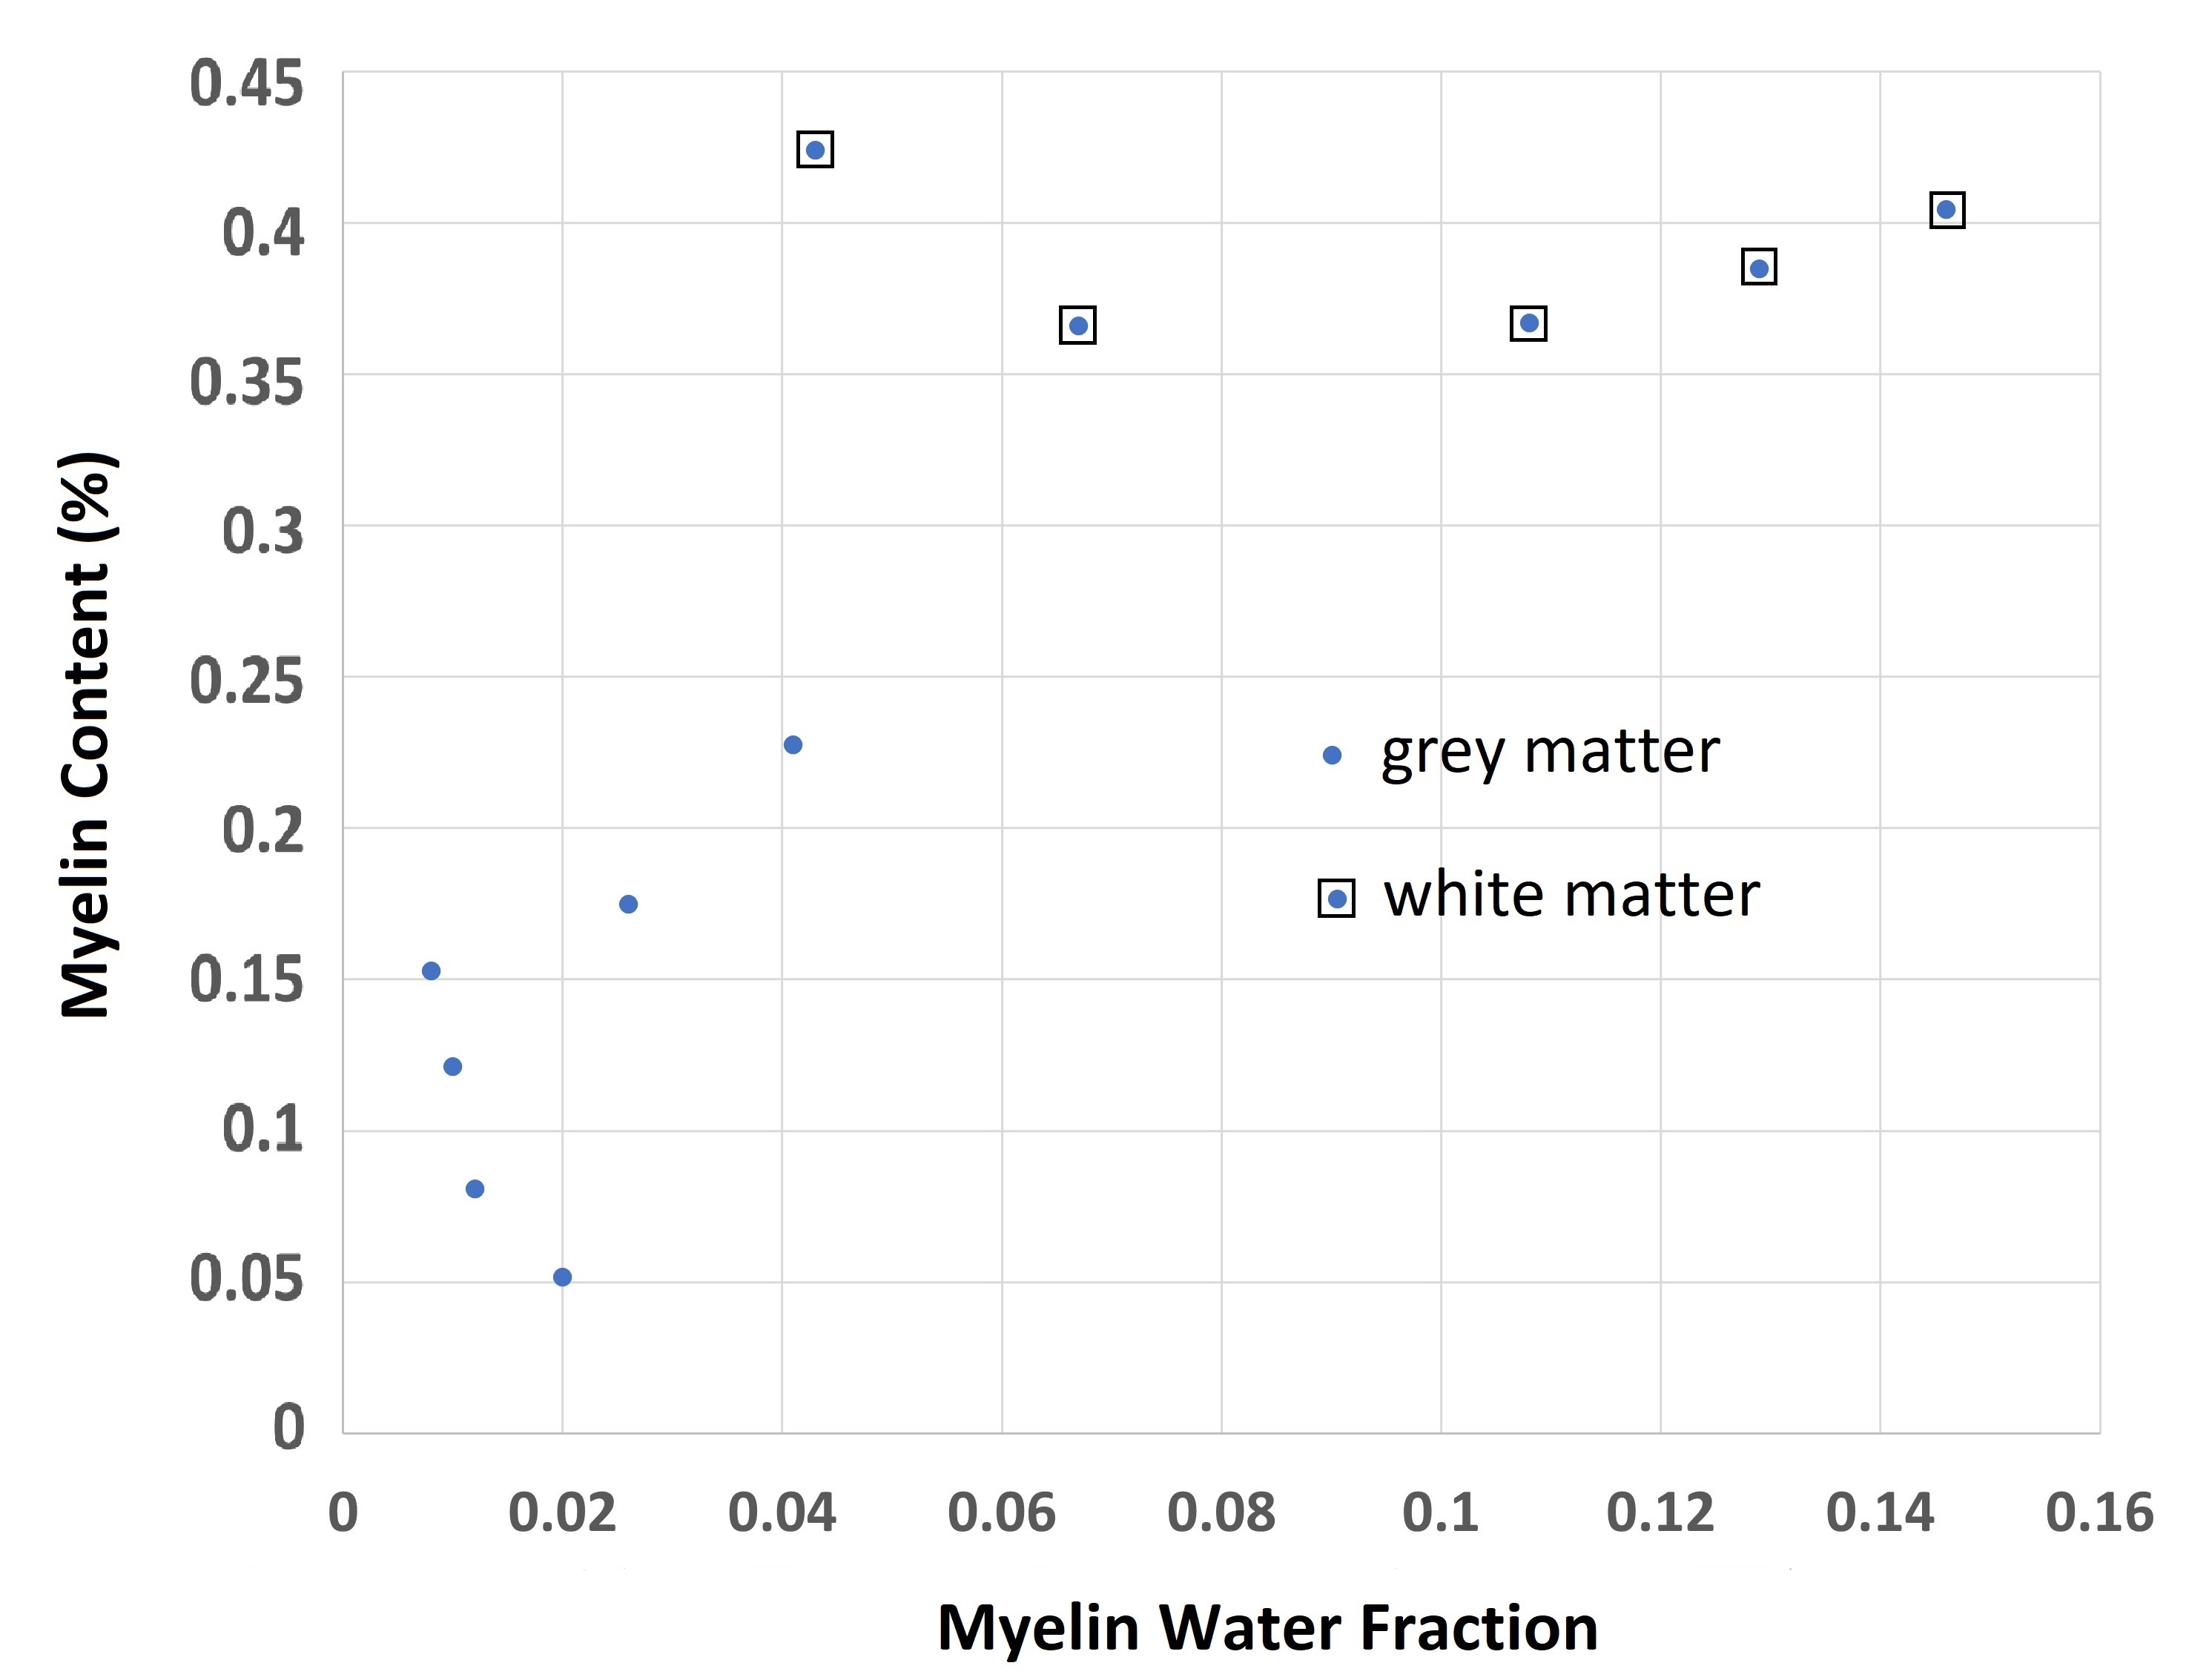
Figure 2: Correlation plot of mean region of interest myelin water fraction and myelin content from GRASE and Synthetic MRI.