2641
Remodeling of White Matter Caused by Sickle Cell Disease1Ming Hsieh Department of Electrical and Computer Engineering, University of Southern California, Los Angeles, CA, United States, 2Institute of Imaging Science, Vanderbilt University, Nashville, TN, United States, 3Department of Pediatrics and Radiology, Children's Hospital Los Angeles, USC, Los Angeles, CA, United States
Synopsis
Keywords: White Matter, Diffusion/other diffusion imaging techniques, Sickle Cell Disease
Sickle cell disease (SCD) is characterized by the presence of different degrees (mild, moderate, or severe) of chronic anemia (quantified by hemoglobin values). Alterations in WM were assessed by performing a voxel-wise analysis in the fractional anisotropy (FA, i.e., overall directionality of water diffusion), mean diffusivity (MD) and their kurtosis analogous (FAK and MK) maps. Surprisingly, when controlling for log-age, sex and hemoglobin, MK showed bigger derangements in the watershed areas than other measurements like FA and FAK despite of controlling for Hb measurements.Introduction
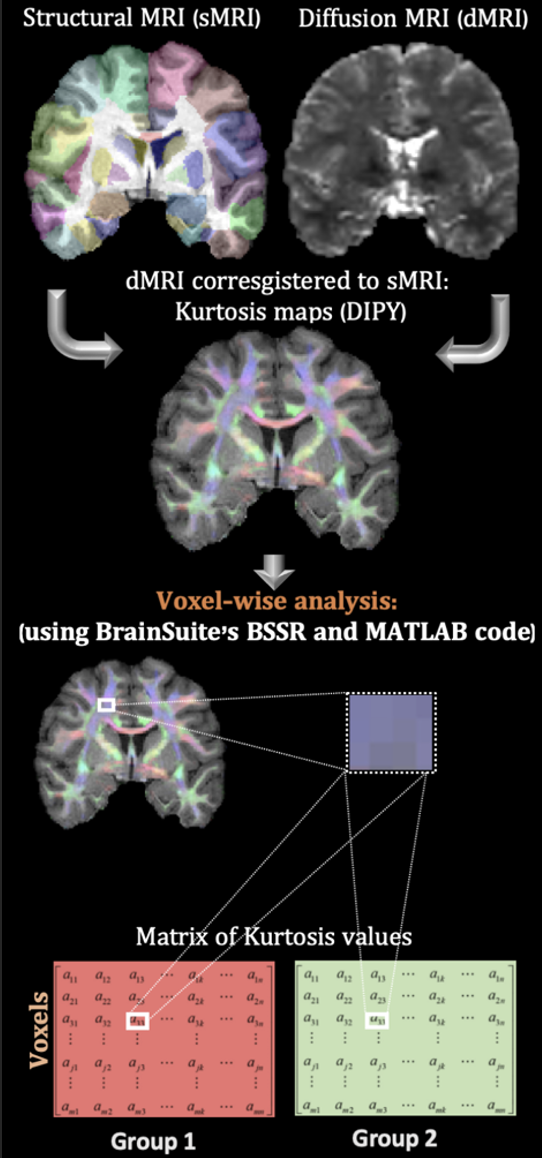
Sickle cell disease (SCD) is characterized by the presence of different degrees (mild, moderate, or severe) of chronic anemia (CA). [1] In particular, intracellular polymerization of the abnormal hemoglobin-S (Hb-S) molecule stretches the round blood cells (RBCs) into a sickle form, leading to agglutination in small brain vessels, causing vaso-occlusion and consequently abnormal perfusion (tissue ischemia, infarction or stroke). [2] RBCs can partially unsickle when re-oxygenation occurs. [3] This process continues until sickling is irreversible and RBCs undergo hemolysis. [4] Structural MRI (sMRI) research in our laboratory demonstrated that White Matter (WM) volume was diffusely lower in deep, watershed areas proportionally to anemia severity. [5] Additional, diffusion MRI (dMRI) analysis has provided evidence that WM microstructure is disrupted proportionally to Hb level and oxygen saturation. [6, 7]. In this study, SCD patients (with a wide range of Hb values) were compared to healthy controls. This allowed us to consider Hb as a continuous regressor and therefore to quantify the effects of CA. Alterations in WM were assessed by performing a voxel-wise analysis in the fractional anisotropy (FA, i.e., overall directionality of water diffusion), mean diffusivity (MD) and their kurtosis analogous (FAK and MK) maps, Fig. 1.Methods
Participants: 80 clinically asymptomatic SCD patients (age = 29.6±10; Hb = 9.7±1.9, F = 34) and 32 control (CTL) subjects (age = 31.4±8.2; Hb = 13.1±1.6; F = 18).Neuroimaging data: MRI data were acquired on a 3T Philips Achieva using an 32-channel head coil. 3D T1-weighted (T1-w) images with TR/TE = 8.3/3.8 ms and isotropic voxel size (VS) of 1 mm3. Multi-shell dMRI with TR/TE = 5300/89 ms; VS=1.8x1.8x2 mm3; 2 diffusion shells with b-values = 1000 s/mm2 (30 diffusion-encoding directions) and b-value = 2500 s/mm2 (30 diffusion-encoding directions); and 3 non-diffusion weighted images at b-value = 0 s/mm2 to measure the motion of water in WM tissue.
Diffusion modeling: T1-w cortical surface delineation, registration, and parcellation to the BCI-DNI anatomical atlas was done using BrainSuite(http://brainsuite.org, v21a). dMRI data were preprocessed with DIPY [8] (for noise removal and Gibbs ringing correction) and FSL (to correct for distortions induced by motion, susceptibility, and eddy currents using FSL) [9,10]. Then, the diffusion tensor (FA and MD) and kurtosis (FAK and MK) maps were calculated in T1 space using DIPY libraries and subsequently co-registered to the BrainSuite’s BCI-DNI atlas for statistical analysis, Fig.1.
Statistical analysis: differences between groups for FA, MD and their kurtosis analogous were modeled only for WM voxels (removing those with partial volume fraction). We performed a permutation analysis in Matlab controlling for age (log-transformed), sex, Hb and corrected by false discovery rate (FDR). The same analysis was also verified in BSSR (https://github.com/BIDS-Apps/BrainSuite).
Results
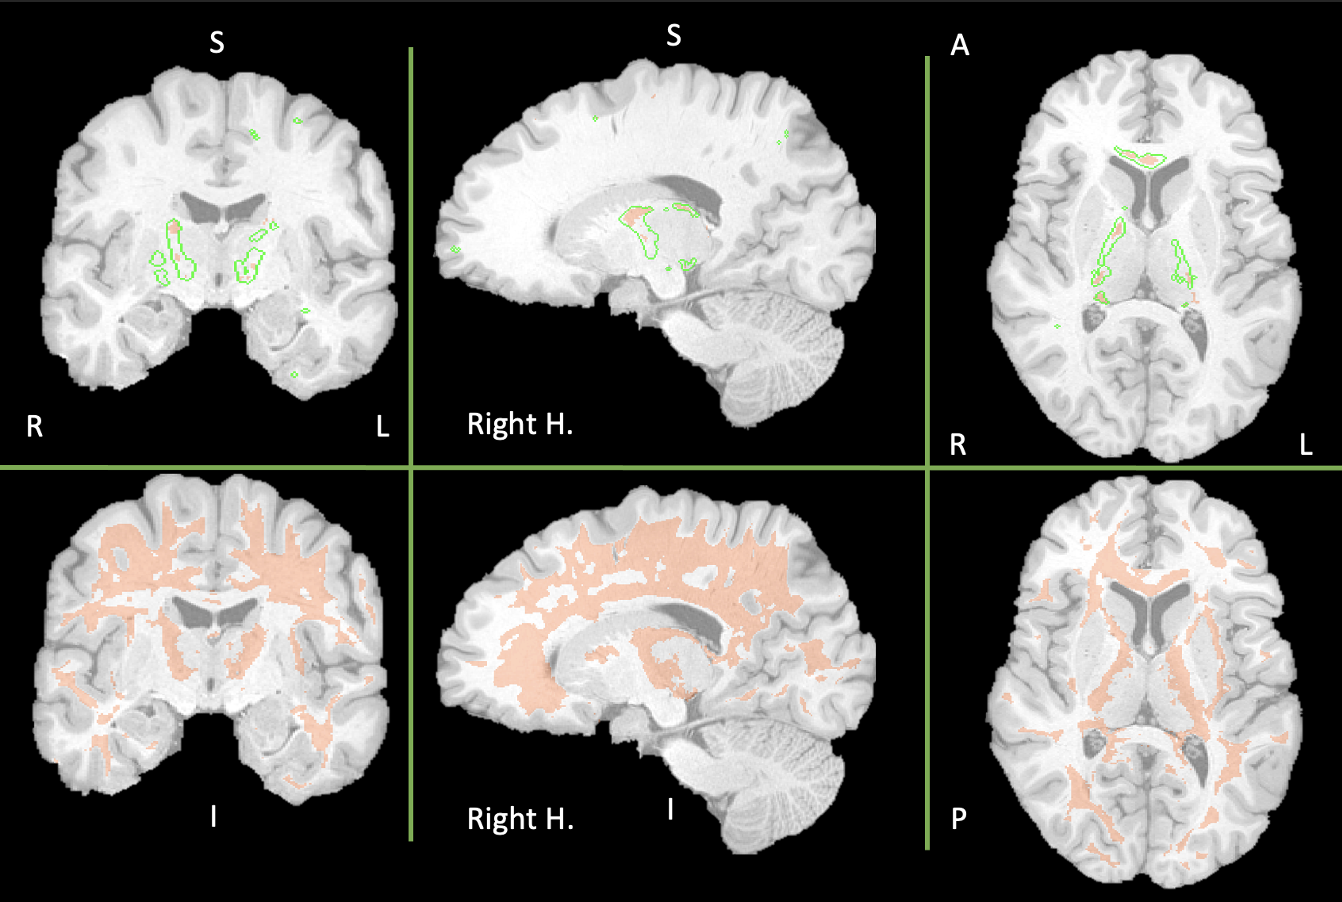
Fig. 2 shows the WM areas where statistical differences were found between SCD patients and controls. The first row in Fig. 2 displays the WM areas were both FA and FAK decreased in SCD patients. Interestingly, the WM regions were FA decreased (green delineations) are bigger than the regions were FAK also decreased. For the case of MD, no statistical differences were found. However, we saw a different behavior for MK. The second row in Fig. 2 shows larger areas of WM were MK decreased in SCD patients. Overall, results displayed in Fig. 2 show bilateral lower FA and FAK values on SCD patients indicating the loss of coherence in the main diffusion direction and WM injury. Furthermore, the same areas are included in the WM regions were MK also decreased in SCD patients: mainly interhemispheric and along watershed areas.Discussion
In this work we observed that changes in WM (quantified by FA, FAK and MK) in the SCD patients compared with healthy controls followed an intuitive pattern, located primarily in the frontal-parietal watershed areas. Most of the affected areas are bilateral and included parts of the corpus callosum like the genu. Interhemispheric involvement is consistent with previous results in our laboratory showing lower FA in the CC on CA patients with higher burden on SCD patients. [6] Additionally, large WM areas of the prefrontal cortex showed decreased on MK. These are the same regions where WM shrinkage has been associated with a neurocognitive decline in CA patients. [5] It is important to note that the results displayed in Fig. 2 are controlled for Hb. In our previous work we observed that WM changes were highly driven by Hb value. This most likely reflects the variable disease expression in our SCD cohort and uncontrolled confounders. This study was limited by the lower number of healthy controls, and the low number of diffusion directions resulting in not being able to resolve sex differences and the lack of robustness in the kurtosis measurements.Conclusion
To characterize the effects of chronic anemia in WM alterations FA, FAK, MD and MK maps were compared between SCD patients and healthy controls. Surprisingly, MK showed bigger derangements in the watershed areas than other measurements like FA and FAK despite of controlling for Hb measurements. This most likely reflects the variable disease expression in our SCD cohort and uncontrolled confounders of mesostructural integrity. However, interhemispheric and bilateral WM regions affected in SCD aligns with previous results in our laboratory.Acknowledgements
No acknowledgement found.References
[1] J. C. Sun and H. V. Joffe, "Chapter 9 - anemia," in The most common inpatient problems in internal medicine , Philadelphia, W.B. Saunders, 2007, pp. 179-198.
[2] R. E. Ware, M. de Montalembert, L. Tshilolo and M. R. Abboud, "Sickle cell disease," The Lancet, vol. 390, no. 10092, pp. 311-323, 2017.
[3] E. Nader, M. Romana and P. Connes, "The red blood cell-inflammation vicious circle in sickle cell disease," Frontiers in Immunology, vol. 11, no. 454, 2020.
[4] F. Padilla, P. A. Bromberg and W. N. Jensen, "The sickle-unsickle cycle: a cause of cell fragmentation leading to permanently deformed cells," Blood, vol. 41, no. 5, pp. 653-660, 1973.
[5] S. Choi, S. H. O'Neil, A. A. Joshi, J. Li, M. A. Bush, T. D. Coates, R. M. Leahy and J. C. Wood, "Anemia predicts lower white matter volume and cognitive performance in sickle and non-sickle cell anemia syndrome," American Journal of Hematology, vol. 94, no. 10, pp. 1055-1065, 2019.
[6] Y. Chai, C. Ji, J. Coloigner, S. Choi, M. Balderrama, C. Vu, B. Tamrazi, T. Coates, J. C. Wood, S. H. O'Neil and N. T. Lepore, "Tract-specific analysis and neurocognitive functioning in sickle cell patients without history of overt stroke," Brain Behav., vol. 11, no. 3, 2021.
[7] Kawadler, J. M, F. J. Kirkham, J. D. Clayden, Hollocks, M. J, Seymour, E. L, R. Edey, P. Telfer, A. Robins, O. Wilkey, S. Barker, T. C. S. Cox and C. A. Clark, "White matter damage relates to oxygen saturation in children with sickle cell anemia without silent cerebral infarcts," Stroke, vol. 46, no. 7, pp. 1793-1799, 2015.
[8] Garyfallidis, E., Brett, M., Amirbekian, B., Rokem, A., Van Der Walt, S., Descoteaux, M., and Nimmo- Smith, I., “Dipy, a library for the analysis of diffusion mri data. Frontiers in neuroinformatics”, 8:8, 2014.
[9] Andersson, J. L. and Sotiropoulos, S. N., “An integrated approach to correction for off-resonance effects and subject movement in diffusion mr imaging,” Neuroimage, 125:1063–1078, 2016
[10] S.M. Smith, M. Jenkinson, M.W. Woolrich, C.F. Beckmann, T.E.J. Behrens, H. Johansen-Berg, P.R. Bannister, M. De Luca, I. Drobnjak, D.E. Flitney, R. Niazy, J. Saunders, J. Vickers, Y. Zhang, N. De Stefano, J.M. Brady, and P.M. Matthews, “Advances in functional and structural MR image analysis and implementation as FSL,” NeuroImage, 23(S1):208-19, 2004
Figures