2631
Associations between gait speeds and myelin content in cognitively unimpaired adults using multicomponent relaxometry1Laboratory of Clinical Investigation, National Institute on Aging, Baltimore, MD, United States, 2Translational Gerontology Branch, National Institute on Aging, Baltimore, MD, United States
Synopsis
Keywords: White Matter, Relaxometry
Abnormal gait speed is a reliable indicator of the progression of age-related neurodegenerations. However, the association between gait speed and myelin content remains unclear. We used multicomponent MR relaxometry of myelin water fraction (MWF) and longitudinal and transverse (R1 and R2) relaxation rates to investigate the association between cerebral myelination and usual or rapid gait speeds in cognitively unimpaired adults spanning a wide age range. Our results indicate that lower myelin content is associated with lower gait speed across several while matter structures.Introduction
Structural and DTI MRI-based studies have shown that impaired white matter integrity is related to impaired mobility1-7. However, the specific role of myelin loss on gait speed remains unclear. In this study, we investigated the relationship between myelin content and gait speed in normative aging. Specifically, we evaluated the associations between usual or rapid gait speeds (UGS and RGS), which represent integrative metrics of physical functioning, and myelin water fraction (MWF) and longitudinal and transverse (R1 and R2) relaxation rates, which represent MRI metrics of myelin integrity. The overarching goal of this study is to develop further insights into the relationship between white matter integrity and motor function.Methods
Data AcquisitionEach participant underwent our BMC-mcDESPOT protocol for MWF, R1, and R2 mapping. The acquisition details of this protocol can be found in our previous studies8-10. Further, usual gait speed (UGS) was assessed by asking participants to walk at their “usual, comfortable pace” over a 6-meter course in an uncarpeted corridor. Similarly, rapid gait speed (RGS) was measured after instructing the participants to walk as quickly as possible, without running11.
Data Processing and Statistical Analysis
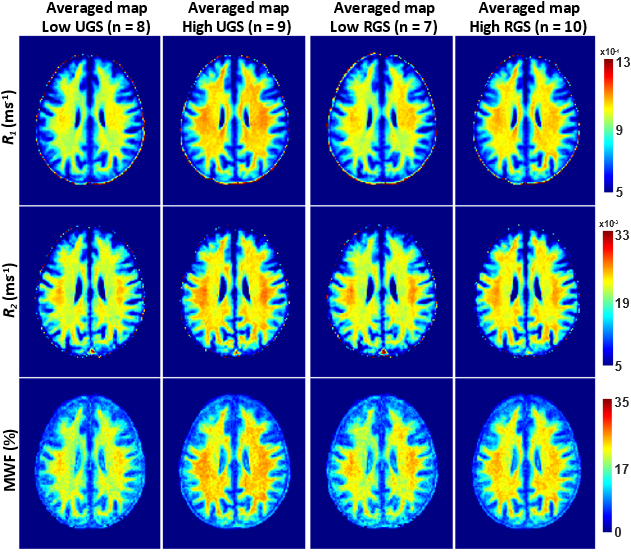
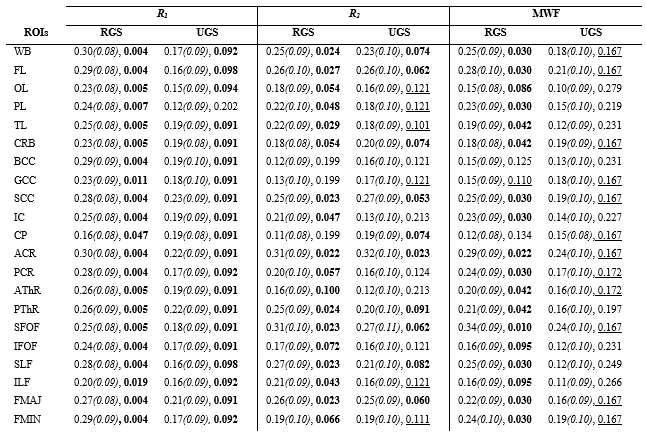
For each participant, whole-brain MWF, R1 and R2 maps were generated using the BMC-mcDESPOT, DESPOT1 and DESPOT2 analyses, respectively12-14. The maps were then registered to the MNI space using the FSL software15. Twenty-one white matter (WM) regions of interest (ROIs) were defined from the MNI structural atlas. For each ROI, the effect of MWF, R1 or R2 on RGS or UGS was investigated using a multiple linear regression model with the value of RGS or UGS as the dependent variable and the mean value of MWF, R1 or R2 within the ROI as the independent variables, with age, sex, race, body mass index (BMI), and MMSE accounted for as relevant covariates. The continuous variables were z-scored.
Results & Discussion
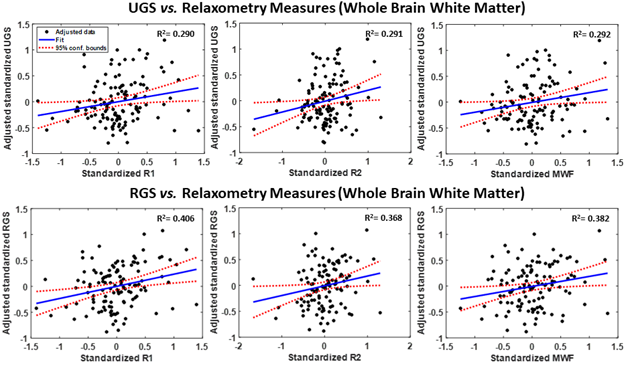
After excluding subjects with cognitive impairments, severe motion artifacts, or missing data, the final study cohort consisted of 118 cognitively unimpaired volunteers (mean ± standard deviation MMSE = 28.8 ± 1.4) ranging in age from 22 to 94 years (55.4 ± 20.4 years). 64 (54.2%) were men and 54 (45.8%) were women, while 82 (69.4%) were White and 24 (20.3%) were Black. Mean ± standard deviation of BMI was 25.8 ± 3.6. Mean ± standard deviations of RGS and UGS were 1.85 ± 0.33 and 1.24 ± 0.22, respectively.We found positive correlations between RGS or UGS and MWF, R1 and R2 (Figs. 1, 2), indicating that lower myelin content is associated with lower gait speeds. The associations between RGS and R1, R2 and MWF were significant in several critical white matter brain regions, even after FDR correction and adjustment for covariates (Table 1). Interestingly, the frontal and parietal lobes, splenium of the corpus callosum, superior fronto-occipital fasciculus, superior longitudinal fasciculus, and anterior corona radiata exhibited the steepest slopes between RGS and our MR parameters, especially R2 and MWF. These results suggest that demyelination in brain regions responsible for sensory integration, motor and executive processes, and cognitive control may contribute more greatly to RGS disturbances as compared to other cerebral regions. In contrast, we did not find any significant association (p < 0.05) between UGS and MWF, and only close-to-significant associations (p < 0.1) between UGS and R1 or R2 (Table 1). The effect of MWF, R1 and R2 was also weaker on UGS than RGS. These findings suggest that RGS may be a more sensitive marker of demyelination than UGS, likely due to the higher demands placed on the brain during RGS performance, including greater postural stability and cognitive control, as compared to UGS performance. Hence, age-related decline in motor functions as a result of myelin degeneration may be more reliably detected among cognitively unimpaired adults when performing more strenuous physical activities, as seen here.
Conclusion
Our study provides new insights into the importance of myelin on physical functioning indicating that loss of cerebral myelination contributes to age-related gait disruptions among cognitively healthy individuals. This work lays the foundation for investigations to further elucidate the specific relationship between gait speed impairments and myelination in cognitive impairments, including in Alzheimer’s disease.Acknowledgements
This work was supported by the Intramural Research Program of the National Institute on Aging of the National Institutes of Health.References
1. Snir JA, Bartha R, Montero-Odasso M. White matter integrity is associated with gait impairment and falls in mild cognitive impairment. Results from the gait and brain study. Neuroimage Clin. 2019;24:101975.
2. Bruijn SM, Van Impe A, Duysens J, Swinnen SP. White matter microstructural organization and gait stability in older adults. Front Aging Neurosci. 2014;6:104.
3. Tian Q, Williams OA, Landman BA, Resnick SM, Ferrucci L. Microstructural Neuroimaging of Frailty in Cognitively Normal Older Adults. Front Med (Lausanne). 2020;7:546344.
4. Ducca EL, Gomez GT, Palta P, Sullivan KJ, Jack CR, Knopman DS, et al. Physical Frailty and Brain White Matter Abnormalities: The ARIC Study. J Gerontol A Biol Sci Med Sci. 2022.
5. Tian Q, Ferrucci L, Resnick SM, Simonsick EM, Shardell MD, Landman BA, et al. The effect of age and microstructural white matter integrity on lap time variation and fast-paced walking speed. Brain Imaging Behav. 2016;10(3):697-706.
6. Boa Sorte Silva NC, Dao E, Hsu CL, Tam RC, Lam K, Alkeridy W, et al. Myelin and Physical Activity in Older Adults with Cerebral Small Vessel Disease and Mild Cognitive Impairment. J Gerontol A Biol Sci Med Sci. 2022.
7. Tian Q, Schrack JA, Landman BA, Resnick SM, Ferrucci L. Longitudinal associations of absolute versus relative moderate-to-vigorous physical activity with brain microstructural decline in aging. Neurobiol Aging. 2022;116:25-31.
8. Bouhrara M, Rejimon AC, Cortina LE, Khattar N, Bergeron CM, Ferrucci L, et al. Adult brain aging investigated using BMC-mcDESPOT-based myelin water fraction imaging. Neurobiol Aging. 2020;85:131-9.
9. Bouhrara M, Spencer RG. Rapid simultaneous high-resolution mapping of myelin water fraction and relaxation times in human brain using BMC-mcDESPOT. Neuroimage. 2017;147:800-11.
10. Triebswetter C, Kiely M, Khattar N, Ferrucci L, Resnick SM, Spencer RG, Bouhrara M. Differential associations between apolipoprotein E alleles and cerebral myelin content in normative aging. NeuroImage. 2022;251:118988.
11. Tian Q, Ferrucci L, Resnick SM, Simonsick EM, Shardell MD, Landman BA, et al. The effect of age and microstructural white matter integrity on lap time variation and fast-paced walking speed. Brain Imaging Behav. 2016;10(3):697-706.
12. Bouhrara M, Spencer RG. Improved determination of the myelin water fraction in human brain using magnetic resonance imaging through Bayesian analysis of mcDESPOT. Neuroimage. 2016;127:456-71.
13. Bouhrara M, Spencer RG. Incorporation of nonzero echo times in the SPGR and bSSFP signal models used in mcDESPOT. Magn Reson Med. 2015;74(5):1227-35.
14. Deoni SC, Rutt BK, Peters TM. Rapid combined T1 and T2 mapping using gradient recalled acquisition in the steady state. Magn Reson Med. 2003;49(3):515-26.
15. Jenkinson M, Beckmann CF, Behrens TE, Woolrich MW, Smith SM. FSL. Neuroimage. 2012;62(2):782-90.
Figures