2630
Myelin Water Atlas Template derived from Quantitative Parameter Mapping
Yuki Kanazawa1, Shun Kitano1, Masafumi Harada1, Yo Taniguchi2, Yuki Matsumoto1, Hiroaki Hayashi3, Kosuke ito2, Yoshitaka Bito2, and Akihiro Haga1
1Tokushima University, Tokushima, Japan, 2FUJIFILM Healthcare Corporation, Tokyo, Japan, 3Kanazawa University, Kanazawa, Japan
1Tokushima University, Tokushima, Japan, 2FUJIFILM Healthcare Corporation, Tokyo, Japan, 3Kanazawa University, Kanazawa, Japan
Synopsis
Keywords: White Matter, Relaxometry
We generated a myelin water atlas template derived from QPM. Imaging data were acquired using a multi-gradient-echo sequence for QPM. All the data in the 48 white matter regions measured in the volume-of-interest were plotted, and quadratic polynomial equations of each region were derived from the relationship between R1·R2* and the two-component model-MWF. As a result, the relationship between R1·R2* and MWF showed a strong significant correlation for all of the white matter regions (R2 ≥ 0.963, P < 0.0001). Our myelin water atlas template derived from QPM can be used as a reference to demonstrate areas of demyelinating disease.INTRODUCTION
Myelin water imaging is considered a promising method to directly measure myelin content. Multi-component analysis of T2* attenuation using a multi-gradient-echo (MGRE) sequence was proposed as an alternative to overcome the long acquisition time of the multi-echo spin-echo (MESE) method [1]. The MGRE sequence uses an excitation pulse with a low specific absorption rate without a refocusing pulse and can be achieved myelin water imaging with a better signal-to-noise ratio (SNR) when compared to the SE method [2]. In a previous study, we developed a novel myelin-weighted imaging process using physical parameters derived from quantitative parameter mapping (QPM) [3]. To use as a reference of myelin water content in normal white matter (WM), we need to generate an atlas of myelin water for the standardization of QPM myelin-weighted images. The purpose of this study was to develop a myelin water atlas template derived from QPM.METHODS
Figure 1 shows the process for generating the myelin water atlas template derived from QPM. QPM-MRI was performed on twelve healthy volunteers (seven men, and five women; ages, 21-54 years; mean age, 35.2 years). The datasets from each myelin imaging were composed of three-dimensional partially radio frequency-spoiled steady-state gradient-echo (3D-RSSG) methods on a 3 Tesla MR scanner system (FUJIFILM Healthcare Corp.). The imaging parameters were TEs 4.6-36.8 ms (ΔTE, 4.6 ms); repetition times, 10-41.1 ms; flip angles 10 and 40 degrees. Each data was calculated from the 3D-RSSG dataset for QPM; R1·R2* product data, and MWF a multi-echo 3D-RSSG data for the QPM dataset. Before calculating MWF, spatial normalization to the shape of the MNI152 brain was applied to the dataset using FSL software. Then, the R1·R2* product map was calculated using the same spatial transformation matrices as the MWF dataset. MWF using a two-pool model was calculated by fitting with the non-negative least squares methods. Volume-of-interest (VOI) analysis using a JHU-WM atlas was performed on the data averaged from MWF and R1·R2*. In addition, all the data in the 48 regions measured by VOI were plotted and quadratic polynomial approximation was performed to obtain the coefficient of determination. Finally, using acquired quadratic polynomial approximations of 48 regions, the R1·R2* map was converted to MWF.RESULTS & DISCUSSION
Table 1 shows the relationship between MWF and R1·R2* in the 48 WM regions after spatial normalization. Figure 2 shows scatter plots demonstrating correlations between R1·R2* and MWF values for some representative VOIs for 48 WM regions. In all 48 regions, we found a strong correlation with a quadratic polynomial approximation (all, R2 ≥ 0.963, P < 0.0001). The MWF value of the splenium of corpus callosum (VOI#5) shows the highest value and that of the cingulum (VOI#37&38) the lowest. Figure 3 shows the R1·R2* map standardized from twelve healthy volunteers to MNI. Figure 4 shows a myelin water atlas template derived from QPM. Although we did not measure a large enough number of subjects to generate a myelin water atlas, using QPM-MRI can increase the number of subjects without additional imaging and improve the accuracy of an atlas of myelin water content.CONCLUSION
Our myelin water atlas template derived from QPM can be used as a reference to demonstrate areas of demyelinating disease.Acknowledgements
No acknowledgement found.References
- Du YP, Chu R, Hwang D, et al. Fast multislice mapping of the myelin water fraction using multicompartment analysis of T2* decay at 3T: a preliminary postmortem study. Magn Reson Med. 2007;58(5):865-70.
- Hwang D, Kim DH, Du YP. In vivo multi-slice mapping of myelin water content using T2* decay. Neuroimage 2010;52:198–204.
- Kanazawa Y, Harada M, Taniguchi Y, et al. Myelin-weighted imaging derived from quantitative parameter mapping. Eur J Radiol. 2022;156:110525.
Figures
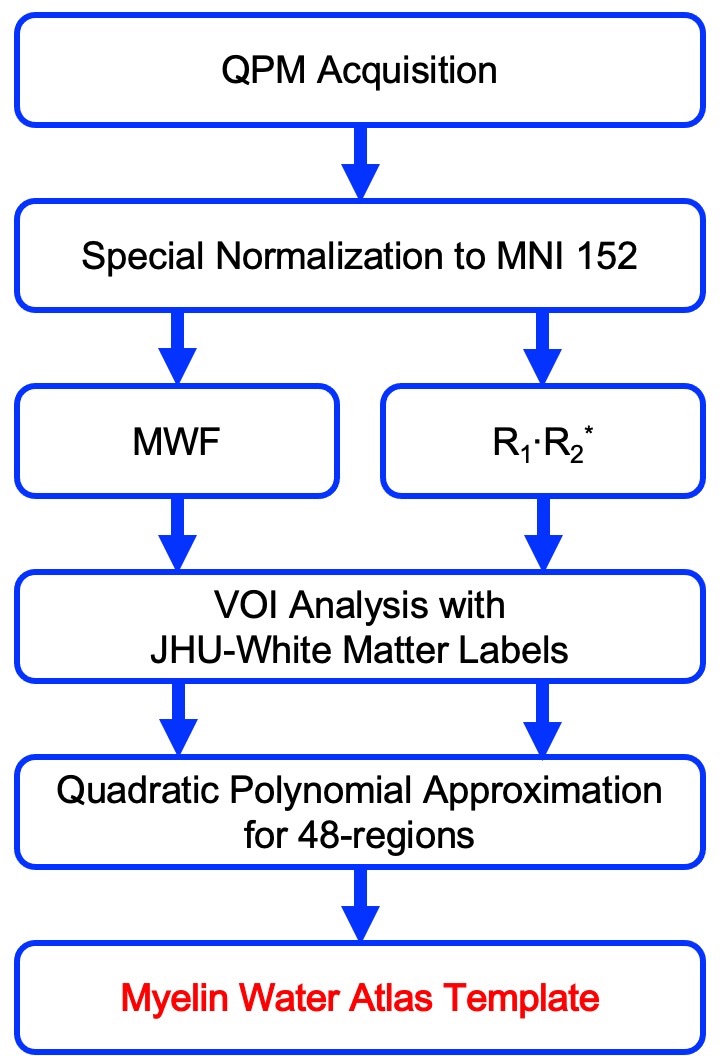
Figure 1 A schematic diagram of the process of generating the myelin water atlas template derived from QPM.
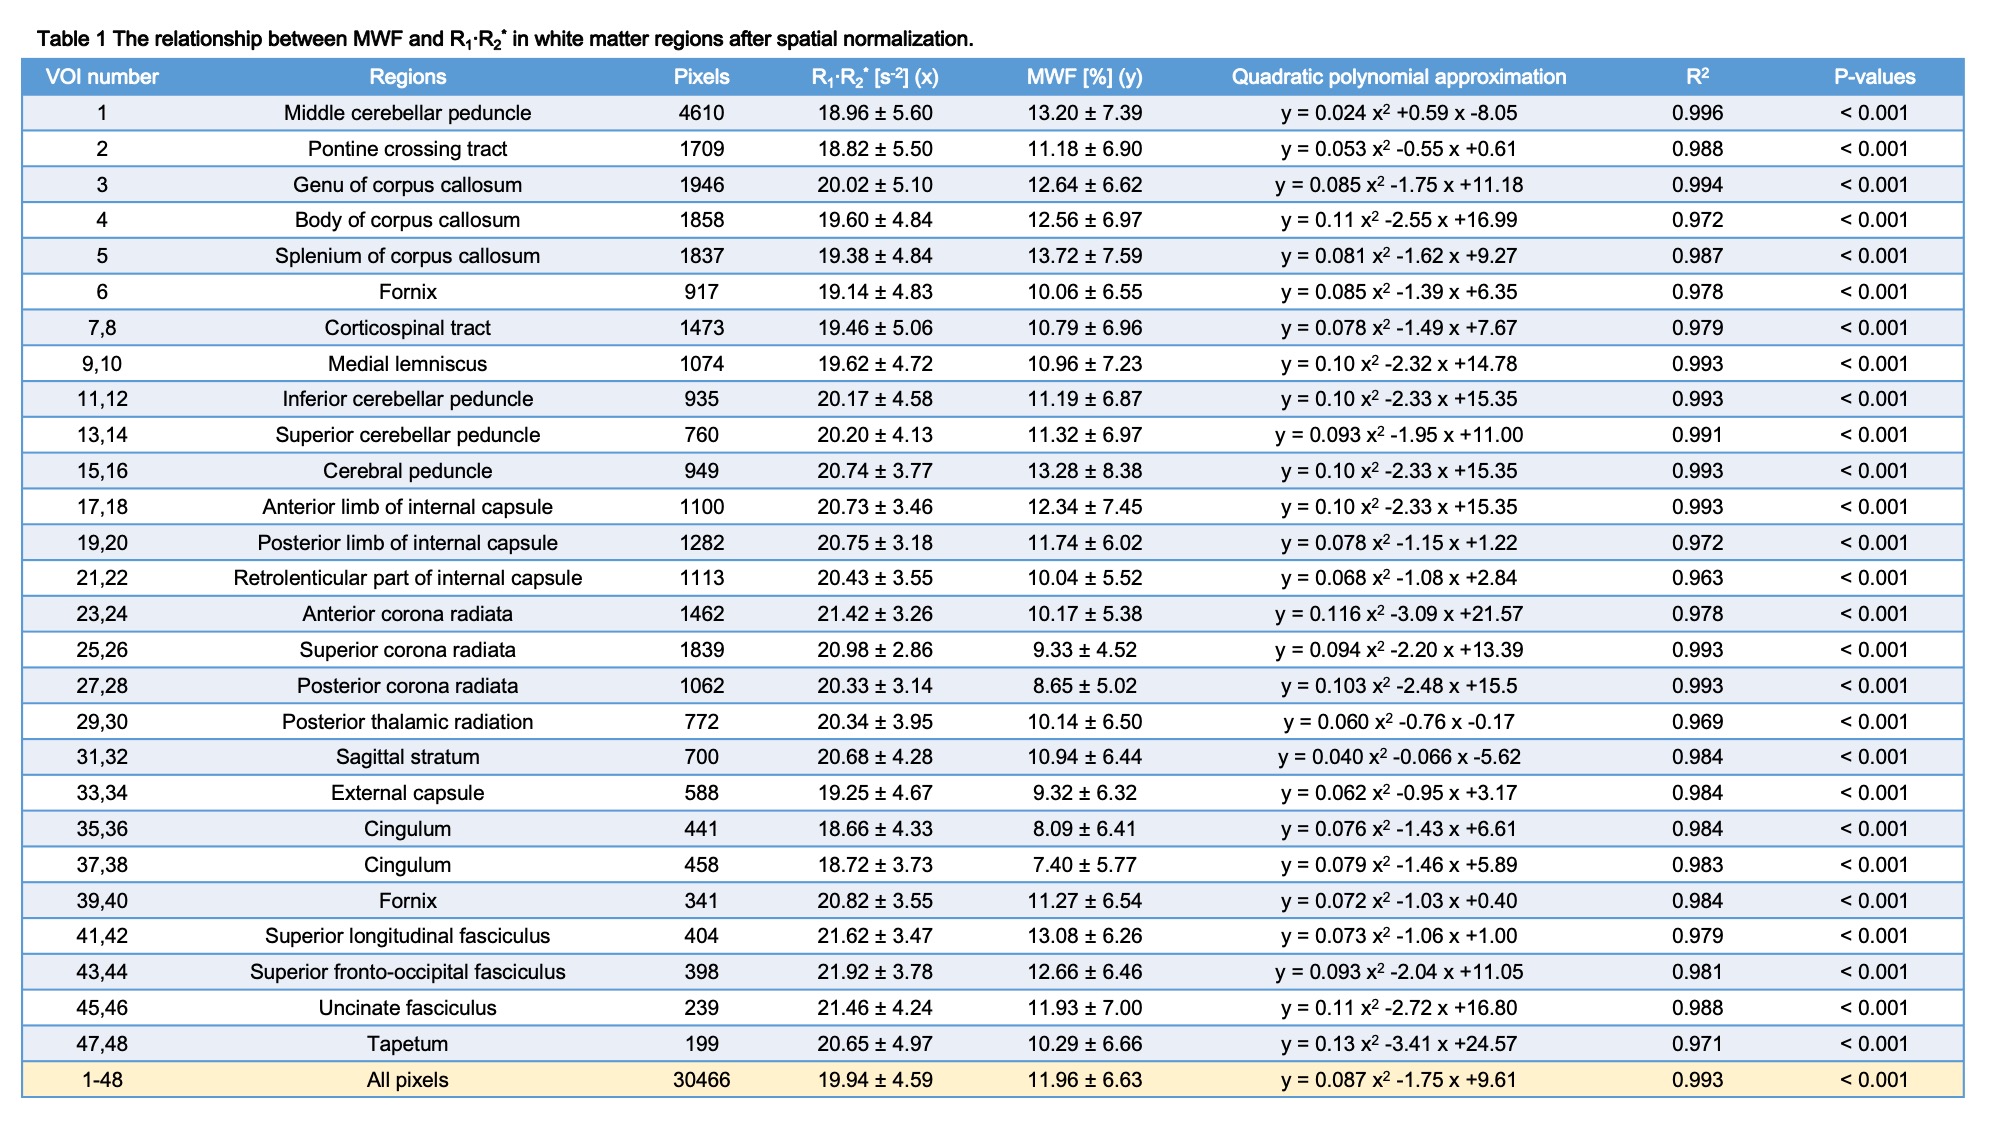
Table 1 The relationship between MWF and R1·R2* in the 48 WM regions after spatial normalization.
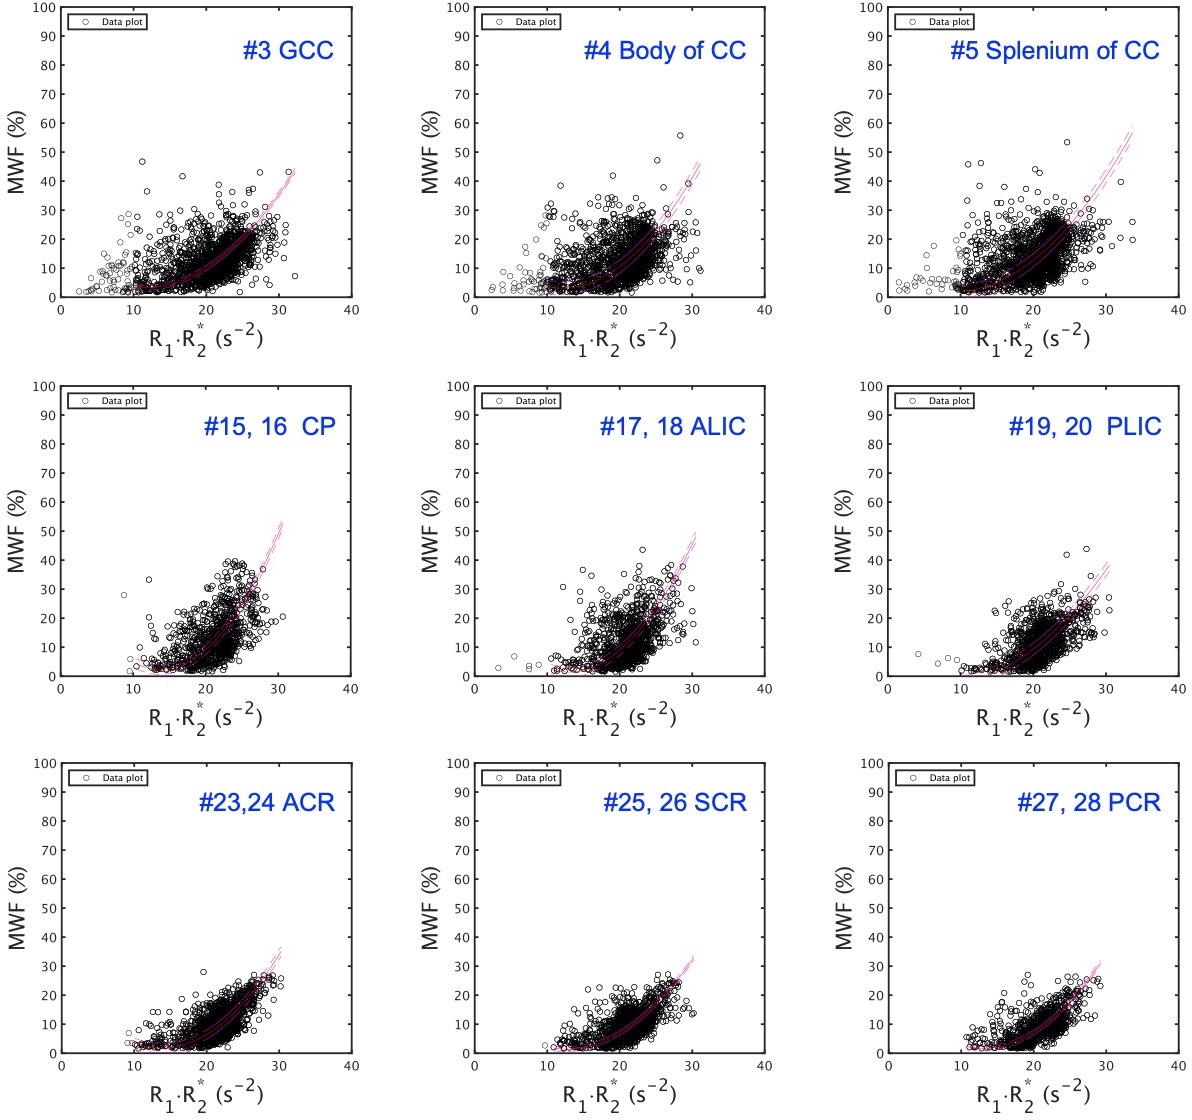
Figure 2 Scatter plots demonstrating correlations between R1·R2* and MWF values for some represented VOIs for 48 WM regions. Upper row is genu of corpus callosum (GCC), body of corpus callosum (CC), and splenium of CC; middle row is cerebral peduncle (CP), anterior limb of internal capsule (ALIC), and posterior limb of internal capsule (PLIC; #19, 20); lower row is anterior corona radiata (ACR), superior corona radiata (SCR), and posterior corona radiata (PCR).
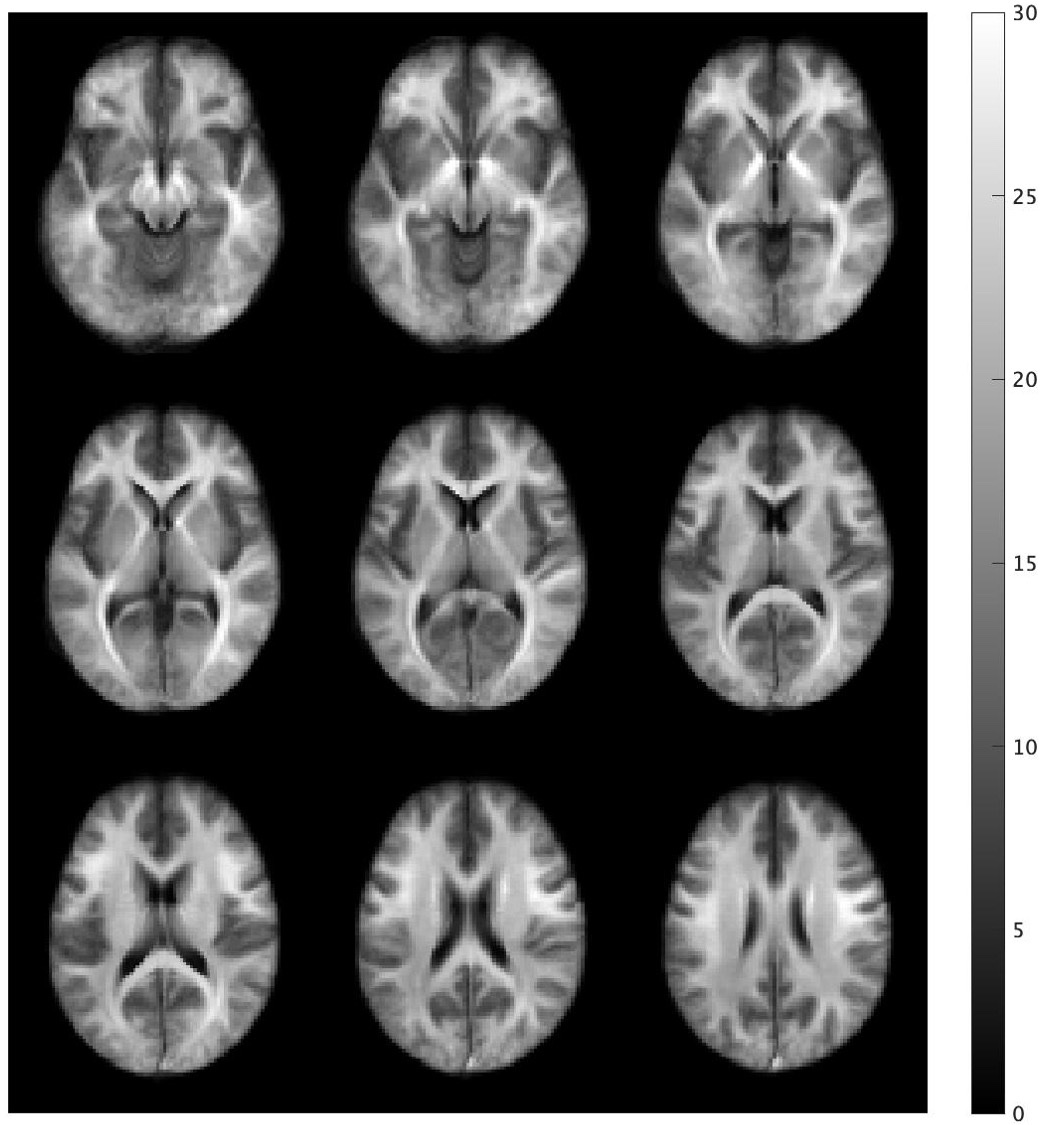
Figure 3 The QPM-R1·R2* map standardized from twelve healthy volunteers to MNI.
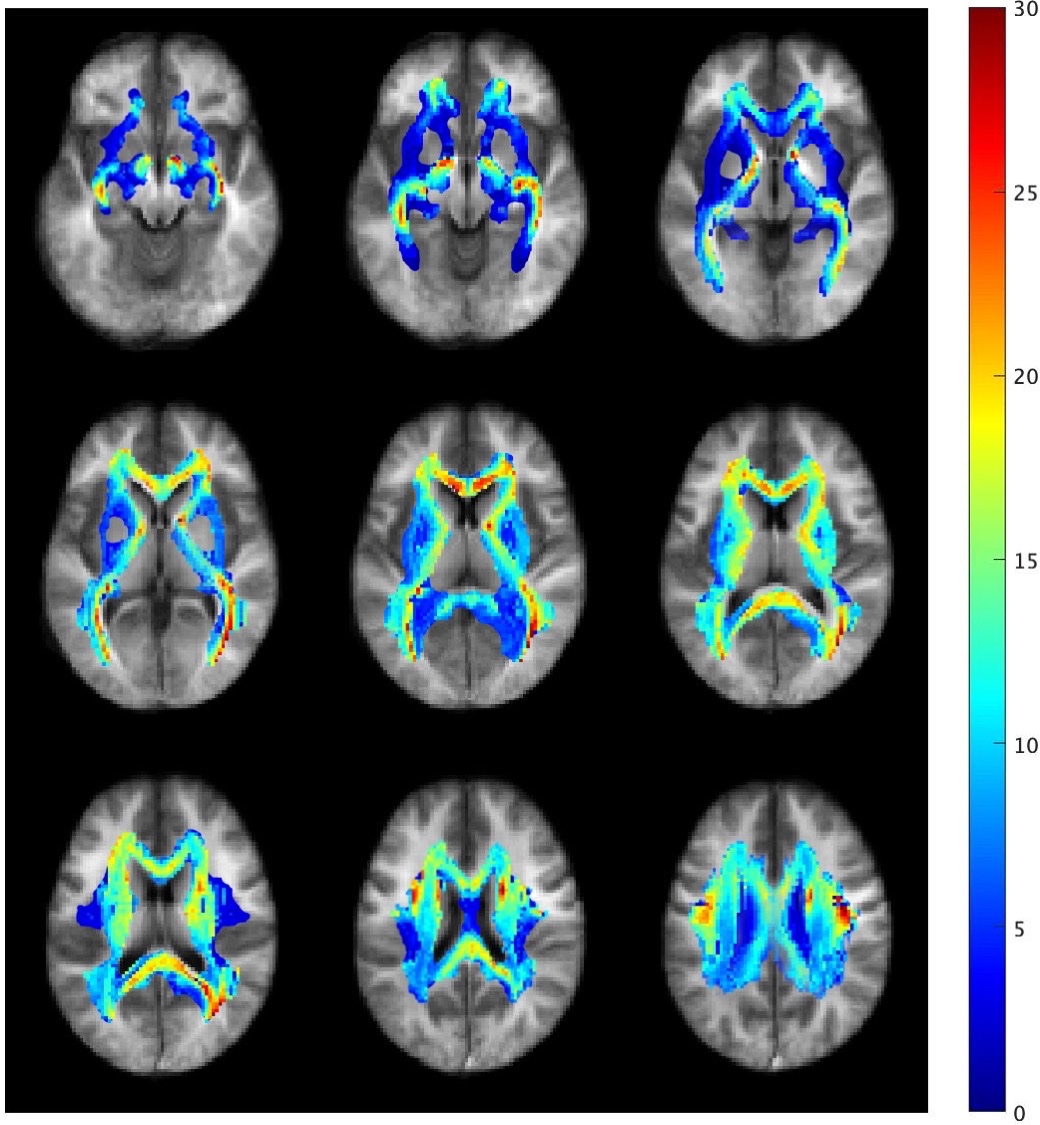
Figure 4 A myelin water atlas template derived from QPM. Color maps of the myelin water atlas template overlay the standardized QPM-R1·R2* map.
DOI: https://doi.org/10.58530/2023/2630