2629
TR effect on Myelin Water Imaging1Global MR Applications & Workflow, GE Healthcare, Vancouver, BC, Canada, 2Global MR Applications & Workflow, GE Healthcare, Menlo Park, CA, United States, 3Department of Radiology, University of British Columbia, Vancouver, BC, Canada
Synopsis
Keywords: White Matter, White Matter, myelin water imaging
Myelin water fraction (MWF) is conventionally measured using the T2 decay curve. For a spin-echo based sequence, the repetition time (TR) is limited by SAR. Most MWF studies have been carried out at 3T; but a 1.5T system has lower power deposition, which enables MWF imaging at lower TRs. Shorter TR will also reduce the total scan time. In this work, we performed myelin water imaging on a 1.5T system to investigate the effect of shorter TR on this technique. This work demonstrated increased MWF in human brain in vivo with decreasing TR.
INTRODUCTION
Myelin water imaging (MWI), a magnetic resonance imaging technique capable of resolving the fraction of water molecules which are located between the layers of myelin, is a valuable tool for investigating both normal and pathological brain structure in vivo. MWI using a spin-echo based MR sequence was considered as the reference method (1). This method has been used to visualize myelination in the brain and spinal cord in vivo (2).Myelin water imaging based on 3D Gradient and Spin echo (GRASE) have been introduced to allow whole cerebrum imaging in less scan time (3). On the other hand, shorter TR values can also decrease scan times. With current SAR limits, the minimum TR is approximately 1000 ms at 3 T and about 1700 ms at 7 T (4). Myelin Water Fraction (MWF) values have been observed in-vivo to be higher when using shorter TR values (5). However, due to SAR limits, this was only investigated for TR larger than 1100ms. It is not clear how MWF changes when TR is shorter than 1000ms.
In this research, we implemented myelin water imaging GRASE sequence on 1.5T system. We investigated the effect of shorter TR on MWF. The aim of this work was to illustrate the effect of shorter TR on myelin water imaging. It can also provide more in-vivo evidence to understand the myelin water imaging changes through magnetization relaxation and exchange.
METHODS
All MR imaging experiments were performed on 1.5 T MRI (GE Healthcare, Waukesha, WI, USA) scanner using a 12-channel phased-array head coil for reception and the internal quadrature body coil for transmission. GRASE data were acquired from healthy volunteer with 3 different TRs: a) TR= 492ms, b) TR= 700ms, c) TR=1000ms. Their corresponding scan times were 6:20 minutes, 9:00 minutes and 12:51 minutes. For all sequences, the GRASE factor was 3, FOV=230 × 230 × 100cm3, the acquisition resolution was 1×1×5 mm3 and images were reconstructed to 1×1×2.5mm3. To identify different regions of interest, MPRAGE (40 slices, TR/TE = 7.5/2.9ms, IR =700 ms, slice thickness = 2.5 mm) were also acquired with the same FOV and resolution. The myelin water imaging from GRASE was analyzed using DECAES software(6).RESULTS
The MWF maps showed large differences across the three sequences (Figure 1). MWF values were increased with shorter TR. Sequence c) TR= 1000ms provided similar MWF values to literature reports at 1.5T (7). Figure 2 shows mean ROI MWFs from different brain structures. White matter regions have increased MWF values with shorter TR, while grey matter regions change differently.DISCUSSION
Qualitatively, a higher MWF indicates more of the short T2 components of magnetisation is aligned in the Z direction prior to the 90◦ RF pulse. At shorter TR, we observed higher MWF for white matter brain structures. This provided more evidence to the four-pool model theory: (i) myelin tissue (M), (ii) myelin water (MW), (iii) intra/extracellular water (IEW), and (iv) non-myelin tissue (NM) (8). Following the echo train, myelin water and intra/extracellular water undergo longitudinal relaxation both through T1 decay and exchange with myelin tissue and non-myelin tissue respectively. There is faster exchange between semi-solid and aqueous myelin tissue than between semi-solid and aqueous non-myelin tissue. In effect, at shorter TR, the intra-extracellular water signal is more saturated than the myelin water signal, resulting in a relative increase in the myelin water peak and in accompanying increase in apparent myelin water fraction. This effect was clearly demonstrated in white matter structures but much less evident in grey matter structures. The most likely explanation for the different MWF behaviour in grey matter is the fact that the grey matter myelin water signal is much lower than that of myelin water in white matter. This issue is compounded by the substantially lower SNR available at 1.5T. Artificial intelligence based undersampling and reconstruction will be explored in the future to improve the SNR efficiency.CONCLUSION
We have presented myelin water imaging on 1.5T system with several different TRs. This work provides further in-vivo validation of increased myelin water fraction with shorter TR. It can also provide guidance for myelin water imaging using shorter TRs on advanced MR hardware platforms such as brain-only MR systems.Acknowledgements
We thank Fara Nikbeh for her assistance in data collection. We also thank the healthy volunteers for the help.
References
1. Alonso-Ortiz E, Levesque IR, Pike GB. MRI-based myelin water imaging: A technical review. Magn Reson Med. 2014 Mar 6;
2. MacKay AL, Laule C. Magnetic Resonance of Myelin Water: An in vivo Marker for Myelin. Brain Plast. 2(1):71–91.
3. Prasloski T, Rauscher A, Mackay AL, Hodgson M, Vavasour IM, Laule C, et al. Rapid whole cerebrum myelin water imaging using a 3D GRASE sequence. Neuroimage. 2012 Jul 6;63(1):533–9.
4. Wiggermann V, MacKay AL, Rauscher A, Helms G. In vivo investigation of the multi-exponential T2 decay in human white matter at 7 T: Implications for myelin water imaging at UHF. NMR in Biomedicine. 2021;34(2):e4429.
5. Kalantari S. Characterizing magnetization exchange in healthy human brain and bovine brain [Internet]. University of British Columbia; 2013 [cited 2022 Nov 6]. Available from: https://open.library.ubc.ca/soa/cIRcle/collections/ubctheses/24/items/1.0071966
6. Doucette J, Kames C, Rauscher A. DECAES - DEcomposition and Component Analysis of Exponential Signals. Z Med Phys. 2020 Nov;30(4):271–8.
7. Kolind SH, Mädler B, Fischer S, Li DKB, MacKay AL. Myelin water imaging: Implementation and development at 3.0T and comparison to 1.5T measurements. Magnetic Resonance in Medicine. 2009;62(1):106–15.
8. Manning AP, MacKay AL, Michal CA. Understanding aqueous and non-aqueous proton T1 relaxation in brain. Journal of Magnetic Resonance. 2021 Feb 1;323:106909.
Figures
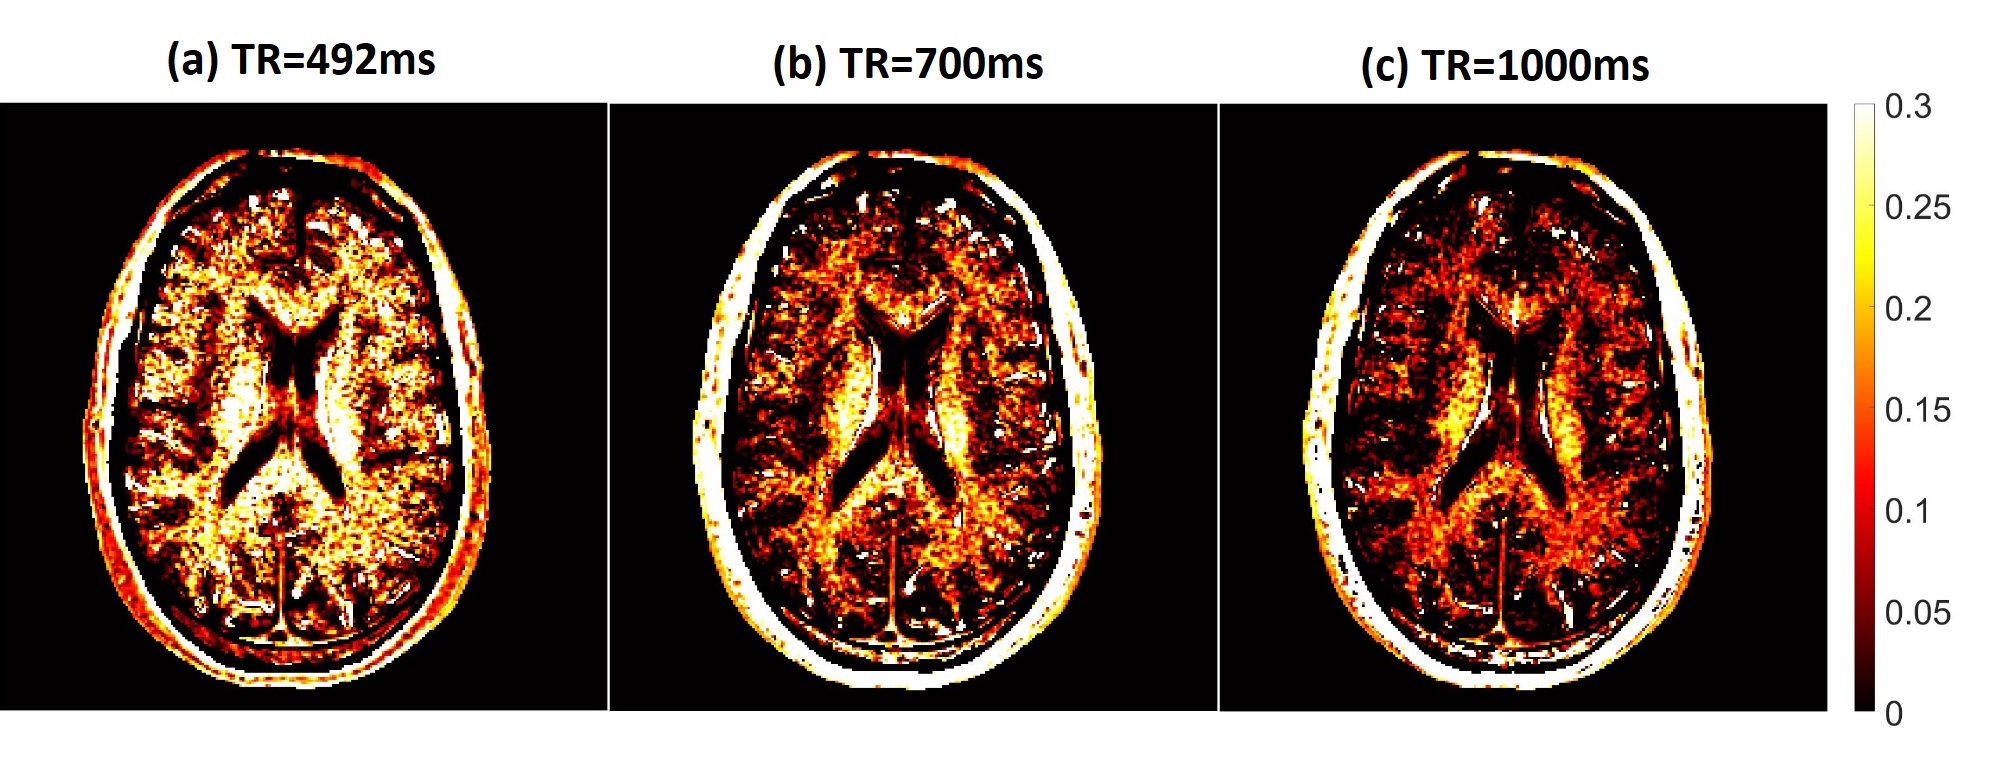
Figure 1: Representative MWF maps.
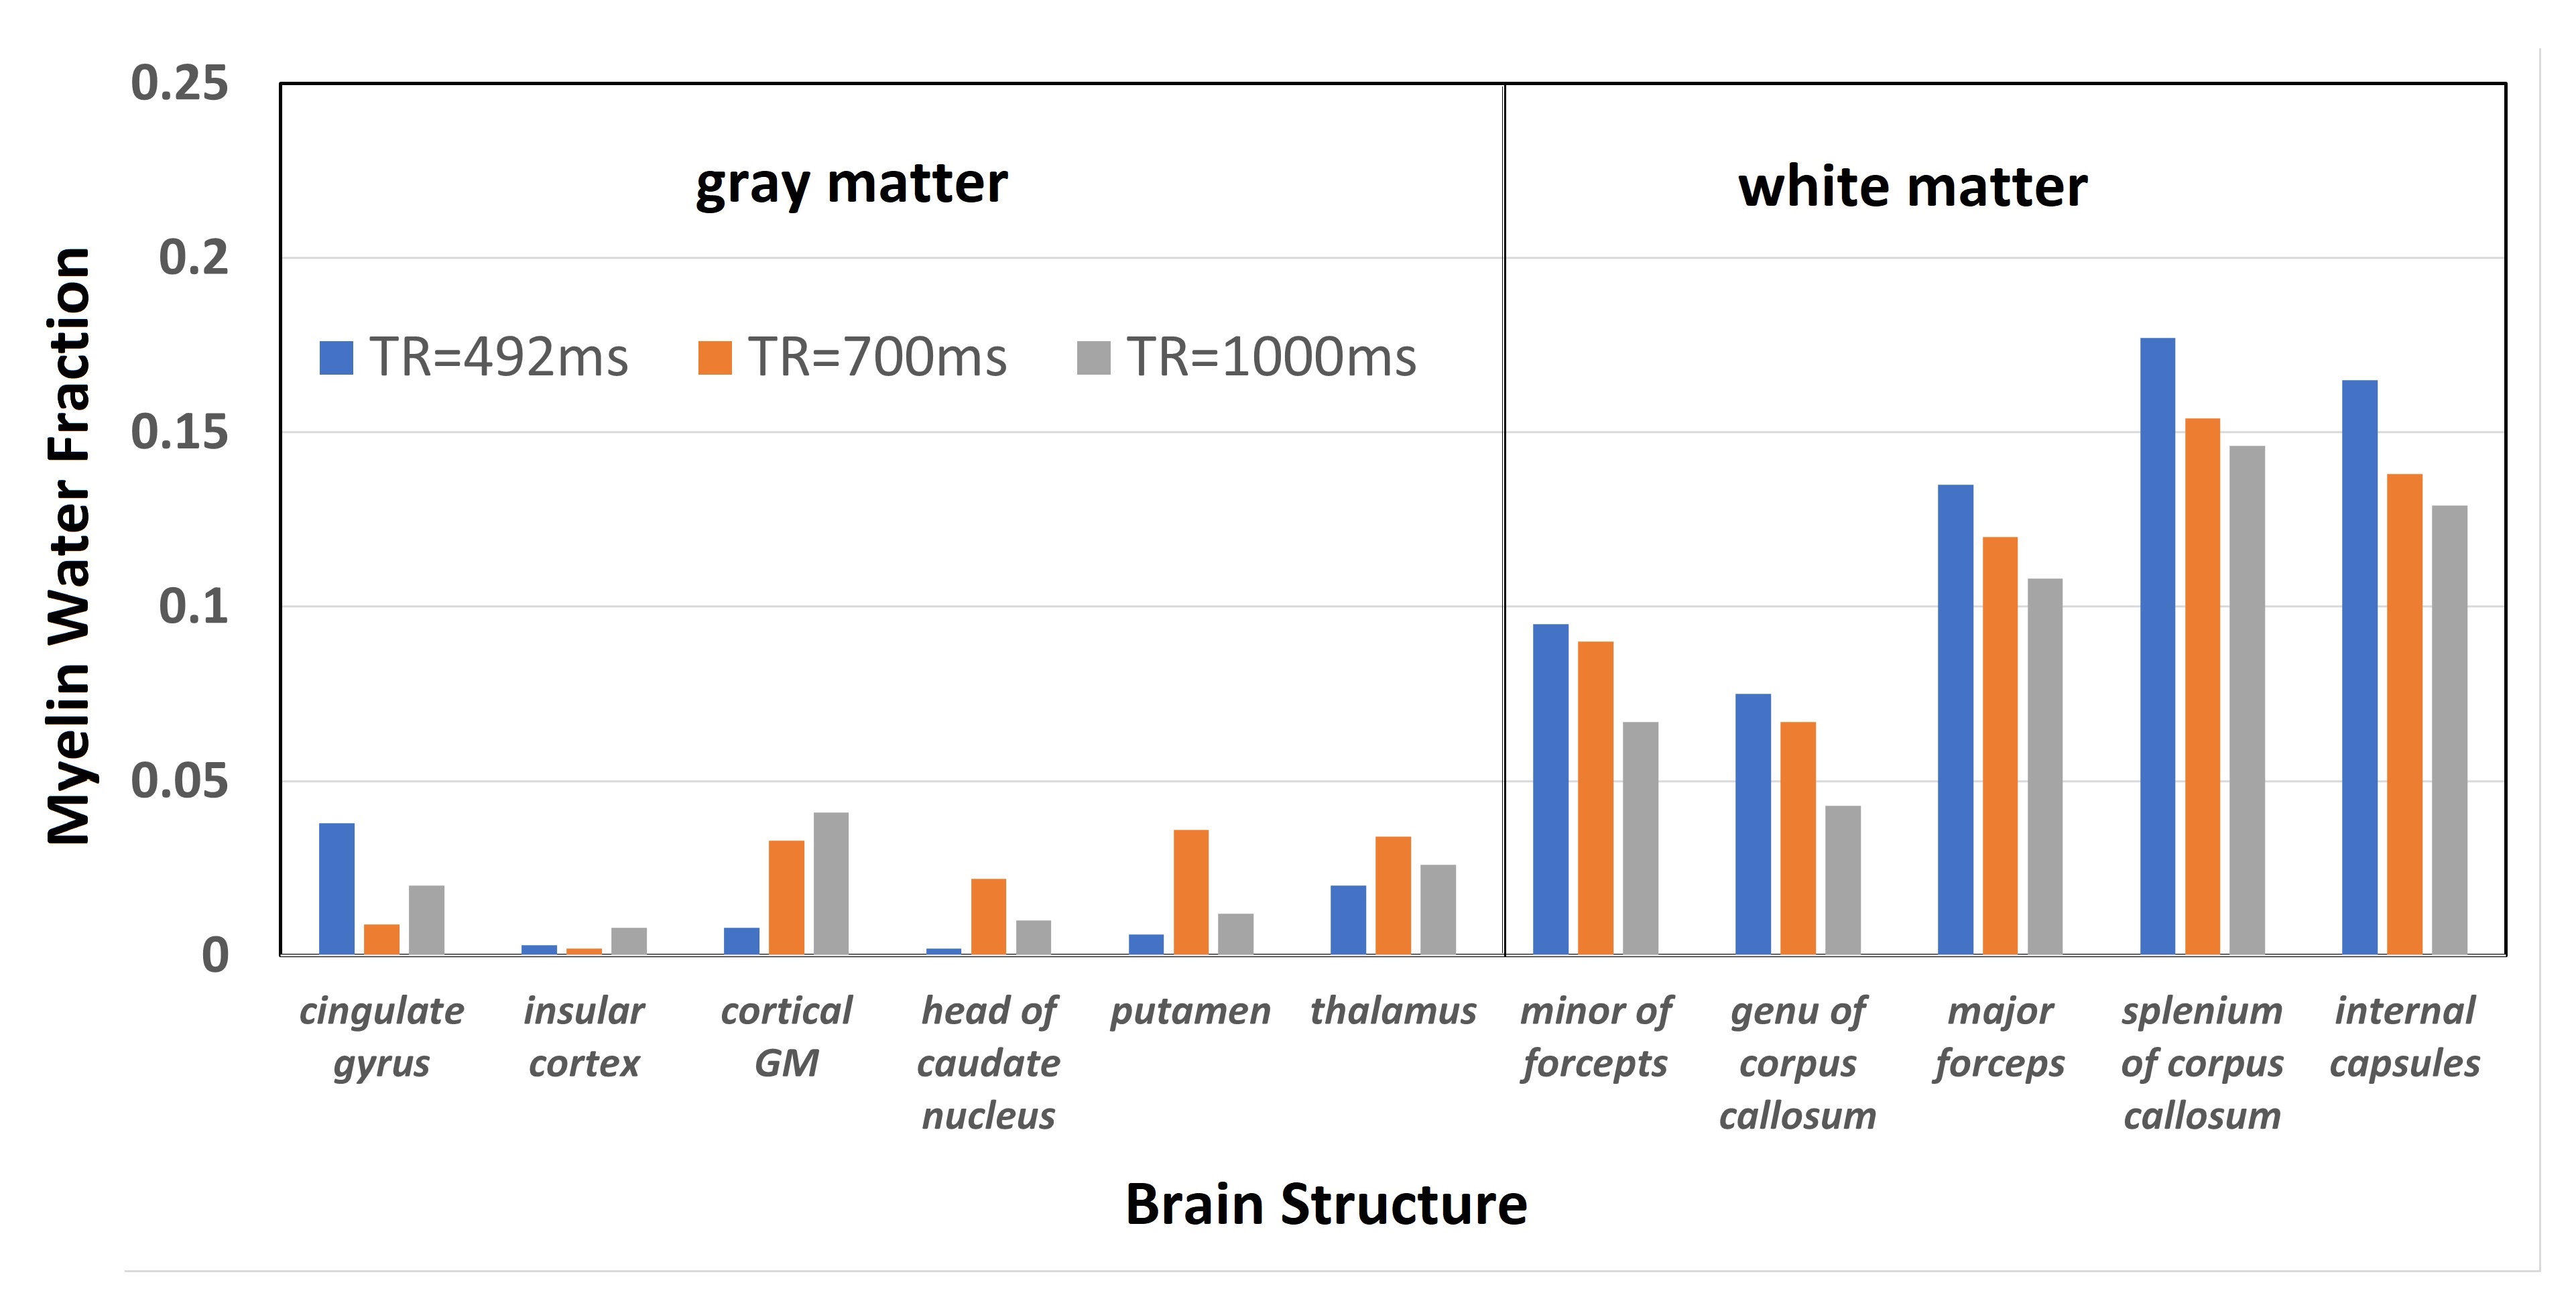
Figure 2: Mean ROI MWF values from different brain structures.