2627
The myelin water imaging transcriptome: myelin water fraction regionally varies with genes associated with oligodendrocytes
Jaimie Lee1,2, Hanwen Liu3, Cornelia Laule2,4,5,6, Catrina Loucks1,7,8, and John Kramer1,2
1Department of Pharmacology, Anesthesiology, and Therapeutics, University of British Columbia, Vancouver, BC, Canada, 2International Collaboration on Repair Discoveries, Vancouver, BC, Canada, 3Department of Medicine, University of British Columbia, Vancouver, BC, Canada, 4Department of Radiology, University of British Columbia, Vancouver, BC, Canada, 5Department of Pathology and Laboratory Medicine, University of British Columbia, Vancouver, BC, Canada, 6Department of Physics and Astronomy, University of British Columbia, Vancouver, BC, Canada, 7Division of Translational Therapeutics, Department of Pediatrics, University of British Columbia, Vancouver, BC, Canada, 8BC Children's Hospital Research Institute, Vancouver, BC, Canada
1Department of Pharmacology, Anesthesiology, and Therapeutics, University of British Columbia, Vancouver, BC, Canada, 2International Collaboration on Repair Discoveries, Vancouver, BC, Canada, 3Department of Medicine, University of British Columbia, Vancouver, BC, Canada, 4Department of Radiology, University of British Columbia, Vancouver, BC, Canada, 5Department of Pathology and Laboratory Medicine, University of British Columbia, Vancouver, BC, Canada, 6Department of Physics and Astronomy, University of British Columbia, Vancouver, BC, Canada, 7Division of Translational Therapeutics, Department of Pediatrics, University of British Columbia, Vancouver, BC, Canada, 8BC Children's Hospital Research Institute, Vancouver, BC, Canada
Synopsis
Keywords: White Matter, Relaxometry, myelin, transcriptome, myelin water fraction, myelin water imaging, gene expression, microstructure
Our objective for this study was to determine the relationship between regional variations in myelin water imaging (MWI) and gene expression – a “MWI transcriptome”. Regional variations in myelin water fraction (MWF) from a normative MWF atlas were examined in a correlation analysis with gene expression data retrieved from the Allen Human Brain Atlas. Genes that significantly covaried with MWF were involved in lipid metabolism and binding, and were enriched for myelin terms (e.g., oligodendrocytes). This preliminary work highlights the utility of an imaging transcriptomic approach and further supports MWI as a robust in vivo measure of myelin.Introduction
Myelin is critical for efficient and rapid nerve impulse transmission in the brain and spinal cord. Myelin contains a high lipid content, and the formation of the myelin sheath by oligodendrocytes requires high levels of fatty acid and lipid synthesis.1 Sensitive and specific measures that can detect myelin are instrumental in characterizing microstructural changes that occur in many neurological conditions, including multiple sclerosis and spinal cord injury.2 Among available MRI techniques, the myelin water imaging (MWI) derived myelin water fraction (MWF) has undergone extensive investigation and post-mortem validation.3 Neuroimaging transcriptomics has emerged as a novel approach to elucidate the molecular underpinnings of quantitative MRI outcomes.4 The basic concept of neuroimaging transcriptomics is that gene expression regionally covarying with a specific MRI metric reflects the underlying anatomy and function of that neuroimaging metric and consequently identifies important genes that may contribute to that metric. The objective of our study was to apply the concepts of neuroimaging transcriptomics to MWI using publicly available MWF and human brain gene expression atlases.5,6 We hypothesized that regional variations in MWF in the brain would covary with the expression of genes related to myelin.Methods
Magnetic resonance imaging: MRI data from an MWF brain atlas was used for our study.5 The atlas is comprised of 50 healthy subjects (25M/25F, mean age 25yrs, range: 17-42yrs) that were scanned at 3T using an 8-channel phase-array head coil (Achieva, Philips, Best, The Netherlands). Data included myelin water imaging (3D gradient and spin echo (GRASE), 32-echo, TE/TR=10/1000ms, slices=40, reconstruction resolution=1x1x2.5mm3) and a 3DT1 whole brain turbo field echo (flip angle=6°, TE/TR=3.7/7.4ms, slices=160, resolution=1x1x1mm3).Myelin water fraction: For the MWF atlas, voxel-wise T2 distributions were calculated using non-negative least squares with the stimulated echo correction.7,8 MWF was defined as the fractional signal with T2 < 40ms. Each participant’s MWF map was first registered to their corresponding 3DT1 space, and subsequently warped to the standard 1mm MNI152 space. The warped MWF map averaged across all participants in the standard space can be seen in Figure 1. MWF for each subject was extracted from 11 regions of interest (ROI) (JHU atlas)9: internal capsule (anterior and posterior), corpus callosum (splenium, genu, and body), forceps (major and minor), putamen, thalamus, hippocampus, and corticospinal tract.
Microarray gene expression: The Allen Human Brain Atlas served as the primary reference for gene expression in the brain.6 The Allen Human Brain Atlas encompasses microarray expression data from 6 healthy adult donors and was analyzed in Python using the abagen toolbox.10,11,12 Gene expression data was extracted from the same 11 ROIs as the MWF.
Statistics: A Pearson correlation coefficient was calculated between the averaged MWF across all subjects and averaged gene expression data, normalized across all 6 brain donors. This process was repeated for all genes captured in our analysis of the Allen Human Brain Atlas.
Gene enrichment: Genes with a significant correlation coefficient (p<0.05) were entered into gene set enrichment analysis using Enrichr.13 Gene set enrichment analysis is a computational method that can be used to determine whether identified genes are more likely to fall within defined sets of genes (e.g., based on well-characterized cellular functions).14 By focusing on gene sets rather than individual genes, this approach better reveals cellular processes that may be associated with outcomes of interest. To report enrichment results, we examined the p-value and adjusted p-value statistics, computed using Fisher's exact test and the Benjamini-Hochberg correction method for multiple hypotheses testing, respectively.15
Results
There was substantial variation in MWF across the 11 ROIs, with highest estimates in the posterior internal capsule and lowest in the putamen and thalamus (Figure 2). Changes across regions were highly consistent between subjects. The expression from a total of 15,633 genes were extracted from Allen Human Brain Atlas and included in our analysis. 723 genes significantly covaried with regional changes in MWF. The top regional correlation was for patatin-like phospholipase domain containing 2 (PNPLA2, r=0.90, p=0.00018, Figure 3). Gene set enrichment analysis identified significant enrichment for myelin-related terms, including ‘oligodendrocytes’ (Table 1).Discussion
Our results provide insight into the molecular basis of MWI and further support MWF as a specific biomarker of myelin. The top-ranking gene correlate – PNPLA2 – is known to be involved in lipid metabolism, while others are enriched in oligodendrocytes and critically involved in lipid binding (e.g., WD repeat and FYVE domain containing 3, WDFY3). Gene set enrichment provided several supporting and converging lines of evidence that MWF regionally varied with genes associated with oligodendrocytes. Future analyses should embrace a hypothesis-driven approach, starting with genes previously associated with myelin-related clinical outcomes and examining whether they significantly correlate with regional variations in MWF.Conclusion
Regional variations in MWF correspond with genes associated with oligodendrocytes, lending further support to MWF as a specific marker of myelin in the central nervous system. These results provide molecular evidence that MWI is a robust tool for monitoring diseases affecting oligodendrocytes in humans.Acknowledgements
We thank the study participants and MRI technologists at the UBC MRI Research Centre who contributed to making the MWF atlas, and the Allen Institute for making the Allen Brain Atlas available. Dr. Liu is supported by the Michael Smith Health Research BC’s Research Trainee Program. Dr. Loucks is supported by a BC Children’s Hospital Research Institute Investigator Establishment Award. Drs. Kramer and Laule are supported by NSERC Discovery grants.References
- Poitelon Y, Kopec AM, Belin S. Myelin Fat Facts: An Overview of Lipids and Fatty Acid Metabolism. Cells. 2020; 9(4):812.
- Love S. Demyelinating diseases. J Clin Pathol. 2006; 59(11):1151-1159.
- MacKay AL, Laule C. Magnetic Resonance of Myelin Water: An in vivo Marker for Myelin. Brain Plast. 2016; 2(1):71-91.
- Martins D, Giacomel A, Williams SCR, et al. Imaging transcriptomics: Convergent cellular, transcriptomic, and molecular neuroimaging signatures in the healthy adult human brain. Cell Rep. 2021; 37(13):110173.
- Liu H, Rubino C, Dvorak AV, et al. Myelin Water Atlas: A Template for Myelin Distribution in the Brain. J Neuroimaging. 2019; 29(6):699-709.
- Sunkin SM, Ng L, Lau C, et al. Allen Brain Atlas: an integrated spatio-temporal portal for exploring the central nervous system. Nucleic Acids Res 2013; 41(Database issue):D996-D1008.
- Whittall KP and MacKay AL. Quantitative interpretation of NMR relaxation data. J Magn Reson. 1989; 84:134-152.
- Prasloski T, Mädler B, Xiang Q-S, et al. Applications of stimulated echo correction to multicomponent T2 analysis. Magn Reson Med. 2012; 67:1803–1814.
- Eickhoff SB, Stephan KE, Mohlberg H, et al. A new SPM toolbox for combining probabilistic cytoarchitectonic maps and functional imaging data. Neuroimage. 2005; 25(4):1325-1335.
- Markello RD, Arnatkevic̆iūtė A, Poline J-B, et al. Standardizing workflows in imaging transcriptomics with the abagen toolbox. Elife. 2021; 10:e72129.
- Arnatkevic̆iūtė A, Fulcher BD, Fornito A. A practical guide to linking brain-wide gene expression and neuroimaging data. NeuroImage. 2019; 189:353-367.
- Hawrylycz MJ, Lein ES, Guillozet-Bongaarts AL, et al. An anatomically comprehensive atlas of the adult human brain transcriptome. Nature. 2012; 489:391–399.
- Chen EY, Tan CM, Kou Y, et al. Enrichr: interactive and collaborative HTML5 gene list enrichment analysis tool. BMC Bioinformatics 2013; 14:128.
- Subramanian A, Tamayo P, Mootha VK, et al. Gene set enrichment analysis: A knowledge-based approach for interpreting genome-wide expression profiles. Proc Natl Acad Sci USA. 2005; 102(43):15545-50.
- Benjamini Y and Hochberg Y. Controlling the False Discovery Rate: A Practical and Powerful Approach to Multiple Testing. J R Stat Soc Ser B Methodol. 1995; 57(1):289-300.
Figures
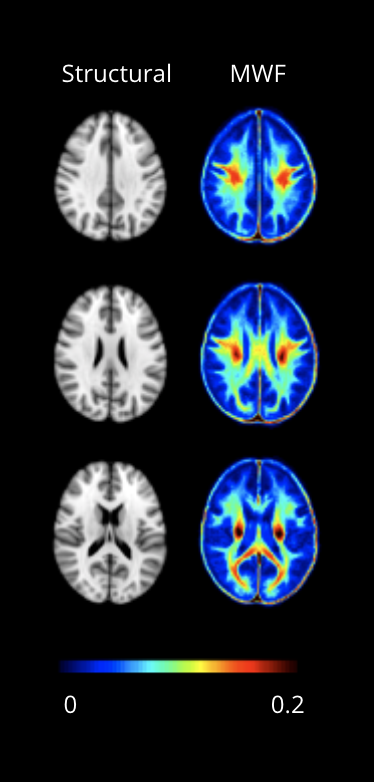
Figure 1. Myelin water imaging brain atlas. Structural T1 in MNI152 standard-space and corresponding MWF maps (adapted from Fig 2 in Liu et al).5
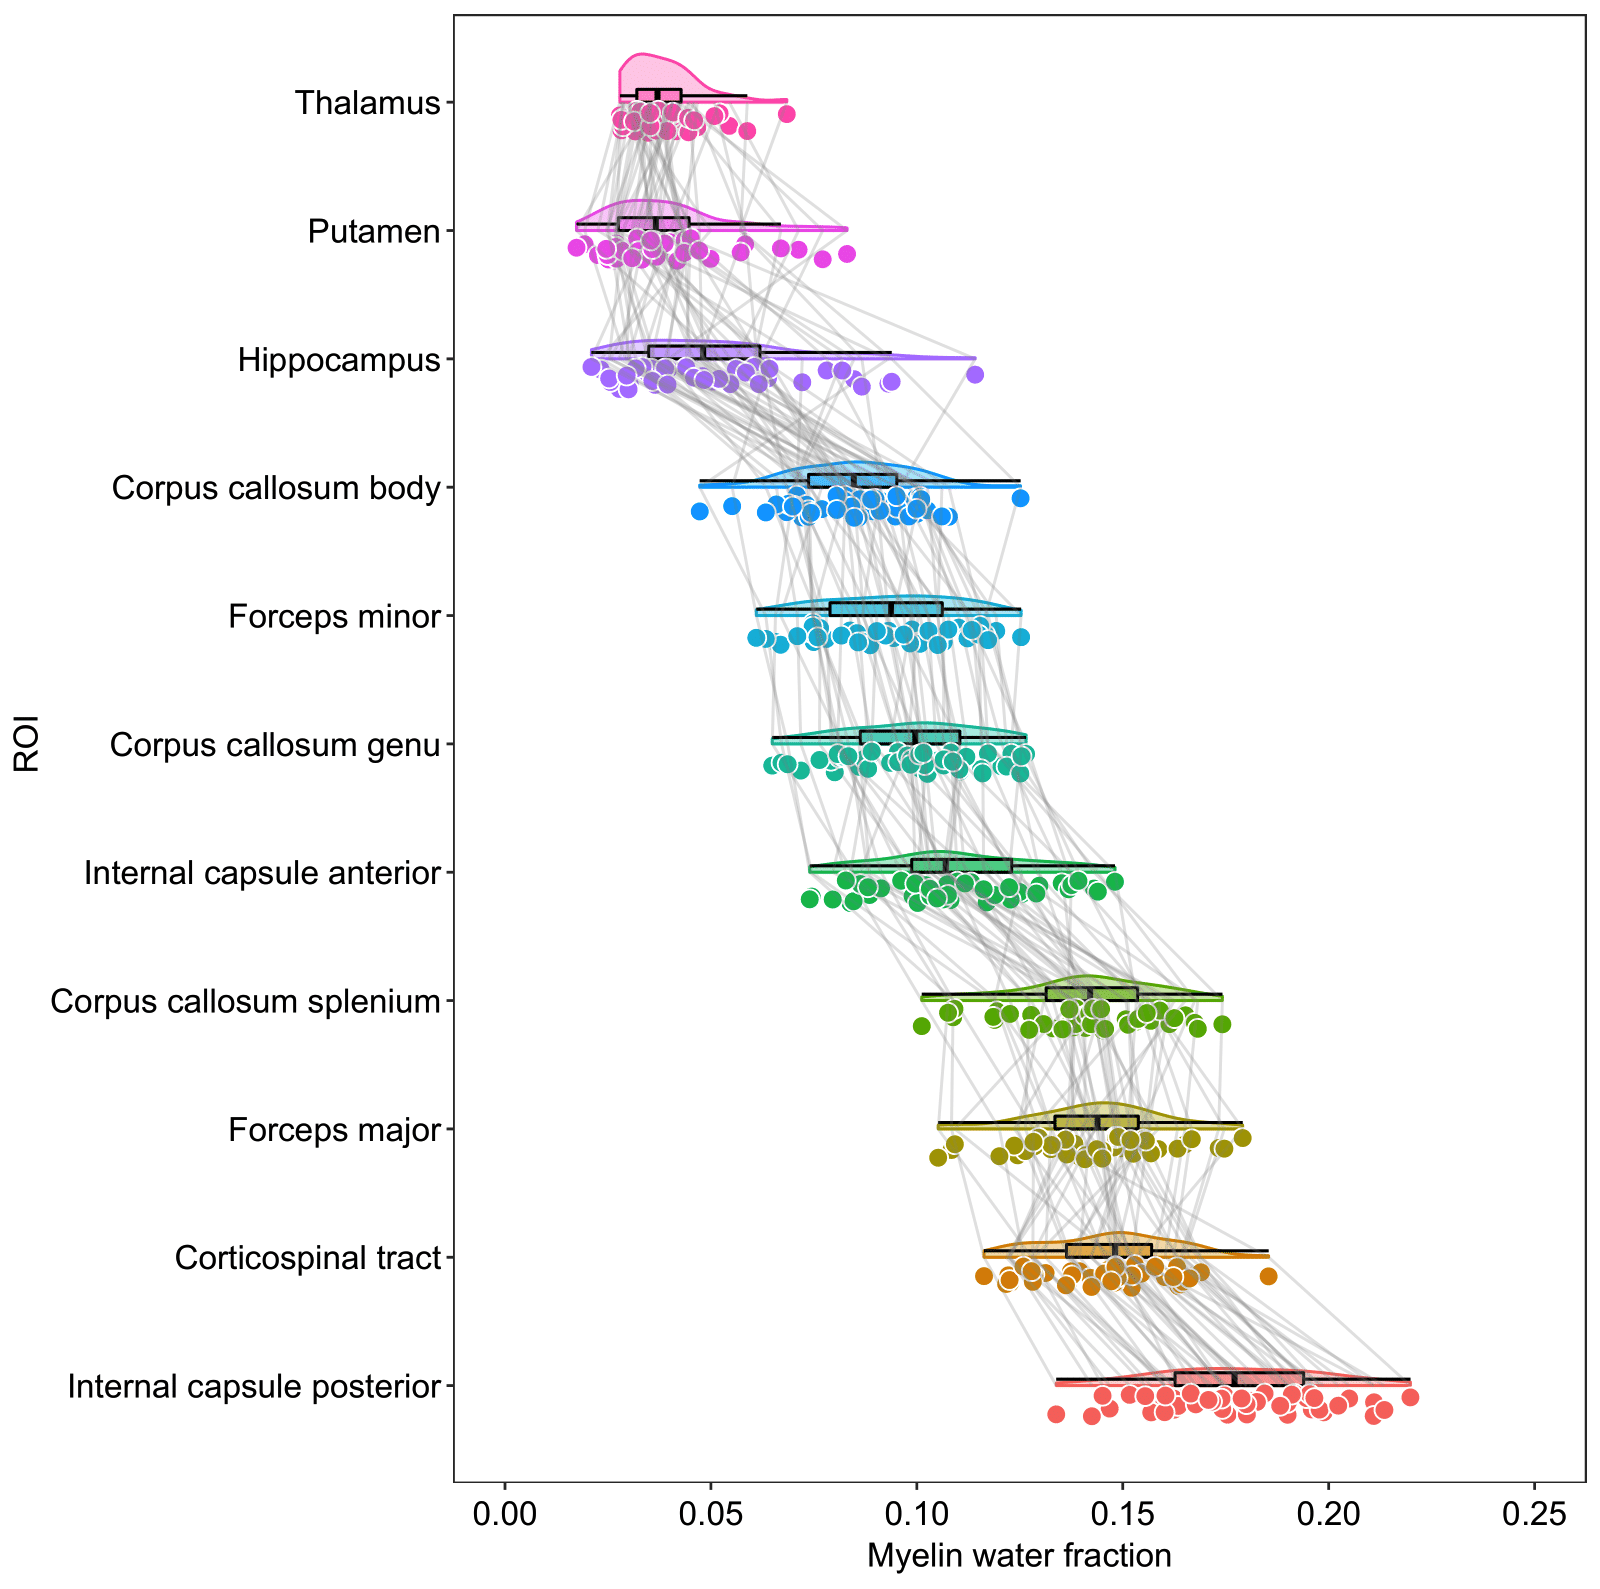
Figure 2. Distribution of MWF across 11 brain ROIs. A raincloud plot consisting of a violin, boxplot, and jittered dataset are presented for each ROI. Grey lines connect MWF estimates between each ROI per subject.
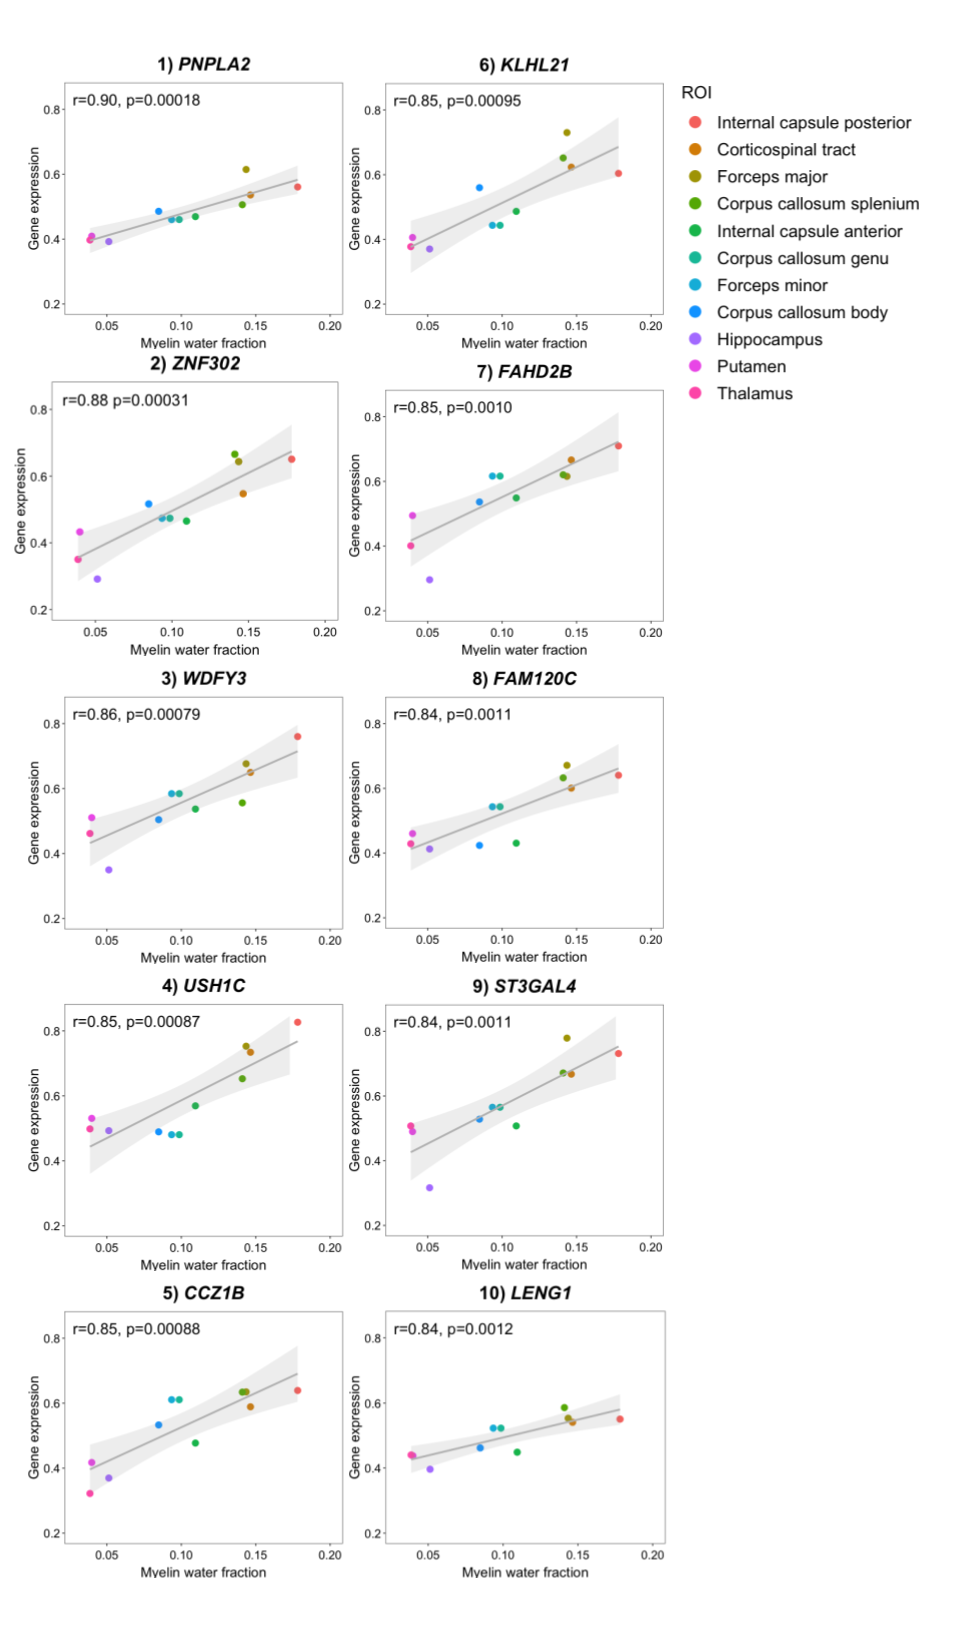
Figure 3. Relationship between MWF and gene expression. A Pearson correlation coefficient was calculated between the averaged MWF for each of the 11 ROIs across in the MWF atlas and averaged gene expression data from those same 11 ROIs that was normalized across brain donors, for each of the 15,633 genes provided by Allan Human Brain Atlas. The relationship between MWF and gene expression for the top 10 genes with highest correlation coefficients are shown. The standard error is shaded in grey.
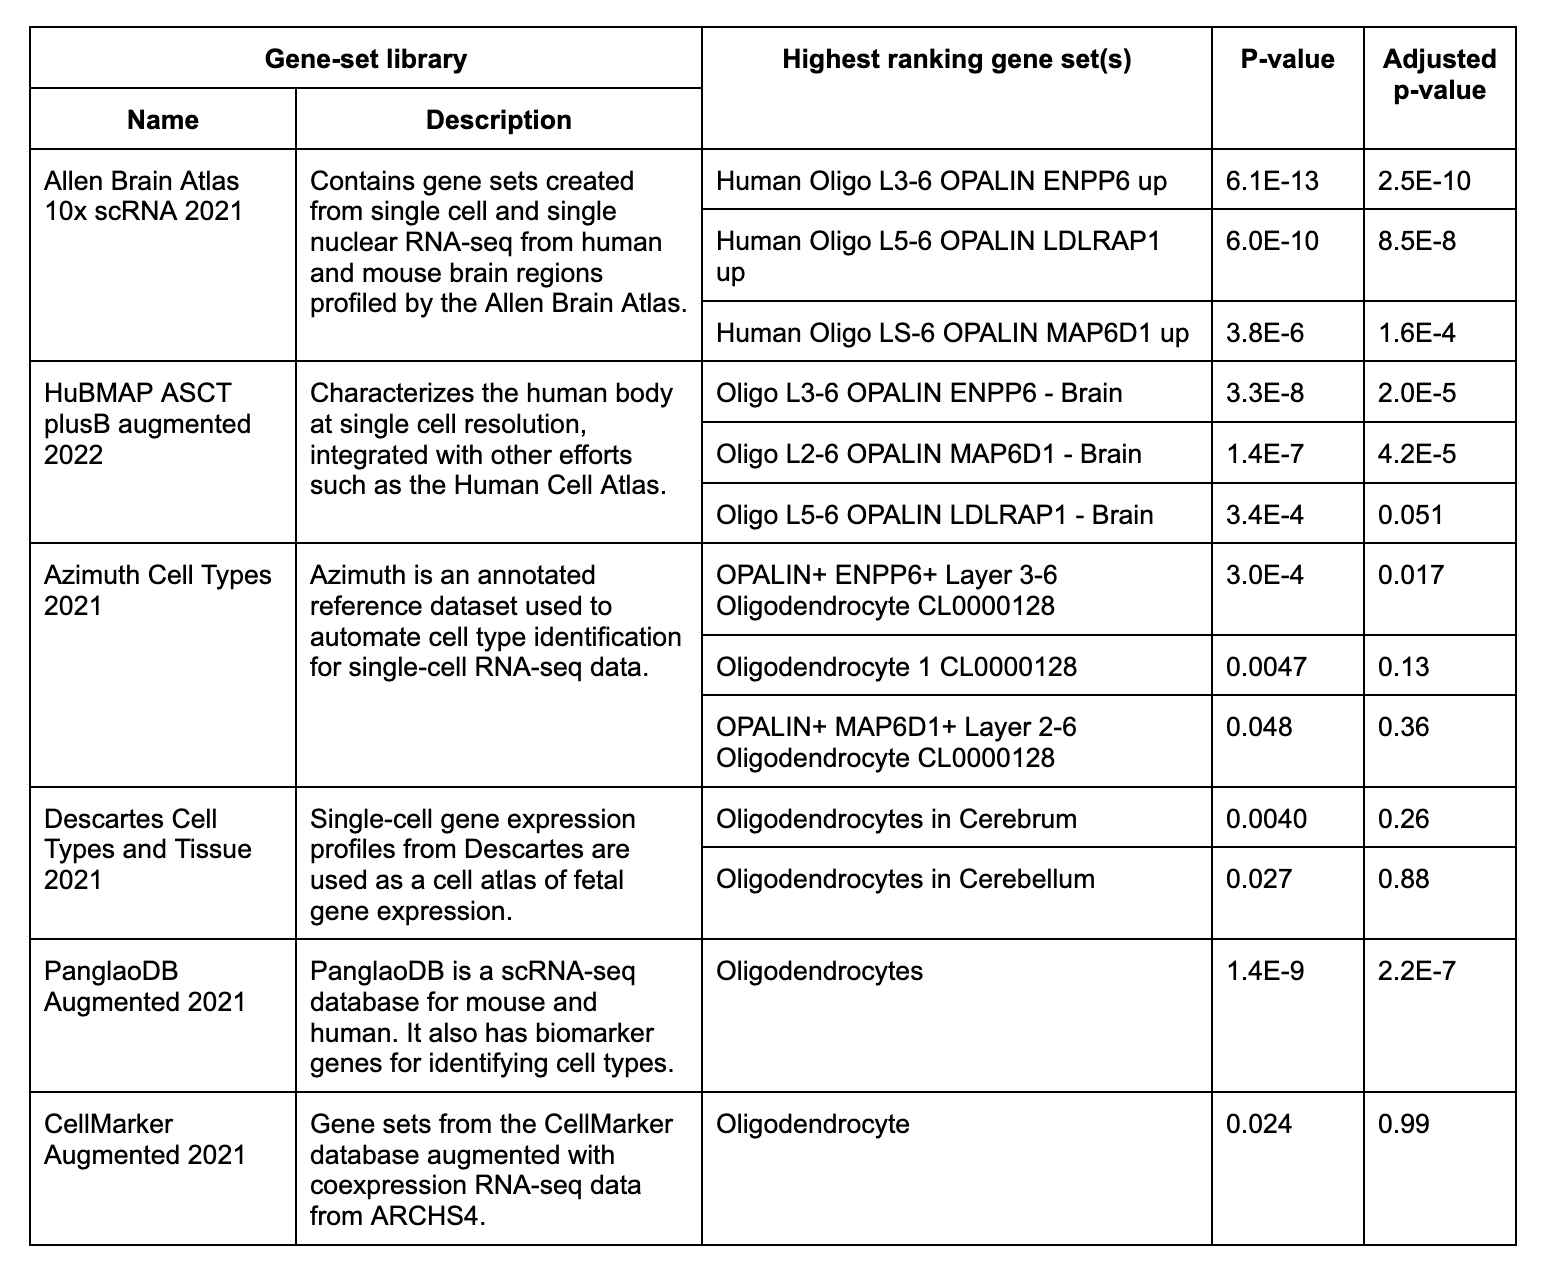
Table 1. Summary of gene enrichment analysis. The highest-ranking annotated gene sets classified under ‘Cell Types’ in Enrichr that significantly overlapped with the input set of 723 genes and their respective gene-set library. The p-value and adjusted p-value statistics were computed using Fisher's exact test and the Benjamini-Hochberg correction method for multiple hypotheses testing, respectively.
DOI: https://doi.org/10.58530/2023/2627