2623
Longitudinal quantitative MRI changes in normal-appearing brain tissue of patients with multiple sclerosis1Translational Imaging in Neurology (ThINK) Basel, Department of Biomedical Engineering, University Hospital Basel and University of Basel, Basel, Switzerland, 2Department of Neurology, University Hospital Basel, Basel, Switzerland, 3Research Center for Clinical Neuroimmunology and Neuroscience Basel (RC2NB), University Hospital Basel and University of Basel, Basel, Switzerland, 4Division of Radiological Physics, Department of Radiology, University Hospital Basel, Basel, Switzerland, 5Laboratory for Research in Neuroimaging, Department of Clinical Neuroscience, Lausanne University Hospital and University of Lausanne, Lausanne, Switzerland, 6Department of Radiology, Weill Cornell Medical College, New York, NY, United States
Synopsis
Keywords: Multiple Sclerosis, Quantitative Imaging
We explored the value of multiple longitudinal quantitative MRI (qMRI) measures in detecting microstructural changes occurring in normal-appearing tissue of patients with multiple sclerosis (PwMS). While no differences in qMRI longitudinal changes were measured between PwMS and healthy controls, progressive PwMS showed accelerated T1-relaxometry increase in normal-appearing tissue with respect to both healthy controls and relapsing-remitting PwMS, reflecting increased micro/macrostructural damage. In PwMS the rates of qMRI changes during follow-up were associated with the severity of clinical disability, with higher neurological impairment being associated with qMRI changes reflecting accelerated micro/macrostructural damage, demyelination, and axon/dendrite loss.Introduction
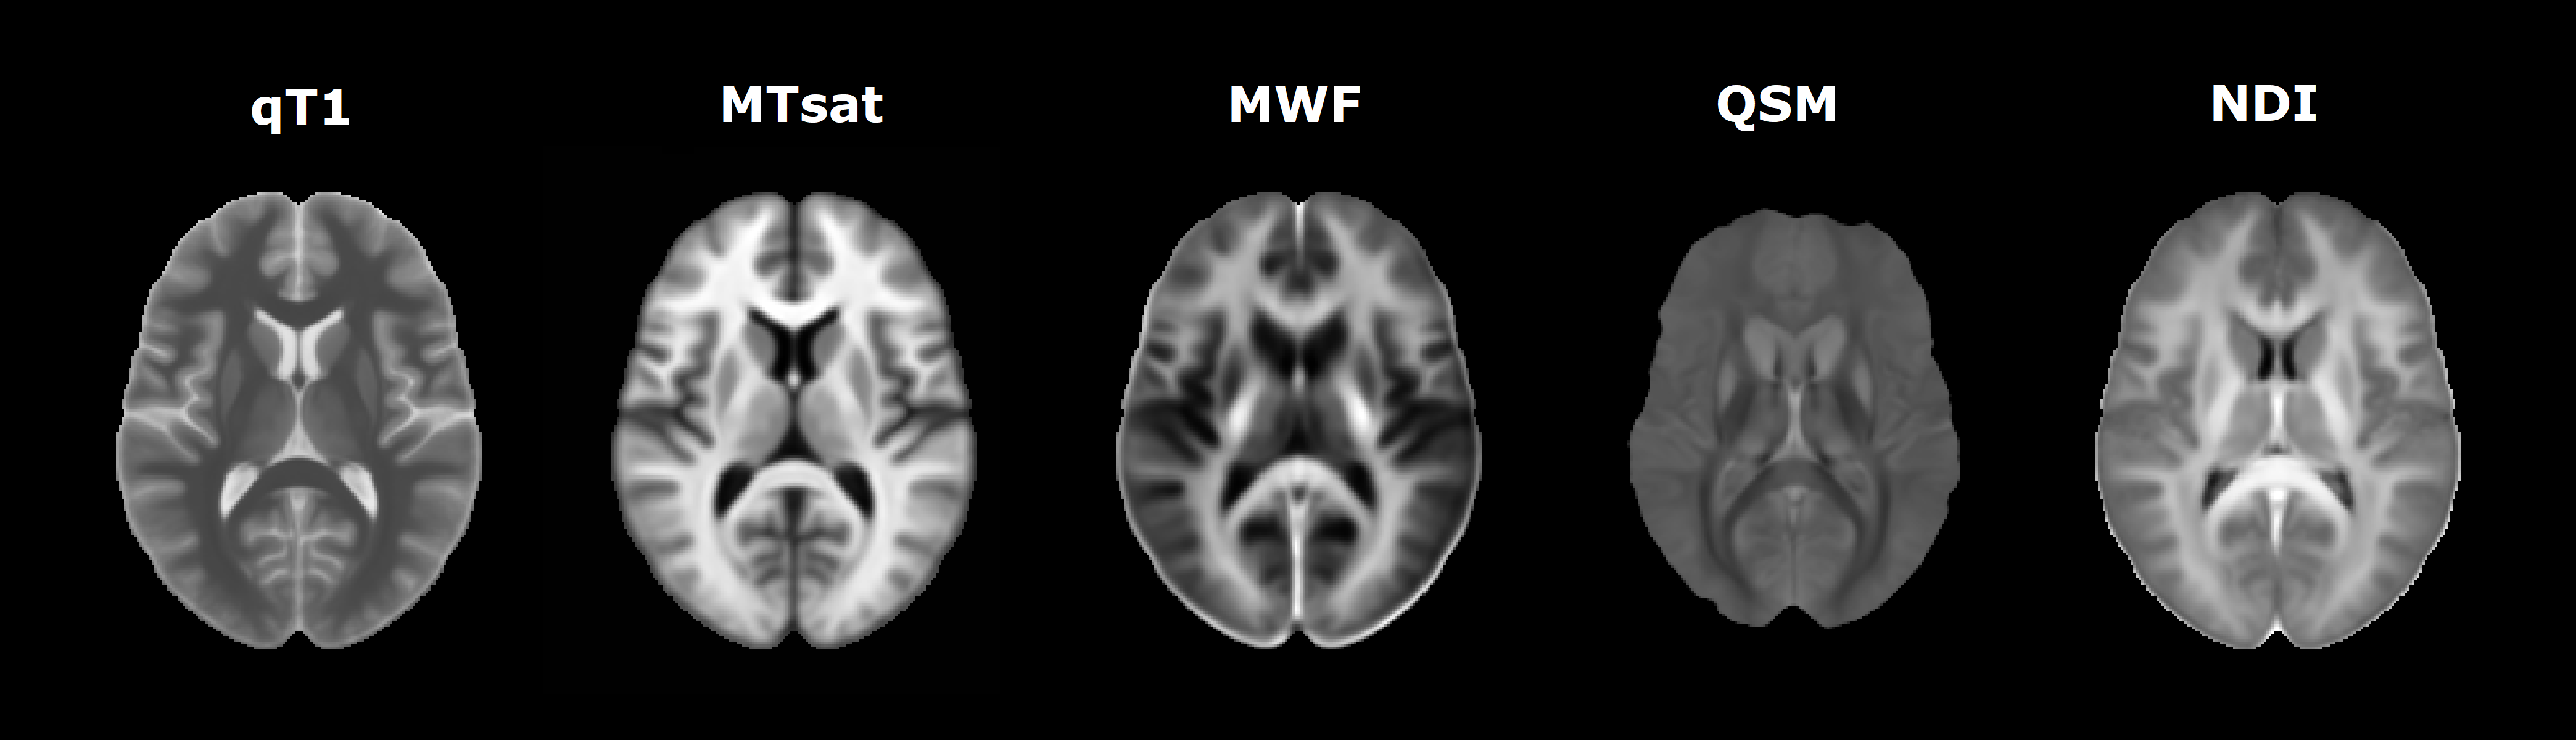
Multiple sclerosis (MS) is a chronic disease of the central nervous system characterized by a complex interplay between inflammatory, demyelinating, and neurodegenerative processes.(1) Despite MS lesions represent the diagnostic hallmark of the disease, correlation between lesion burden and clinical findings is generally weak.(2) Indeed, substantial contribution to clinical disability is also attributable to diffuse, heterogeneous pathological changes occurring in the normal-appearing tissue.(3) By providing biophysical markers of microstructural integrity, quantitative MRI (qMRI) enables the in vivo characterization of tissue damage.(4) The aim of the study was to investigate longitudinal changes of multiple qMRI measures in normal-appearing tissue of patients with multiple sclerosis (PwMS), and to explore their association with clinical measures. As qMRI of interest we included: 1) T1-relaxometry (qT1); 2) magnetization transfer saturation (MTsat); 3) myelin water fraction (MWF); 4) quantitative susceptibility mapping (QSM); and 5) neurite density index (NDI), representing surrogate measures of micro/macrostructural tissue integrity, macromolecular integrity, myelin content, iron content, and axon/dendrite density, respectively.(4) Figure1Methods
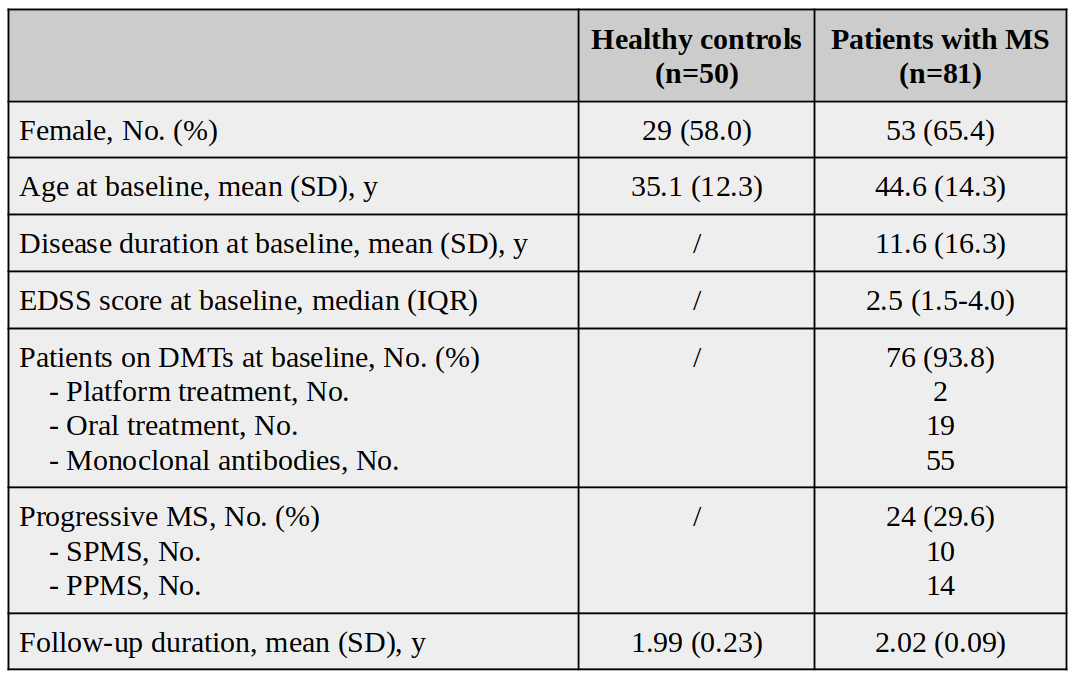
From an ongoing prospective study we included 50 healthy controls (HCs) and 81 PwMS having 2-year clinical and MRI follow-up.Table1 All subjects underwent the same MRI protocol, at baseline and after 2 years, on a 3T scanner (Magnetom Prisma, Siemens Helthcare), including: (1) 3D-FLAIR [TR/TE/TI = 5000ms/386ms/1800ms/1x1x1mm3]; (2) 3D-MP2RAGE [TR/TI1/TI2/resolution = 5000ms/700ms/2500ms/1x1x1mm3]; (3) FAST-T2 [spiral TR/TE = 7.5/0.5 ms, six T2prep times=0/7.5/17.5/67.5/147.5/307.5ms, resolution=1.25x1.25x5mm3]; (4) multi-shell diffusion (TR/TE/resolution = 4.5s/75ms/1.8x1.8x1.8mm3; b-values = 0/700/1000/2000/3000s/mm2); (5) 3D-EPI (TR/TE/resolution = 64ms/35ms/0.67×0.67×0.67mm3). T1maps were computed from MP2RAGE;(6) quantitative MTsat images were obtained using three 3D RF spoiled gradient echo acquisitions with predominantly Magnetization Transfer-weighted (MTw:TR/α=25ms/5o), proton density-weighted (PDw:TR/α=5ms/5o) and T1-weighted (T1w:TR/α=11ms/15o) contrast;(7) MWF maps were obtained from FAST-T2;(8) QSM was reconstructed from 3D EPI;(9) NDI was derived with the NODDI model.(10) T2-lesion volume (T2LV) was quantified semi-automatically on FLAIR images; cortical lesions were manually segmented on MP2RAGE. Brain volumes were automatically segmented on MP2RAGE using SAMSEG.(11,12) T2LV and cortical lesions volume were subtracted from the resulting masks to obtain segmentations of normal-appearing white matter (NAWM), normal-appearing deep gray matter (NADGM), and normal-appearing cerebral cortex (NAC). We then extracted mean qMRI values in NAWM (for all contrasts), NADGM (for qT1, MTsat, QSM, and NDI), and NAC (for qT1 and MTsat). Baseline differences in qMRI measures between PwMS and HCs were explored with general linear models, adjusting for age, and sex. Rates of longitudinal qMRI changes were investigated with linear mixed effect models, using qMRI measures at each time point as dependent variables, subjects as random intercept, and time, age, and sex as covariates. Associations between qMRI longitudinal changes and 1) MS subtype, 2) Expanded Disability Status Scale (EDSS), and 3) T2LV change during follow-up were explored by introducing in the above-mentioned models the interaction term between such variables and time. False discovery rate (FDR) approach was used to adjust for multiple comparisons.Results
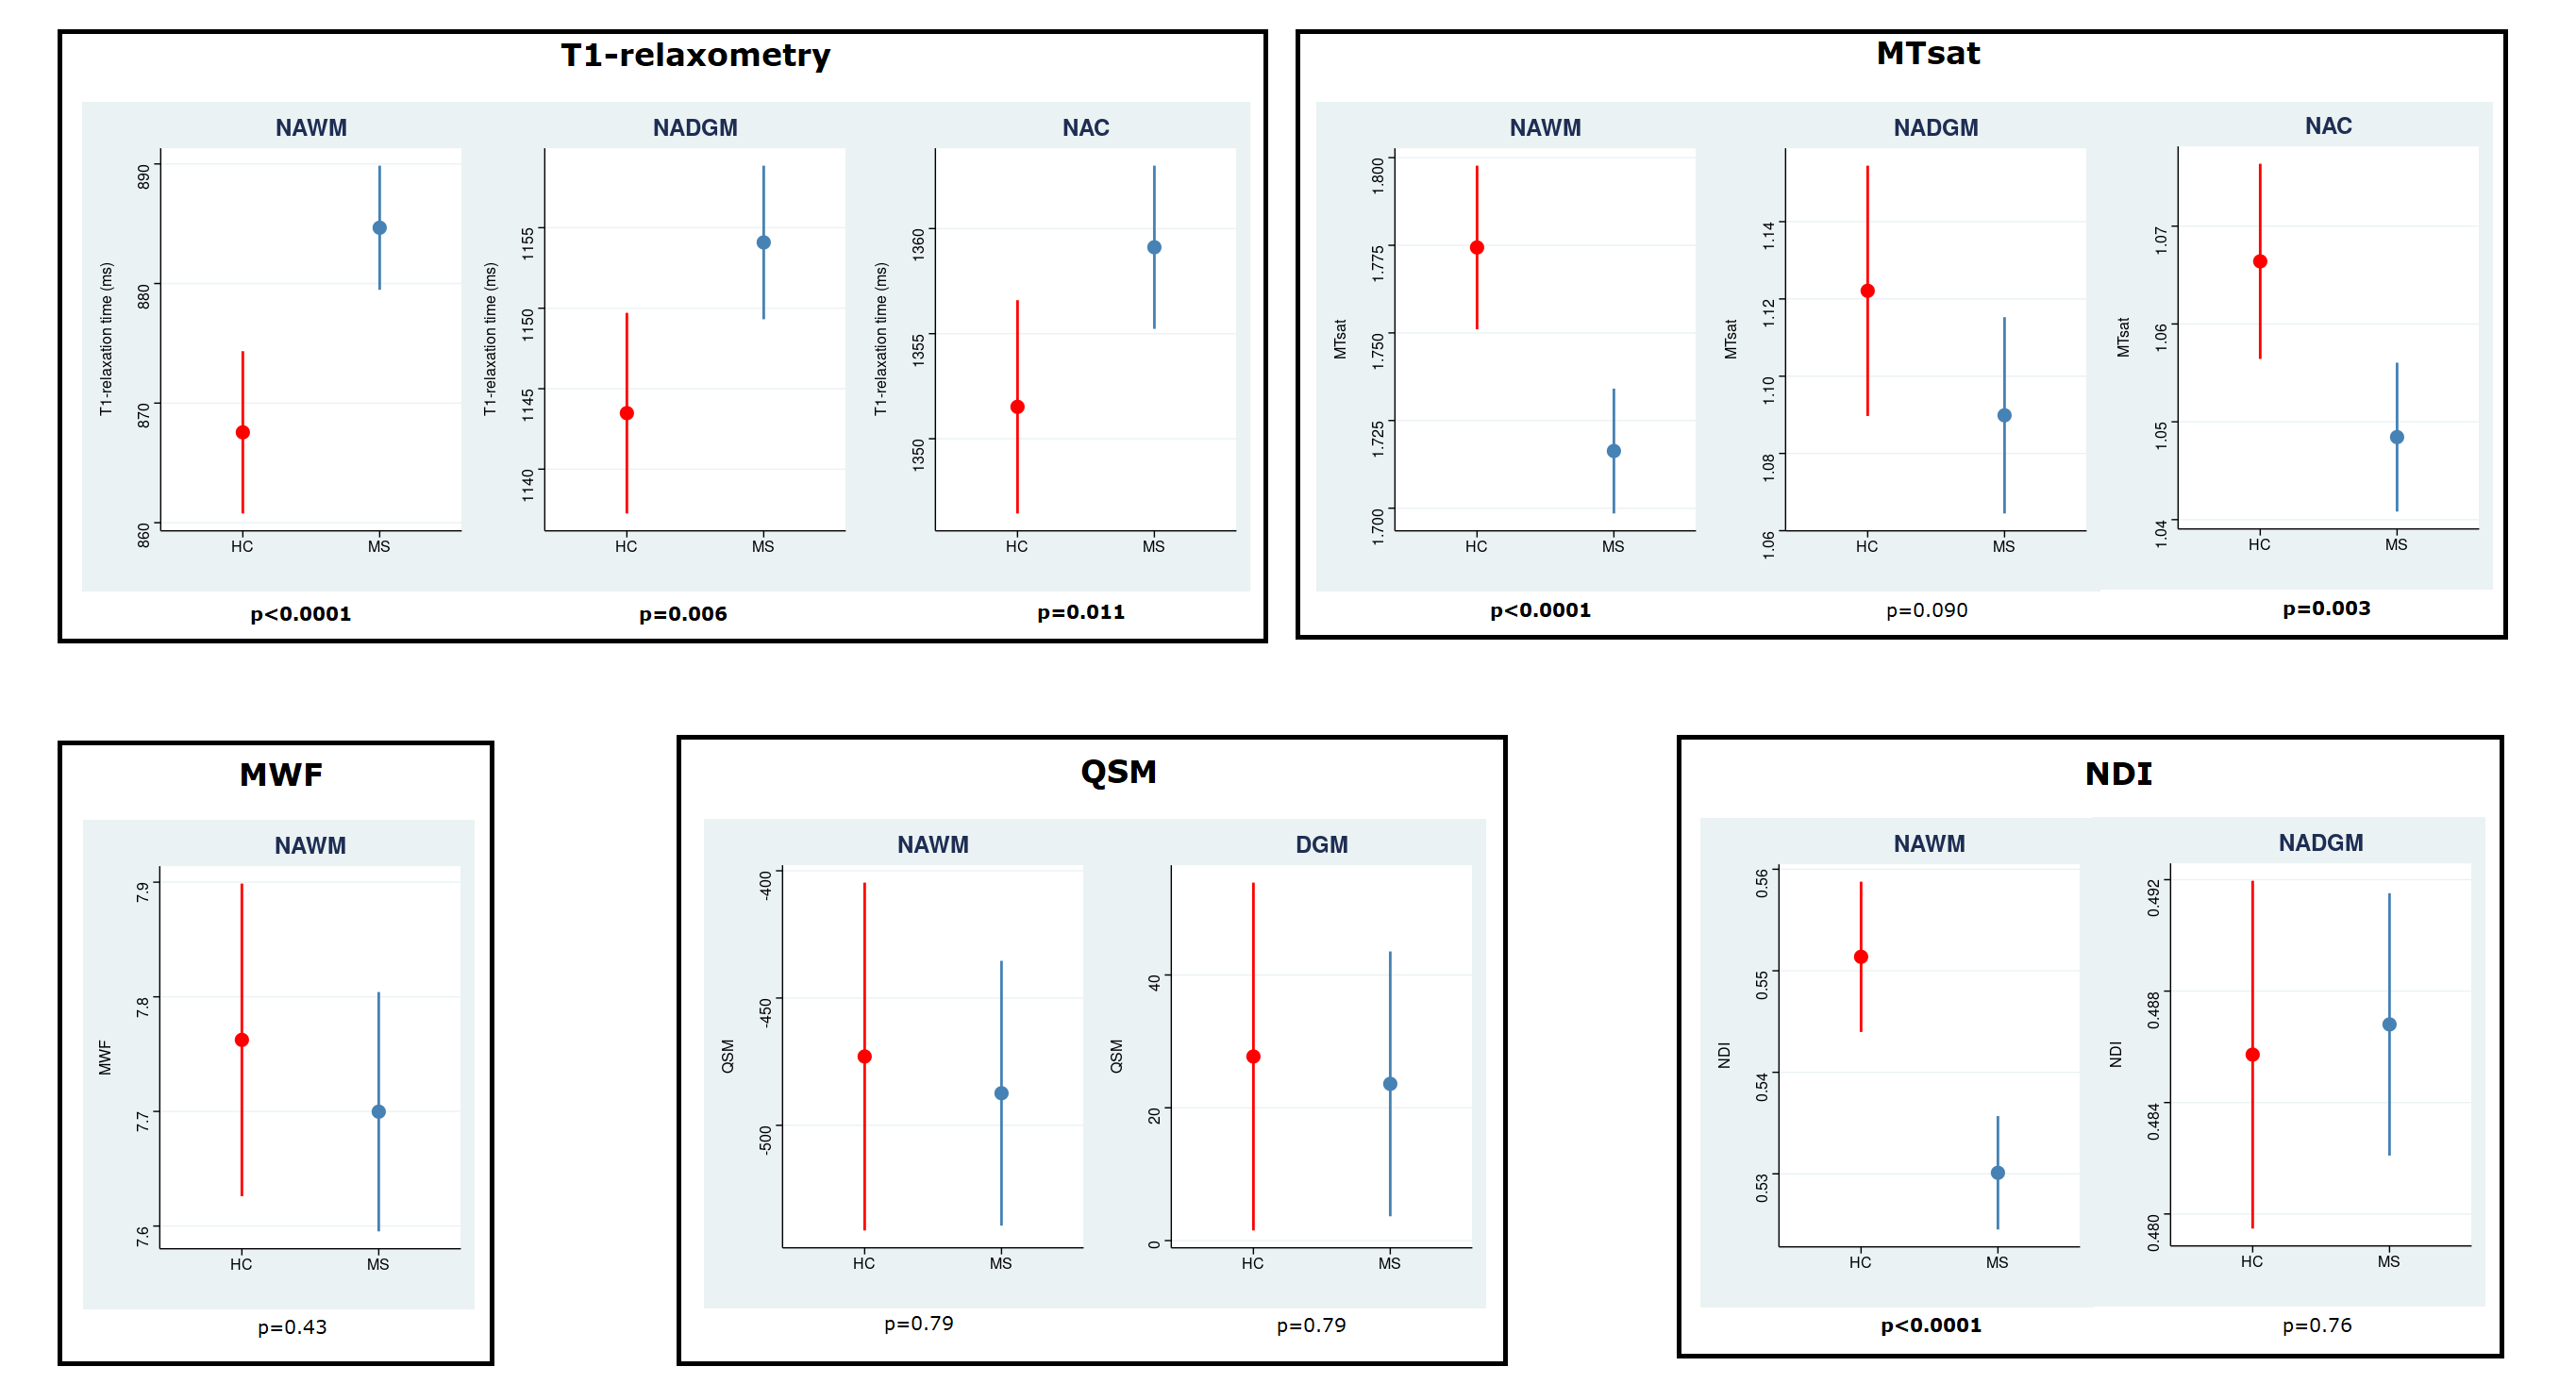
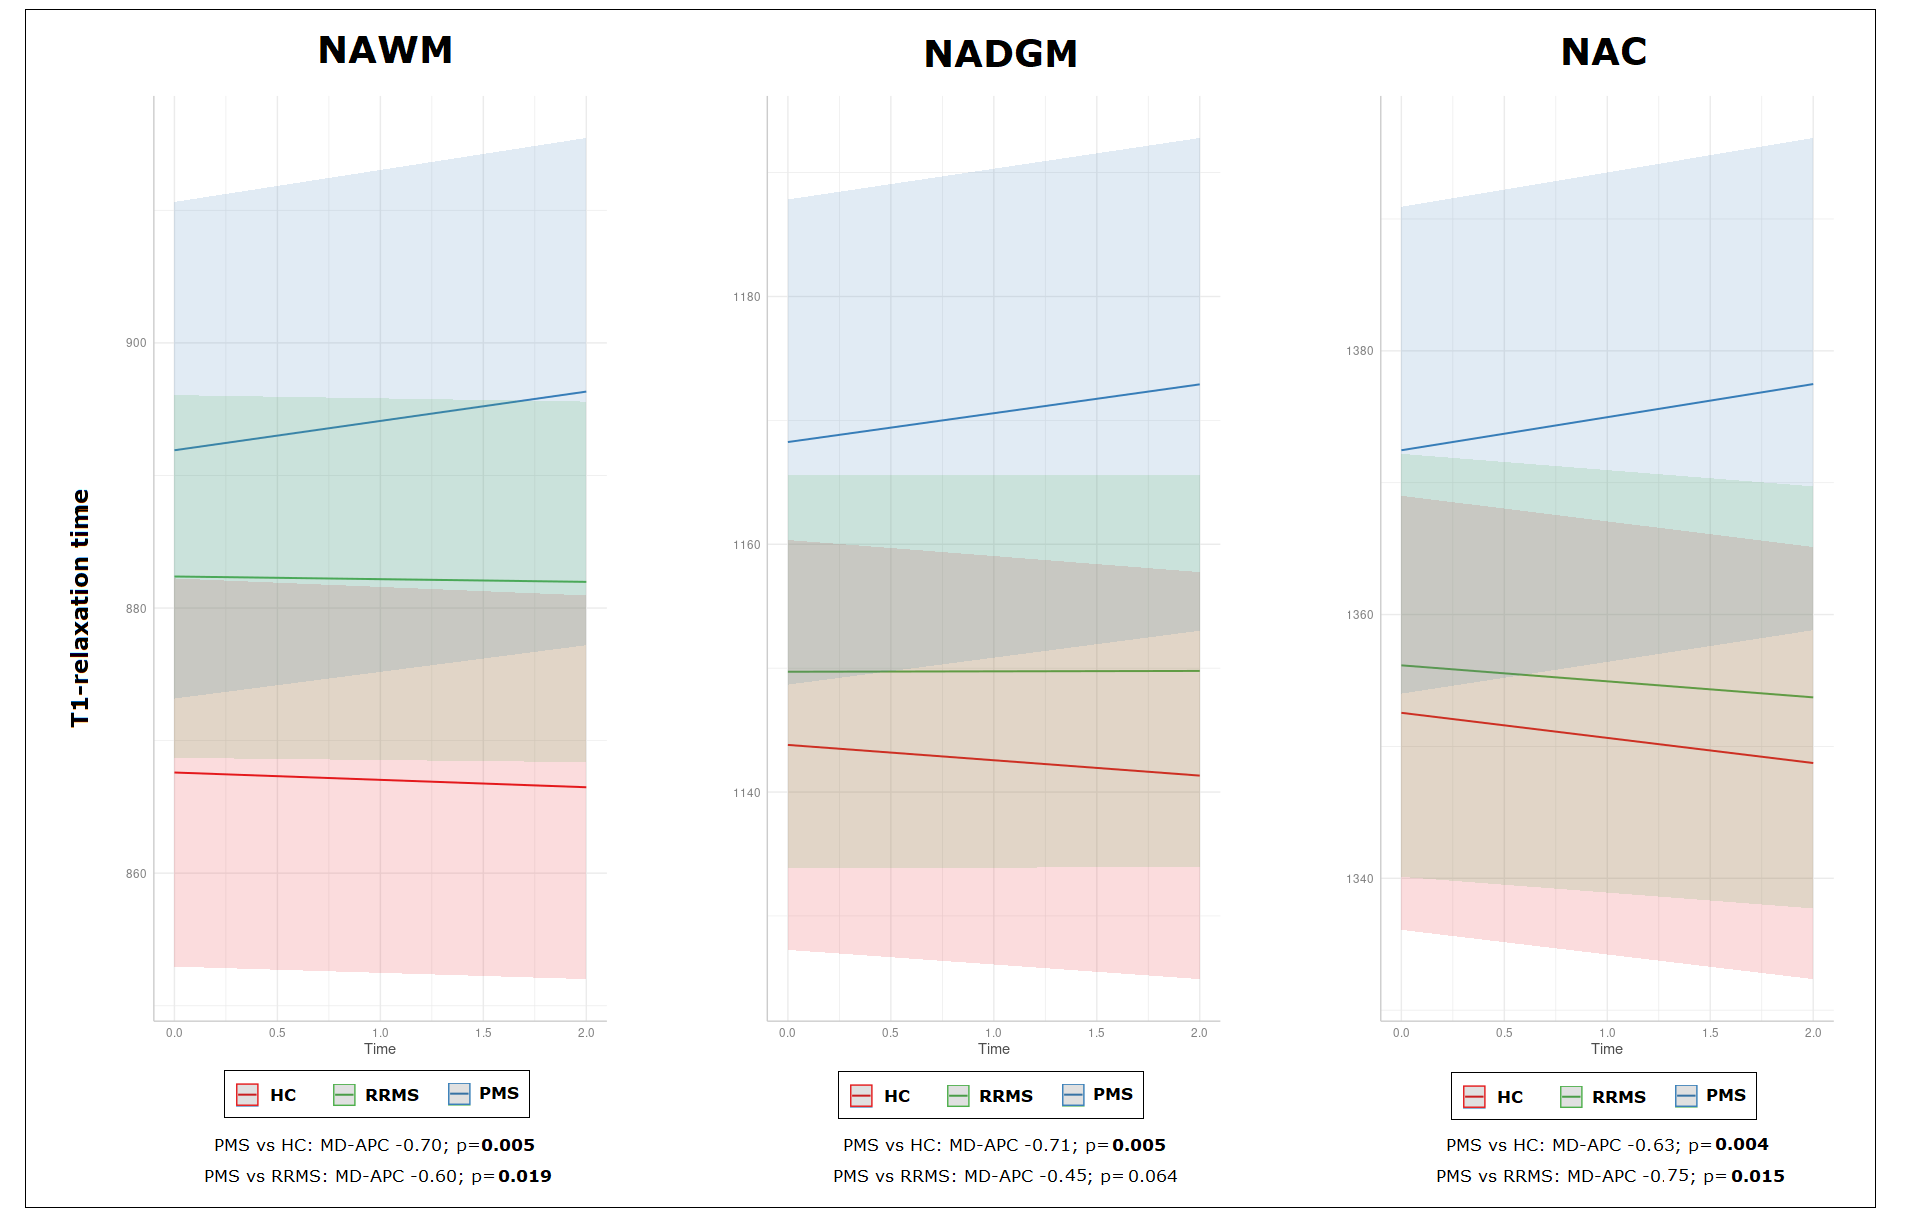
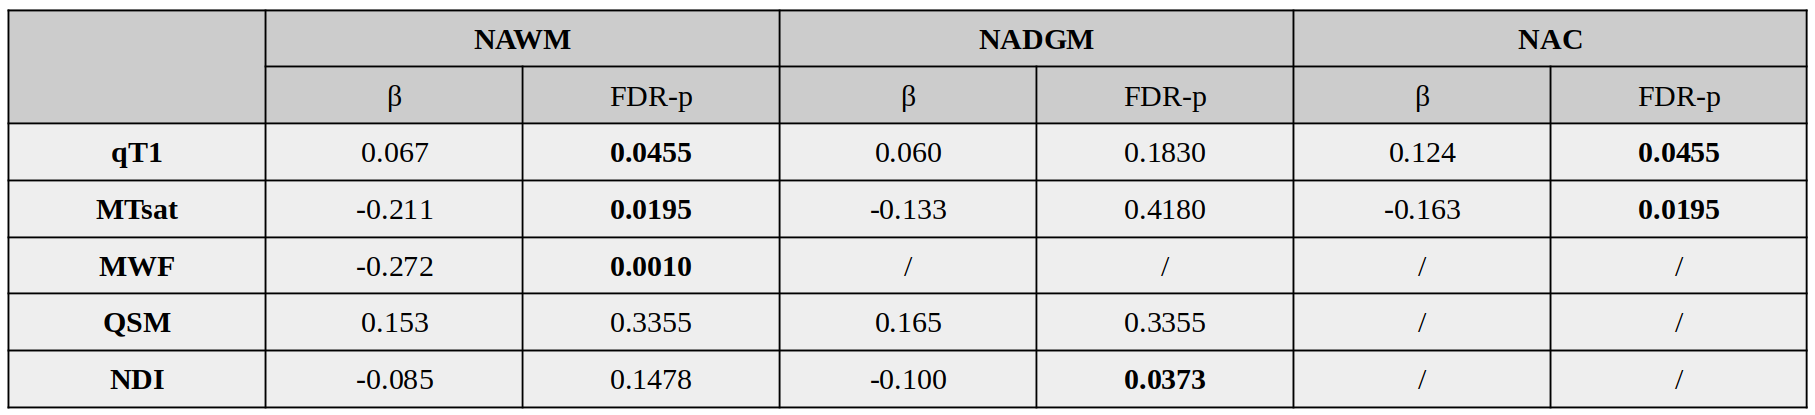
At baseline, PwMS showed increased values of qT1, and reduced values of MTsat and NDI in the NAWM (all FDR-p<0.0001), when compared to HCs. Additionally, increased qT1 values were detected in NAC (FDR-p=0.011) and NADGM (FDR-p=0.006), while reduced MTsat values were measured in NAC (FDR-p=0.003).Figure2 No differences in longitudinal rates of qMRI changes were found between HCs and the entire cohort of PwMS; conversely, accelerated rates of increase in qT1 values were detected in progressive MS (PMS) patients with respect to HCs in the NAWM (FDR-p=0.005), NADGM (FDR-p=0.005), and NAC (FDR-p=0.004). PMS patients also showed significantly accelerated longitudinal qT1 increase with respect to relapsing-remitting (RRMS) patients, in both NAWM (FDR-p=0.019) and NAC (FDR-p=0.015).Figure3 Baseline disability was significantly associated with the rates of qMRI change. Specifically, higher baseline EDSS was associated with accelerated qT1 increase in NAWM (FDR-p=0.045) and NAC (FDR-p=0.045), as well with accelerated reduction of 1) MTsat values in NAWM (FDR-p=0.019) and NAC (FDR-p=0.019), 2) MWF in NAWM (FDR-p=0.001), and 3) NDI in NADGM (FDR-p=0.037).Table2 The accumulation of T2LV during follow-up showed a significant association with the rate of change of MTsat values in NAWM (β=-0.144; FDR-p=0.047).Discussion
In this study we showed that a significant difference in the longitudinal rates of qMRI changes in normal-appearing tissue can be measured in patients with PMS with respect to both HCs and RRMS patients, over a 2-year follow-up. Specifically, the rate of increase of qT1 in PMS was significantly accelerated, involving concomitantly the white matter and gray matter (both in the cerebral cortex, and deep gray matter), reflecting greater accumulation of micro/macrostructural damage. The rates of qMRI changes were associated with the severity of clinical disability, with patients with higher neurological impairment showing accelerated qMRI changes, a fact that is most probably reflecting increased micro/macrostructural damage, demyelination, and axon/dendrite loss in this patients group. Finally, we found that focal inflammatory activity during follow-up correlated with longitudinal MTsat changes, reflecting increased macromolecular damage in NAWM.Conclusion
Patients with PMS are characterized by accelerated longitudinal rates of qT1 increase in normal-appearing tissue, suggesting greater accumulation of micro/macrostructural damage. PwMS with higher disability showed the most severe longitudinal qMRI changes, reflecting accelerated micro/macrostructural damage, demyelination, and axon/dendrite loss.Acknowledgements
No acknowledgement found.References
1. Stadelmann C, Wegner C, Brück W. Inflammation, demyelination, and degeneration - Recent insights from MS pathology [Internet]. Vol. 1812, Biochimica et Biophysica Acta - Molecular Basis of Disease. Biochim Biophys Acta; 2011 [cited 2021 Sep 13]. p. 275–82. Available from: https://pubmed.ncbi.nlm.nih.gov/20637864/
2. Barkhof F. The clinico-radiological paradox in multiple sclerosis revisited. Curr Opin Neurol [Internet]. 2002 [cited 2022 Nov 6];15(3):239–45. Available from: https://pubmed.ncbi.nlm.nih.gov/12045719/
3. Lassmann H. Multiple Sclerosis Pathology. Cold Spring Harb Perspect Med [Internet]. 2018 Mar 1 [cited 2022 Nov 6];8(3). Available from: /pmc/articles/PMC5830904/
4. Granziera C, Wuerfel J, Barkhof F, Calabrese M, De Stefano N, Enzinger C, et al. Quantitative magnetic resonance imaging towards clinical application in multiple sclerosis [Internet]. Vol. 144, Brain. Brain; 2021 [cited 2022 Nov 6]. p. 1296–311. Available from: https://pubmed.ncbi.nlm.nih.gov/33970206/
5. York EN, Meijboom R, Thrippleton MJ, Mark E, Kampaite A, White N, et al. Magnetisation transfer, diffusion and g-ratio measures of demyelination and neurodegeneration in early relapsing-remitting multiple sclerosis: a longitudinal microstructural MRI study. NeuroImage Clin [Internet]. 2022 Jan 1 [cited 2022 Nov 6];36:1–49. Available from: https://linkinghub.elsevier.com/retrieve/pii/S2213158222002935
6. Marques JP, Kober T, Krueger G, van der Zwaag W, Van de Moortele PF, Gruetter R. MP2RAGE, a self bias-field corrected sequence for improved segmentation and T1-mapping at high field. Neuroimage [Internet]. 2010 Jan 15 [cited 2022 Nov 6];49(2):1271–81. Available from: https://pubmed.ncbi.nlm.nih.gov/19819338/
7. Helms G, Dathe H, Dechent P. Quantitative FLASH MRI at 3T using a rational approximation of the Ernst equation. Magn Reson Med [Internet]. 2008 [cited 2022 Nov 6];59(3):667–72. Available from: https://pubmed.ncbi.nlm.nih.gov/18306368/
8. Nguyen TD, Deh K, Monohan E, Pandya S, Spincemaille P, Raj A, et al. Feasibility and reproducibility of whole brain myelin water mapping in 4 minutes using fast acquisition with spiral trajectory and adiabatic T2prep (FAST-T2) at 3T. Magn Reson Med [Internet]. 2016 Aug 1 [cited 2021 Nov 24];76(2):456–65. Available from: https://pubmed.ncbi.nlm.nih.gov/26331978/
9. Liu T, Xu W, Spincemaille P, Avestimehr AS, Wang Y. Accuracy of the morphology enabled dipole inversion (MEDI) algorithm for quantitative susceptibility mapping in MRI. IEEE Trans Med Imaging [Internet]. 2012 Mar [cited 2022 Aug 25];31(3):816–24. Available from: https://pubmed.ncbi.nlm.nih.gov/22231170/
10. Zhang H, Schneider T, Wheeler-Kingshott CA, Alexander DC. NODDI: Practical in vivo neurite orientation dispersion and density imaging of the human brain. Neuroimage [Internet]. 2012 Jul 16 [cited 2022 Nov 6];61(4):1000–16. Available from: https://pubmed.ncbi.nlm.nih.gov/22484410/
11. Puonti O, Iglesias JE, Van Leemput K. Fast and sequence-adaptive whole-brain segmentation using parametric Bayesian modeling. Neuroimage. 2016 Dec 1;143:235–49.
12. Cerri S, Puonti O, Meier DS, Wuerfel J, Mühlau M, Siebner HR, et al. A contrast-adaptive method for simultaneous whole-brain and lesion segmentation in multiple sclerosis. Neuroimage. 2021 Jan 15;225:117471.
Figures