2620
Examining T2* Relaxometry in Diffusion Tensor Space to Quantify Cerebral Microbleeds in Alzheimer’s Disease Mouse Model
Emani Hunter1, Lesley Foley2, Yifan Zhao1, Howard Aizenstein1,3, Minjie Wu1,3, and Bistra Iordanova1
1Department of Bioengineering, University of Pittsburgh, Pittsburgh, PA, United States, 2Animal Imaging Center, University of Pittsburgh, Pittsburgh, PA, United States, 3Department of Psychiatry, University of Pittsburgh, Pittsburgh, PA, United States
1Department of Bioengineering, University of Pittsburgh, Pittsburgh, PA, United States, 2Animal Imaging Center, University of Pittsburgh, Pittsburgh, PA, United States, 3Department of Psychiatry, University of Pittsburgh, Pittsburgh, PA, United States
Synopsis
Keywords: Alzheimer's Disease, Relaxometry, Diffusion Tensor Imaging
Cerebral microbleeds are morphologic changes contributing to the progression of Alzheimer’s Disease and vascular dementias. However, the effects of microbleeds on brain connectivity across age and sex remain to be understood. In this study, we performed T2* mapping, that was registered to a DTI space to measure diffusion changes in microbleed locations. R2* and diffusion tensor indices demonstrate an inverse relationship, where diffusion is low and R2* rates are high. Our results suggest that microbleeds decrease water diffusion in the brain possibly due to increased neuroinflammation and hemosiderin accumulation, shedding light on abnormal tissue structure in Alzheimer’s disease subjects.Introduction
Cerebral microbleeds are commonly found in subjects with cognitive decline that later develop Alzheimer’s Disease (AD) or vascular dementias1. These subtle vascular pathologies can be detected non-invasively with high-field MRI as isolated hypointensities in susceptibility-weighted images. However, the effects of microbleeds on microstructural features of brain tissue, brain connectivity and white matter damage remain to be understood. In this study, we examined the effects of microbleeds on local tissue diffusion and brain connectivity across age and sex in a large cohort of mice expressing the familial human genes for Alzheimer’s disease.Methods
We used 11.7 Tesla Bruker ex vivo MRI to image mice expressing amyloid precursor protein and presenilin (APP-PS1) and age matched controls. The APP-PS1 mice are well-characterized models of Alzheimer’s Disease; they form amyloid plaques and have aspects of vascular dysfunction similar to humans2. The mice (N=40, 17 male and 23 female age 4 -24 months) were deeply anesthetized, transcardially perfused and the brains were excised and placed in a custom 3D printed holder. To quantify the microbleeds in the context of tissue diffusion we used whole-brain 3D multi-gradient echo (MGE, TE/TR=3/800ms, 29 echoes, 3 ms apart) and diffusion tensor imaging (DTI, TE/TR=22.38/1200ms) with 104 µm isotropic voxel resolution. The susceptibility-weighted images were first segmented to remove background noise. A voxel-by-voxel exponential fit was computed on each segmented image in order to extract T2* relaxation times ($$$I = I_{0} \times e^{\frac{-TE}{T2^{*}} }$$$) obtaining a 3D full brain volume of T2* mapping3. The inverse of the T2* values was calculated to obtain the R2* relaxation rates. The R2* relaxation rates were co-registered in the DTI space in order to analyze the relationship between R2* and diffusion in cerebral microbleed locations of the cortical and subcortical regions.Results and Discussion
Microbleeds were visibly identified in susceptibility-weighted images of APP-PS1 mice as ovoid hypointensities (Figure 1a). The morphologic changes were visible between echoes 10 and 15 (times between 30ms and 45ms respectively) in cortical and hippocampal regions. In Figure 1b, the relaxometry map displays bright red areas surrounding the location of the microbleeds and hemosiderin accumulation, corresponding to high relaxation rates in those areas. For the diffusion tensor indices, the diffusion encoded color map (DEC) and DTI tractography model is seen in Figure 1c and 1d respectively. We observe a local area of less diffusion tracts surrounding the microbleeds. Additionally, the microbleeds are higher in AD mice compared to controls and increase with age. Presently, we are also quantifying the effect of sex on the amount of microbleeds and brain connectivity.Conclusion
Our results indicate that R2* relaxation rates and diffusion tensor indices are inversely related in the area of cerebral microbleeds. Further studies will be done to explore the diffusion tensor indices across age and sex including mean diffusivity (MD), fractional anisotropy (FA), and axial diffusivity (AD) to gain a better understanding of microbleed tissue microstructure in deep gray matter. These MRI findings will be correlated with histological stains for amyloid, iron, hemosiderin, myelin, smooth muscle, neutrophils, and endothelial cell markers. This study aims to develop translational MRI-based quantitative biomarkers to detect subtle cellular changes reflective of early dementia pathology before the appearance of brain atrophy and cognitive dysfunction.Acknowledgements
No acknowledgement found.References
- Greenberg, S. M., et al. Cerebral Microbleeds: A guide to detection and interpretation. The Lancet Neurology. 2009;8(2), 165–174.
- Esquerda-Canals, G., et al. Mouse models of Alzheimer's disease. Journal of Alzheimer's Disease. 2017;57(4), 1171–1183.
- Cheng, H.-L. M., et al. Practical medical applications of quantitative MR relaxometry. Journal of Magnetic Resonance Imaging. 2012;36(4), 805–824.
Figures
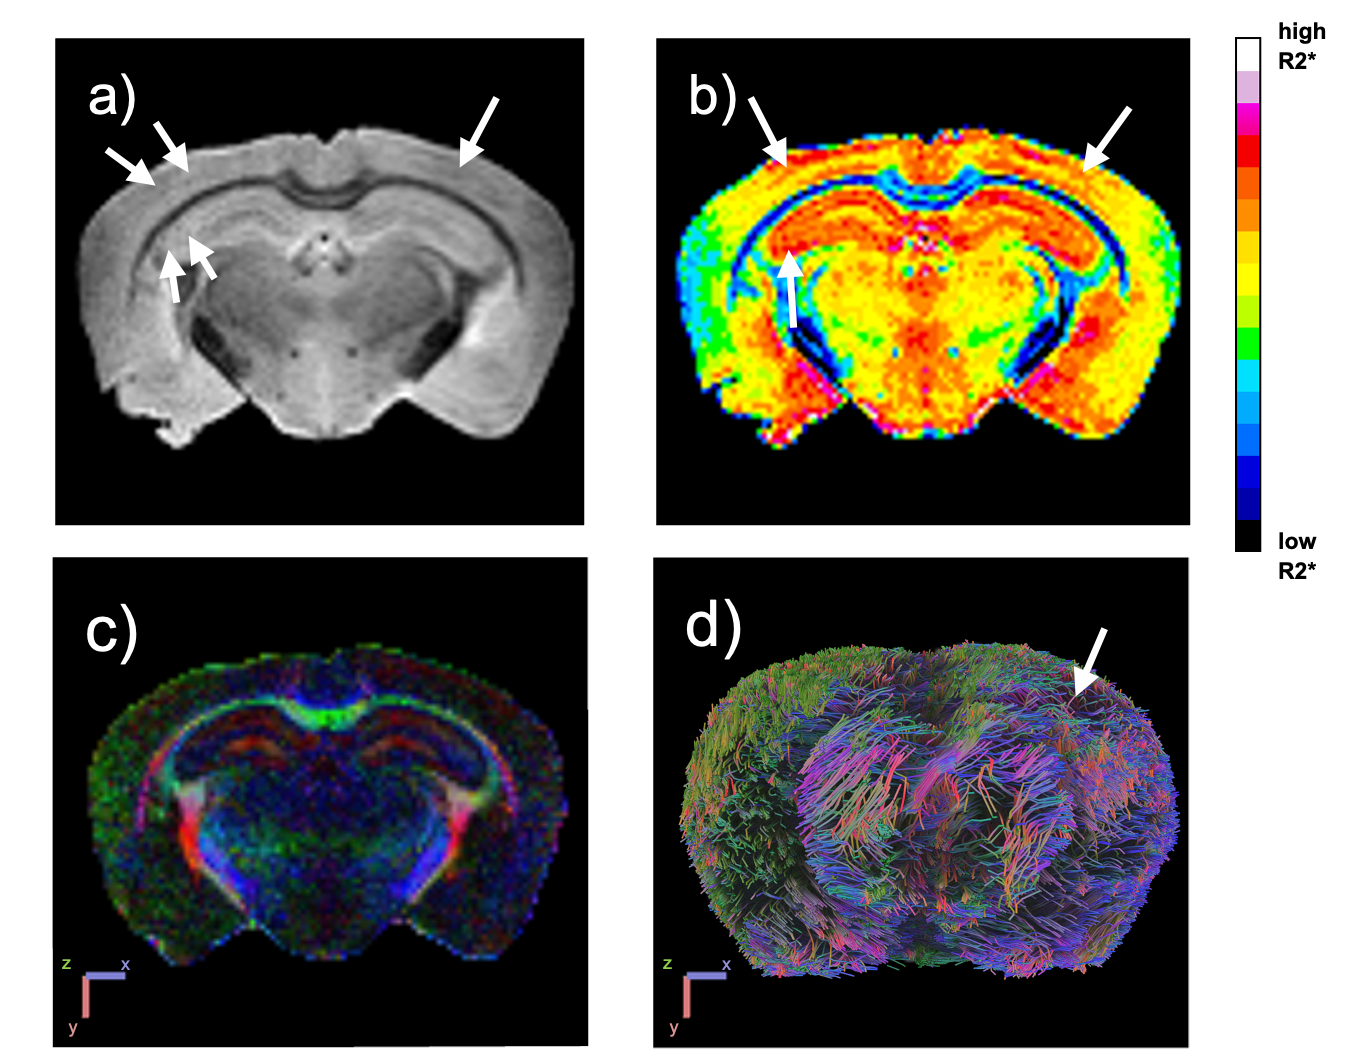
Figure 1. Multimodal MRI example of AD female mouse, 15 months old (a) Microbleeds identified (white arrows) in ex vivo T2*-weighted image. (b) T2* relaxometry map showing high relaxation rates in bright red coloring surrounding microbleed locations. (c) Diffusion encoded color map (DEC). (d) DTI tractography model showing low diffusion in area of microbleed location.
DOI: https://doi.org/10.58530/2023/2620