2618
Deep multiple sclerosis lesion phenotyping using multimodal quantitative MRI1Department of Neurology, Rehabilitation, Ophthalmology, Genetics, Maternal and Child Health, University of Genoa, Genoa, Italy, 2Laboratory of Experimental Neurosciences, IRCCS Ospedale Policlinico San Martino, Genoa, Italy, 3Advanced Clinical Imaging Technology, Siemens Healthineers International AG, Lausanne, Switzerland, 4Department of Radiology, Lausanne University Hospital and University of Lausanne, Lausanne, Switzerland, 5LTS5, École Polytechnique Fédérale de Lausanne (EPFL), Lausanne, Switzerland, 6Siemens Healthcare, Milan, Italy, 7Department of Neuroradiology, Health Sciences, University of Genoa, Genoa, Italy, 8Lausanne University Hospital and University of Lausanne, Department of Radiology, Luasanne, Switzerland, 9IRCCS Stella Maris, Pisa, Italy
Synopsis
Keywords: Multiple Sclerosis, Multi-Contrast
Quantitative MRI has the potential to disentangle the heterogeneity of multiple sclerosis (MS) lesions in vivo, which can be decisive for treatment and monitoring. In this study, we distinguished different types of MS lesions based on quantitative susceptibility mapping (QSM) and characterized them using T1 relaxometry, diffusion imaging and myelin mapping. We identified four types of lesions (hypo/isointense, homogeneous hyperintense, inhomogeneous hyperintense and paramagnetic rim), which were characterized by increasing degrees of axonal and myelin disruption. Paramagnetic rim lesions were closer to the ventricular CSF, corroborating the presence of a noxious activity of CSF in MS pathology.Background and Aims
Neuropathological studies have shown that multiple sclerosis (MS) lesions are heterogeneous in terms of axonal and myelin damage as well as immune cells infiltrates1. In QSM, MS lesions may appear hyper-, iso-, or hypointense, compared to the surrounding tissue. Particularly, QSM hypo- and isointense lesions have been recently described as a potential biomarker for remyelinating lesions2. Conversely, QSM hyperintense lesions seem to correspond to more destructive lesions. Of note, the hyperintense QSM signal may be confined to the borders of the lesion (paramagnetic rim lesions3) or distributed within the lesion itself4. Lesion localization has been proposed as one of the possible responsible for lesion heterogeneity, as lesions closer to the ventricular CSF seem to be more destructive5 and less likely to undergo remyelination6, while remyelinated lesions are more likely in the deep white matter7. For a more comprehensive classification and a better understanding of lesion heterogeneity in MS, in this study we aimed to:i. Identify different MS lesion types using QSM and to characterize them using relaxometry, myelin mapping, and diffusion MRI.
ii. Characterize the spatial distribution of different lesion types with respect to the ventricular CSF.
Methods
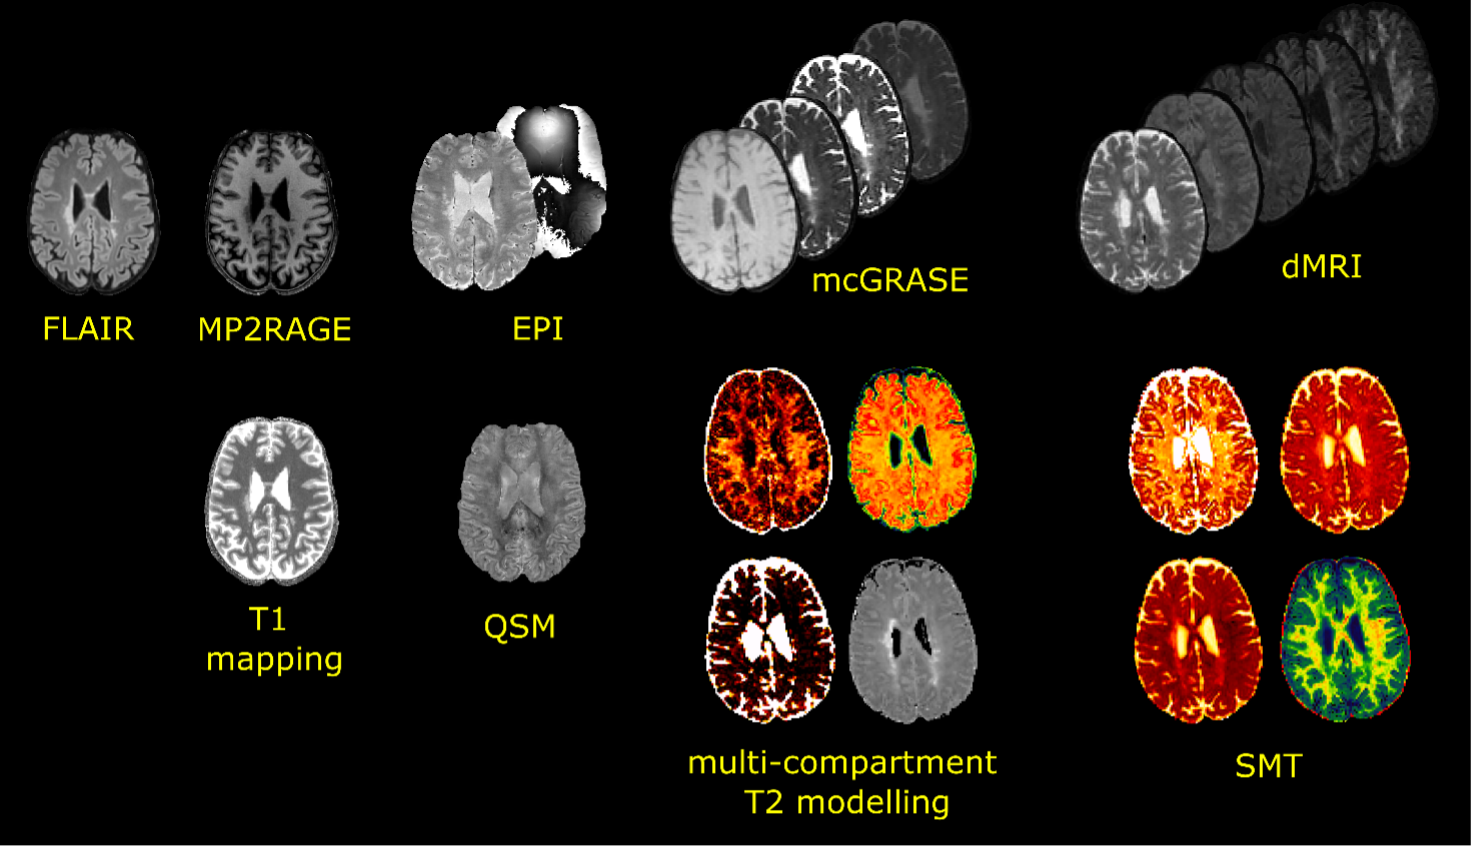
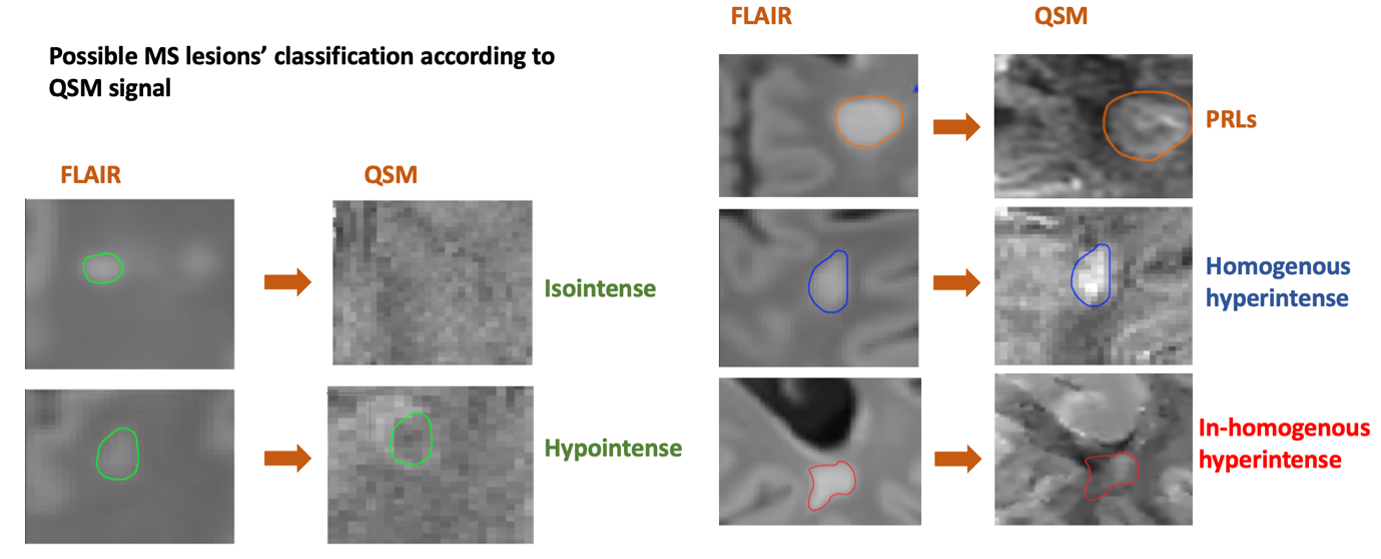
Fifty-two people with MS (34 females, age=44,interquartile range -IQR- 32-52, 40 relapsing-remitting -RR- and 12 secondary progressive -SPMS-) and 24 healthy controls (-HC-,16 females, age=38,IQR 27-52) were scanned at 3T (MAGNETOM Prisma, Siemens Healthcare) using the following sequences: 3D-FLAIR (TR/TE/TI=5000/393/1800ms,resolution=0.4x0.4x1mm3,TA=6’37”); 4.6x accelerated compressed sensing MP2RAGE8 research application (TR/TE/TI1/TI2=5000/2.9/700/2500ms,resolution=1mm isotropic,TA=3’40”); segmented 3D-EPI for QSM9 (TR/TE=64/35ms,resolution=0.65mm isotropic); mcGRASE10 research application (TR=1000ms,32 TE in [10.36, 331.52]ms, resolution=1.8mm isotropic, CAIPIRINHA11 3x2,TA=9’39”); multi-shell dMRI with 107 directions and b-value up to 3000s/mm2 (TR/TE=4600/75ms,resolution=1.8mm isotropic,TA=8’58”) and 12 measurements of b-value 0s/mm2 with reversed phase encoding. Figure1 illustrates the native and derived images.FLAIR lesions were automatically segmented using SinLab (SienaImaging,Italy), while WM masks were obtained using FreeSurfer12 and removal of subcortical nuclei segmented through FIRST13. From the qMRI, we derived the following: averaged T1 from MP2RAGE; magnetic susceptibility maps from 3D-EPI using a custom Matlab code (The MathWorks Inc.,Natick,USA) with STIsuite routines for phase unwrapping14, background phase removal15 and dipole deconvolution16; average T2 of intra- and extra-axonal space, myelin, intra- and extra-axonal and free water fractions (MWF, IEWF and FWF) from mcGRASE17. dMRIs were pre-processed using a combination of FSL18 and MRtrix319 following these steps: denoising20, movement artifacts and susceptibility induced distortions removal21–23, B1-bias correction24. We subsequently extracted the intra-axonal signal fraction (SMT-intra), and the mean and transversal diffusivities (SMT-extramd and SMT-extratrans) of multicompartment spherical mean technique (SMT)25 using Kaden’s official toolbox. We identified MS lesions based on T2-FLAIR hyperintensities and then, after affine co-registration between FLAIR and QSM, we used the corresponding QSM signal to classify lesions as hypo-isointense versus hyperintense. The latters were further classified according to the spatial pattern of QSM hyperintensity. We thus obtained 4 classes of lesions (Figure2):
1. Hypo-isointense lesions
2. Homogeneous hyperintense lesions, characterized by a homogeneous distribution of hyperintensity along the whole lesion
3. Inhomogeneous hyperintense lesions, characterized by the presence of a scattered hyperintensity without a homogeneous pattern
4. Paramagnetic rim lesions (PRLs), defined by the presence of a hyperintense rim with a relative hypointense center
After non-linear registration of each map and lesion mask onto the MNI152 space, average microstructural metrics within the different maps were extracted inside each lesion. For QSM values, we created an atlas using the HCs maps and we computed values inside each lesion as:
QSMlesion = meanvoxels_within_lesion{QSMpatient (voxeli)–QSMHCs (voxeli)},where voxeli indicates the voxels of the lesion, while QSMpatient and QSMHCs are the QSM in MNI152 space of patient and HCs atlas, respectively.
Distance maps from ventricular CSF towards the cortex were calculated as the 3D-Euclidean distance to the nearest nonzero voxel using the “distancemap” command (FSL)26.
Statistical tests were carried out using SPSS(IBM,vers28.01), using generalized linear models controlling for patient ID, age, sex, MS phenotype and lesion volume as confounding factors.
Results
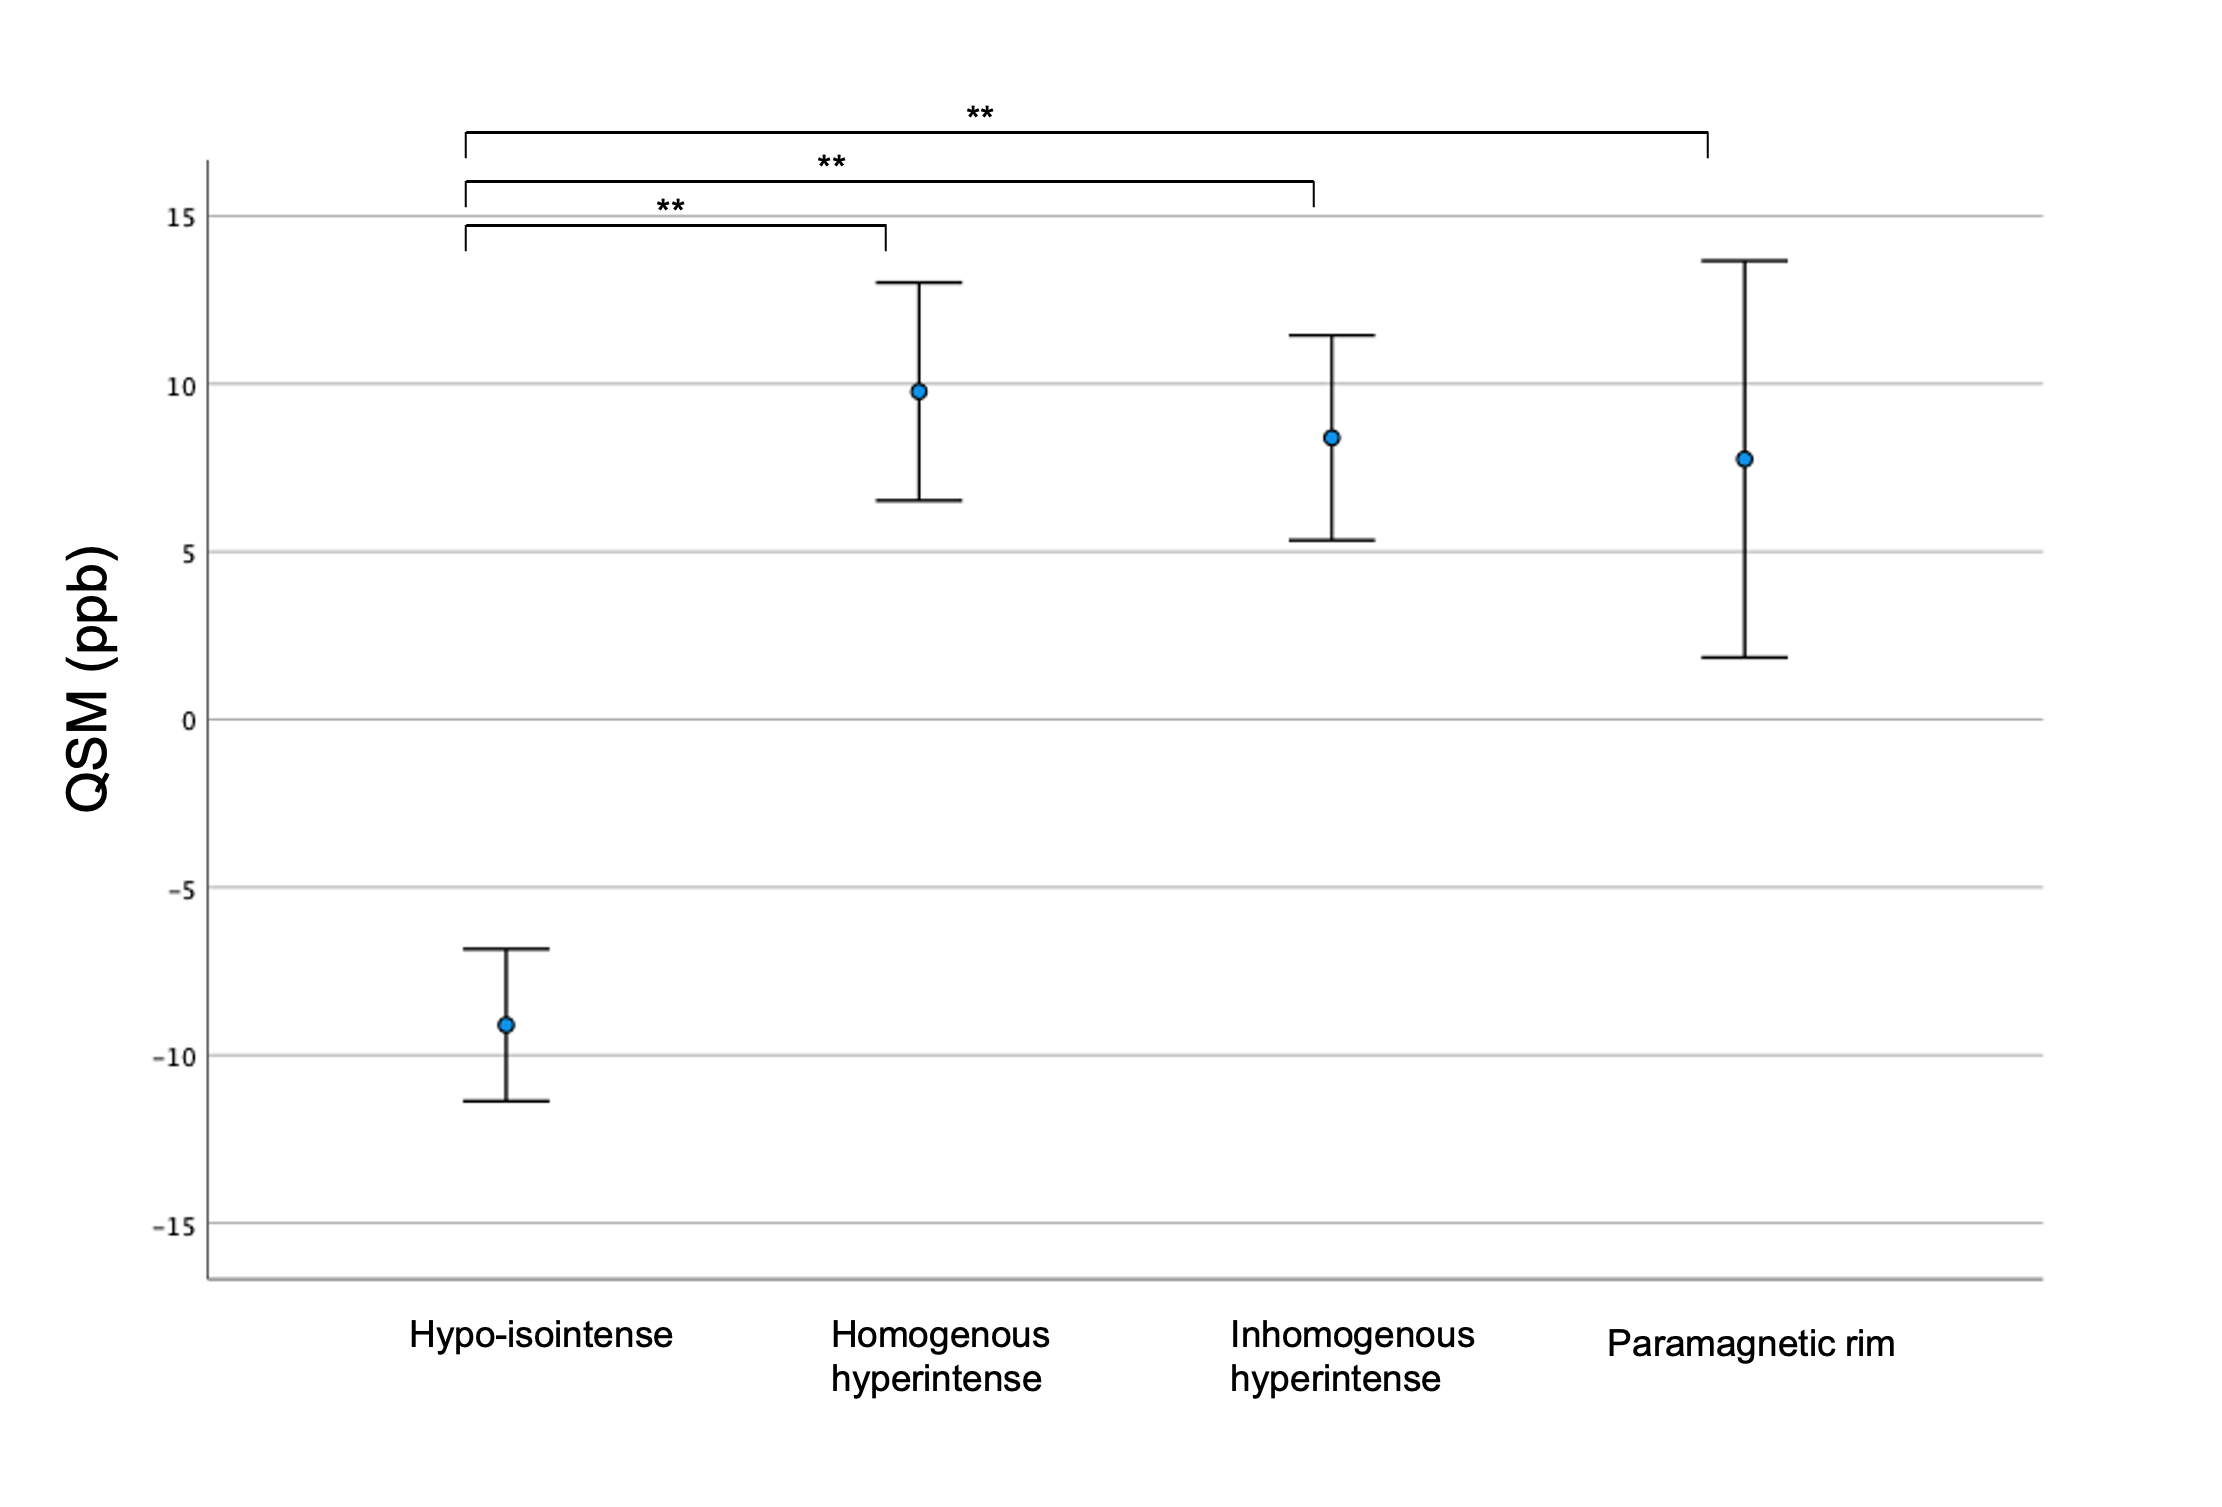
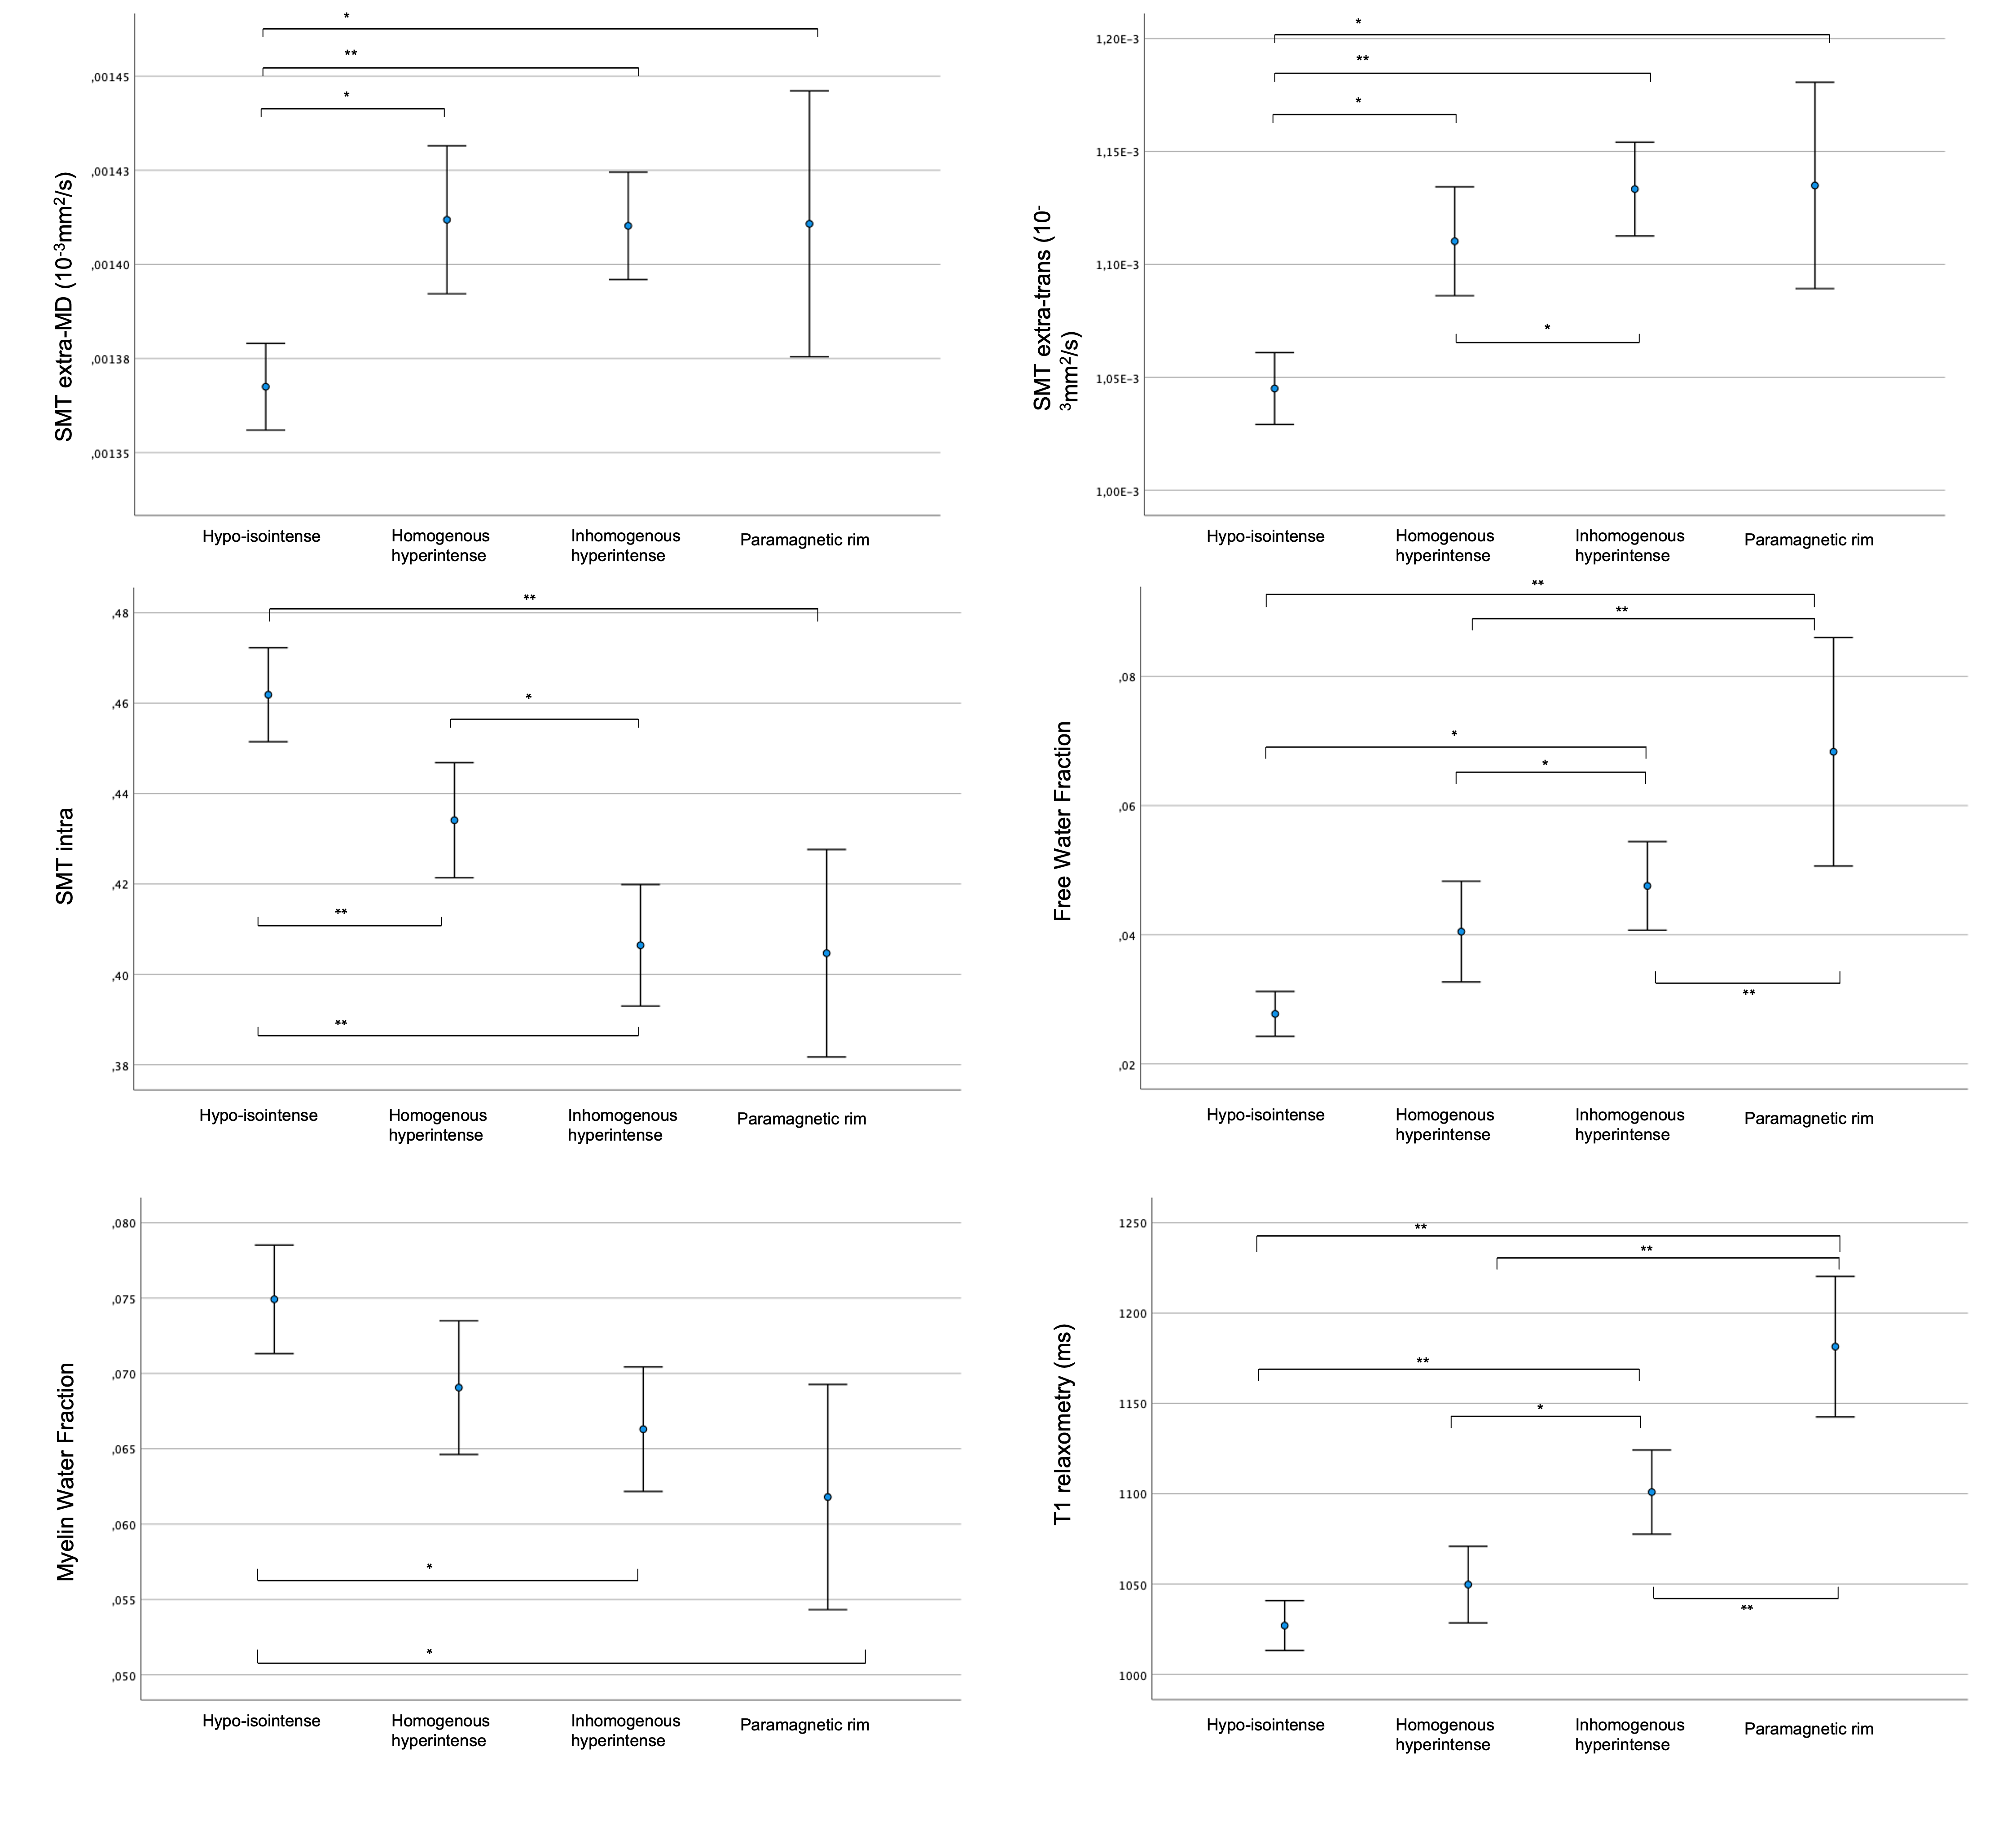
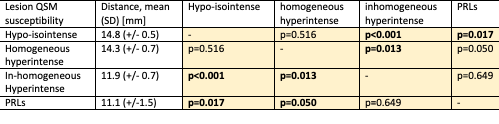
Out of 844 lesions, 44.4% were classified as hypo-isointense lesions (median number per subject=5,IQR=1-10), 23.0% as homogeneous hyperintense lesions (median=3,IQR=1-5), 24.9% as inhomogeneous lesions (median=4,IQR=1-6) and 7.7% as PRLs (median=1,IQR=0-2). As expected, significant differences in QSM values were noted between hypo-isointense lesions versus hyperintense lesions, while there were no differences between homogeneous/inhomogeneous/PRLs (Figure3).Figure4 shows error plots of each microstructural metric among the different types of QSM lesions. A worsening gradient was noted in all SMT-derived metrics between lesion types (hypo-isointense lesions→homogeneous hyperintense lesions→inhomogeneous hyperintense lesions→PRLs). PRLs showed the highest FWF and the longer T1 values than all other lesion groups. PRLs and the inhomogeneous hyperintense lesions were closer to ventricular CSF than hypo-isointense and homogeneous hyperintense lesions(Figure5).
Discussion
We identified four MS lesion types according to QSM intensity and pattern. Using multimodal qMRI, we found a worsening gradient (hypo-isointense lesions→homogeneous hyperintense lesions→inhomogeneous hyperintense lesions→PRLs) in terms of axonal and myelin damage. Our results suggest that lesion phenotyping with QSM can disentangle in vivo the complex histopathology of MS lesions, allowing for a better monitoring and prognosis of patients. More destructive MS lesions were more frequent in the periventricular area, corroborating the surface-in theory and the presence of a noxious activity of CSF in MS pathology.Acknowledgements
No acknowledgement found.References
1. Kuhlmann T, Ludwin S, Prat A, Antel J, Brück W, Lassmann H. An updated histological classification system for multiple sclerosis lesions. Acta Neuropathol. 2017;133(1):13-24. doi:10.1007/s00401-016-1653
2. Rahmanzadeh R, Galbusera R, Lu P, et al. A New Advanced <scp>MRI</scp> Biomarker for Remyelinated Lesions in Multiple Sclerosis. Ann Neurol. 2022;92(3):486-502. doi:10.1002/ana.26441
3. Absinta M, Sati P, Schindler M, et al. Persistent 7-tesla phase rim predicts poor outcome in new multiple sclerosis patient lesions. Journal of Clinical Investigation. 2016;126(7):2597-2609. doi:10.1172/JCI86198
4. Hemond CC, Reich DS, Dundumadappa SK. Paramagnetic Rim Lesions in Multiple Sclerosis: Comparison of Visualization at 1.5-T and 3-T MRI. American Journal of Roentgenology. Published online December 1, 2021. doi:10.2214/AJR.21.26777
5. Vaneckova M, Piredda GF, Andelova M, et al. Periventricular gradient of T1 tissue alterations in multiple sclerosis. Neuroimage Clin. 2022;34:103009. doi:10.1016/j.nicl.2022.103009
6. Tonietto M, Poirion E, Lazzarotto A, et al. Periventricular remyelination failure in multiple sclerosis: a substrate for neurodegeneration. Brain. Published online September 13, 2022. doi:10.1093/brain/awac334
7. Kolb H, Absinta M, Beck ES, et al. <scp>7T MRI</scp> Differentiates Remyelinated from Demyelinated Multiple Sclerosis Lesions. Ann Neurol. 2021;90(4):612-626. doi:10.1002/ana.26194
8. Mussard E, Hilbert T, Forman C, Meuli R, Thiran JP, Kober T. Accelerated MP2RAGE imaging using Cartesian phyllotaxis readout and compressed sensing reconstruction. Magn Reson Med. Published online 2020. doi:10.1002/mrm.28244
9. Sati P, Thomasson DM, Li N, et al. Rapid, high-resolution, whole-brain, susceptibility-based MRI of multiple sclerosis. Multiple Sclerosis Journal. Published online 2014. doi:10.1177/1352458514525868
10. Piredda GF, Hilbert T, Canales-Rodríguez EJ, et al. Fast and high-resolution myelin water imaging: Accelerating multi-echo GRASE with CAIPIRINHA. Magn Reson Med. 2021;85(1). doi:10.1002/mrm.28427
11. Breuer FA, Blaimer M, Mueller MF, et al. Controlled aliasing in volumetric parallel imaging (2D CAIPIRINHA). Magn Reson Med. Published online 2006. doi:10.1002/mrm.20787
12. Fischl B, Salat DH, Busa E, et al. Whole brain segmentation: automated labeling of neuroanatomical structures in the human brain. Neuron. 2002;33:341-355. doi:10.1016/s0896-6273(02)00569-x
13. Patenaude B, Smith SM, Kennedy DN, Jenkinson M. A Bayesian model of shape and appearance for subcortical brain segmentation. Neuroimage. Published online 2011. doi:10.1016/j.neuroimage.2011.02.046
14. Li W, Avram A V., Wu B, Xiao X, Liu C. Integrated Laplacian-based phase unwrapping and background phase removal for quantitative susceptibility mapping. NMR Biomed. Published online 2014. doi:10.1002/nbm.3056
15. Schweser F, Deistung A, Lehr BW, Reichenbach JR. Quantitative imaging of intrinsic magnetic tissue properties using MRI signal phase: An approach to in vivo brain iron metabolism? Neuroimage. Published online 2011. doi:10.1016/j.neuroimage.2010.10.070
16. Li W, Wang N, Yu F, et al. A method for estimating and removing streaking artifacts in quantitative susceptibility mapping. Neuroimage. Published online 2015. doi:10.1016/j.neuroimage.2014.12.043
17. Canales-Rodríguez EJ, Pizzolato M, Piredda GF, et al. Comparison of non-parametric T2 relaxometry methods for myelin water quantification. Med Image Anal. 2021;69:101959. doi:https://doi.org/10.1016/j.media.2021.101959
18. Smith SM, Jenkinson M, Woolrich MW, et al. Advances in functional and structural MR image analysis and implementation as FSL. In: NeuroImage. ; 2004. doi:10.1016/j.neuroimage.2004.07.051
19. Tournier JD, Smith R, Raffelt D, et al. MRtrix3: A fast, flexible and open software framework for medical image processing and visualisation. Neuroimage. 2019;202:116137. doi:https://doi.org/10.1016/j.neuroimage.2019.116137
20. Cordero-Grande L, Christiaens D, Hutter J, Price AN, Hajnal J V. Complex diffusion-weighted image estimation via matrix recovery under general noise models. Neuroimage. Published online 2019. doi:10.1016/j.neuroimage.2019.06.039
21. Andersson JLR, Graham MS, Zsoldos E, Sotiropoulos SN. Incorporating outlier detection and replacement into a non-parametric framework for movement and distortion correction of diffusion MR images. Neuroimage. 2016;141:556-572. doi:https://doi.org/10.1016/j.neuroimage.2016.06.058
22. Andersson JLR, Sotiropoulos SN. An integrated approach to correction for off-resonance effects and subject movement in diffusion MR imaging. Neuroimage. 2016;125:1063-1078. doi:10.1016/J.NEUROIMAGE.2015.10.019
23. Andersson JLR, Skare S, Ashburner J. How to correct susceptibility distortions in spin-echo echo-planar images: application to diffusion tensor imaging. Neuroimage. 2003;20(2):870-888. doi:https://doi.org/10.1016/S1053-8119(03)00336-7
24. Tustison NJ, Avants BB, Cook PA, et al. N4ITK: improved N3 bias correction. IEEE Trans Med Imaging. 2010;29(6):1310-1320. doi:10.1109/TMI.2010.2046908
25. Kaden E, Kelm ND, Carson RP, Does MD, Alexander DC. Multi-compartment microscopic diffusion imaging. Neuroimage. 2016;139:346-359. doi:https://doi.org/10.1016/j.neuroimage.2016.06.002
26. Poirion E, Tonietto M, Lejeune FX, et al. Structural and Clinical Correlates of a Periventricular Gradient of Neuroinflammation in Multiple Sclerosis. Neurology. Published online 2021. doi:10.1212/WNL.0000000000011700
Figures