2617
Diffusion tensor imaging study of white matter differences between autoimmune encephalitis and viral encephalitis1Kunming University of Science and Technology, Kunming, China, 2the Affiliated Hospital of Kunming University of Science and Technology, Kunming, China, 3MR Scientific Marketing, Siemens Healthineers, Shanghai, China
Synopsis
Keywords: Neuroinflammation, Diffusion Tensor Imaging, encephalitis
In this study, diffusion tensor imaging (DTI) analysis based on Tract-based spatial statistics (TBSS) was used to investigate the microstructural changes of white matter (WM) in viral encephalitis (VE) and autoimmune encephalitis (AE). The study found that WM injury degree in patients with VE and AE was different. The DTI parameters can separate AE, VE and healthy control group. The study results indicate that DTI could serve the function of early diagnosing and distinguishing AE from VE, and provide imaging evidence for the pathophysiological changes of WM in AE and VE patients.
Introduction
The purpose of this study is to explore the similarities and differences of white matter (WM) microstructure changes in patients with AE and VE by using DTI technology, and to explore the correlation between WM fiber changes and clinical indicators of patients.Methods
This study enrolled 17 VE patients who met the 2022 guidelines[1], 19 AE patients who met the 2016 guidelines[2], and 36 healthy controls (HC). All participants underwent scanning using a 3T magnetic resonance scanner (MAGNETOM Prisma, Siemens Healthineers, Erlangen, Germany). We used a single-shot echo-planar imaging sequence to acquire DTI images: TR/TE=8000ms/64ms, 75 axial sections, slice thickness/gap =2mm/0mm, field of view=224×224mm², spatial resolution=1×1×2 mm3, number of excitations =1, ten image without diffusion weighting and 65 diffusion-weighted images (b = 1000 s/mm2) along 64 non-collinear directions. Using the Oxford Centre for Functional MRI of the Brain Software Library (FMRIB; FSL, version 6.0) to preprocess the DTI images and calculate the fractional anisotropy (FA), mean diffusivity (MD), axial diffusivity (AD) and radial diffusivity (RD). Tract-based spatial statistics (TBSS)[3] was applied for the analysis of voxel wise parameters of DTI changes by using FSL software. For statistical testing we conducted a one-way univariate analysis of covariance with permutation-based nonparametric inference on parameters of DTI with age and sex as nuisance covariates. FSL’s randomize was used with threshold-free cluster enhancement and 5000 permutations per analysis to assess group differences between patients with AE, VE, and HC subjects. For whole brain multiple comparison correction, the statistical threshold was set at α < 0.05. Post-hoc tests were performed if there were statistical differences between the three groups. In order to identify the WM tracts, Johns Hopkins University White-Matter Tractography Atlas provided in the FSL toolbox was used. The minimum volume to consider significant results in a region was set to 30 mm³. At the same time, the average value of fiber bundles was extracted. The correlation between disease course, seizure and modified Rankin Scale (mRS) Score was analyzed. Receiver characteristic curve was used to evaluate the diagnostic efficacy of DTI parameters for AE and VE.Results
1. demographic characteristics statisticsMRI was performed in 19 AE patients and 17 VE patients within 0.3 to 24 months after acute onset. There were no statistically significant differences in age and gender among the three groups (p > 0.05), and there were no statistically significant differences in the course of disease, mRS Score, and presence or absence of seizures between the AE group and the VE group (p > 0.05) (Table 1).
2. TBSS analysis
There were significant differences in FA, MD, AD and RD values among AE group, VE group and HC group (α < 0.05). The post-hoc test results (Table 2) were as follows: FA and AD values of VE group were significantly lower than those of AE group (P<0.05) (Fig 1). Compared with HC group, FA and AD values of AE group were significantly higher (P<0.05), while those of VE group were significantly lower (P<0.05). MD and RD value of AE and VE groups were significantly higher than those of HC group (P<0.05). Conducting Spearman correlation analysis only found that AD value of the right inferior fronto-occipital tract of VE group was positively correlated with the disease duration (ρ=0.542, p=.025) (Fig. 2). ROC curve was used to evaluate the diagnostic efficacy of DTI parameters for AE, VE and HC (Fig 3), and it was found that FA value of the right corticospinal tract had the best diagnostic efficacy for AE and VE, with 73.9% sensitivity and 94.1% specificity (AUC=0.898, p < 0.001). AD value of the right inferior longitudinal fasciculus had the best diagnostic efficacy for AE and HC, with 68.42% sensitivity and 94.44% specificity (AUC=0.841, p < 0.001). FA value of the right corticospinal tract had the best diagnostic efficiency for VE and HC, with 76.47% sensitivity and 83.33% specificity (AUC=0.853, p < 0.001).
Discussion
In the TBSS-based DTI analysis, we found that WM microstructure damage in VE patients is more obvious than that in AE patients. It may indicate that autoantibody damage to brain parenchyma is weaker than foreign virus. FA and AD are both markers of WM fiber integrity and density [4,5], so FA and AD value of AE patients higher than those of HC group may indicate that the WM microstructure of AE patients have compensatory remodeling. AD values of the right inferior fronto-occipital tract in VE patients were positively correlated with disease duration, suggesting that there may be persistent WM microstructural injury in VE patients. Last but not least, FA and AD values of different regions can distinguish AE, VE and HC groups, which indicates that the FA and AD values would be expected to be biological markers for differential diagnosis of AE and VE.Conclusion
This study is a preliminary study of DTI application in differential diagnosis of AE and VE patients. The results show that DTI technology has the potential for early diagnosis and differentiation between AE and VE. The results of this study also provide a neuro-imaging basis for the micro-changes of WM in patients with AE and VE.Acknowledgements
We sincerely thank the participants in this study.References
[1] Guan Hongzhi Diagnosis and treatment of viral encephaliti [J].Chin J Neurol, 2022, 55(7): 747-754.
[2] Graus F P, Titulaer M J M, Balu R M, et al. A clinical approach to diagnosis of autoimmune encephalitis[J]. Lancet neurology, 2016,15(4):391-404.
[3] Smith S M, Jenkinson M, Johansen-Berg H, et al. Tract-based spatial statistics: Voxelwise analysis of multi-subject diffusion data[J]. NeuroImage, 2006,31(4):1487-1505.
[4] Choe A S, Stepniewska I, Colvin D C, et al. Validation of diffusion tensor MRI in the central nervous system using light microscopy: quantitative comparison of fiber properties[J]. NMR in Biomedicine, 2012,25(7):900-908.
[5] Winklewski P J, Sabisz A, Naumczyk P, et al. Understanding the Physiopathology Behind Axial and Radial Diffusivity Changes—What Do We Know ?[J]. Frontiers in Neurology, 2018,9.
Figures
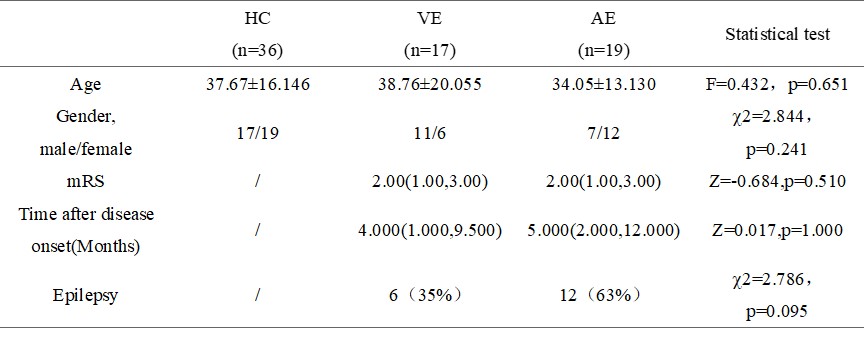
Table 1 Clinical and demographic characteristics of healthy controls (HC), viral encephalitis (VE) and autoimmune encephalitis (AE)

Table 2 Summary of white matter regions where significant differences were found in all comparisons
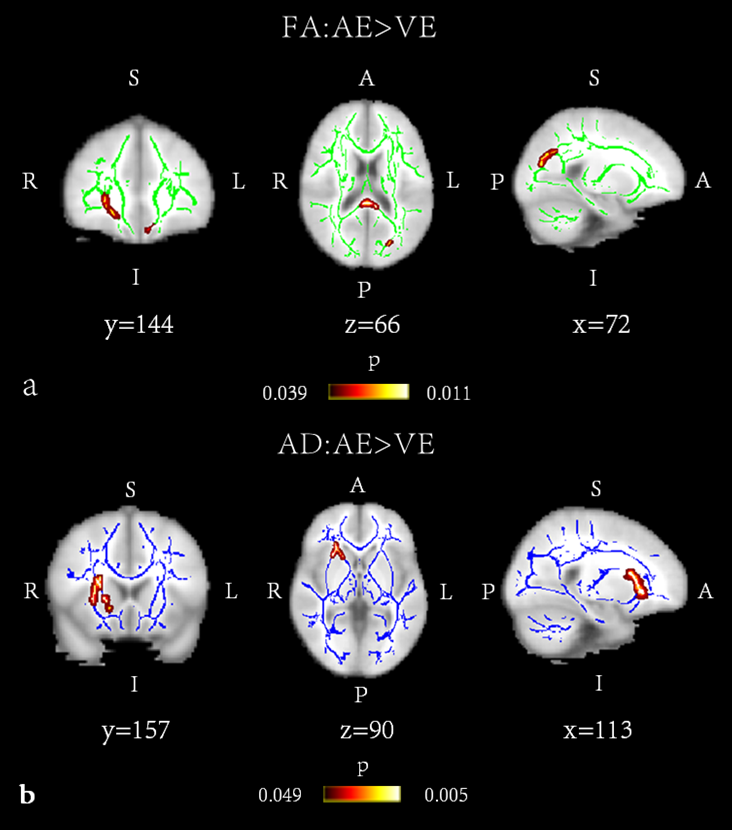
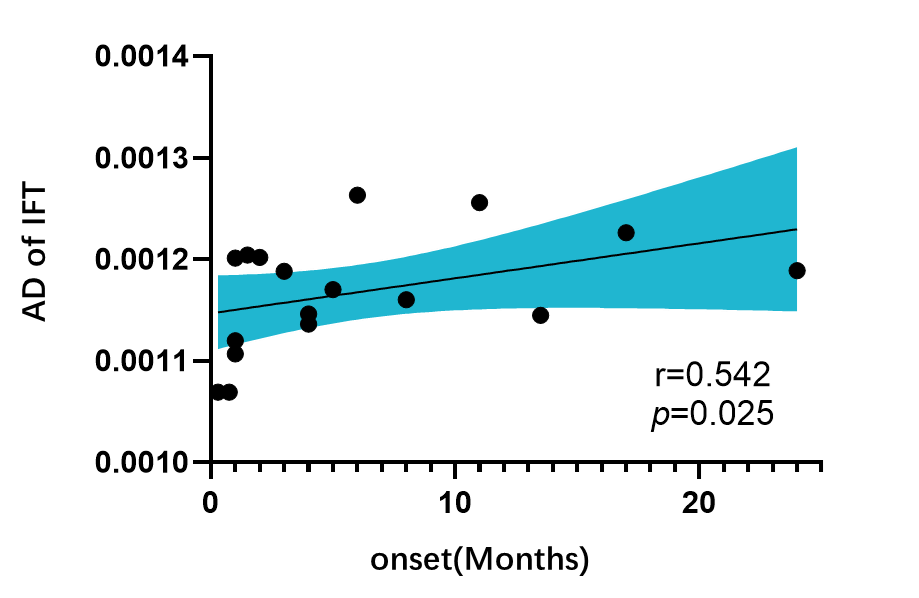
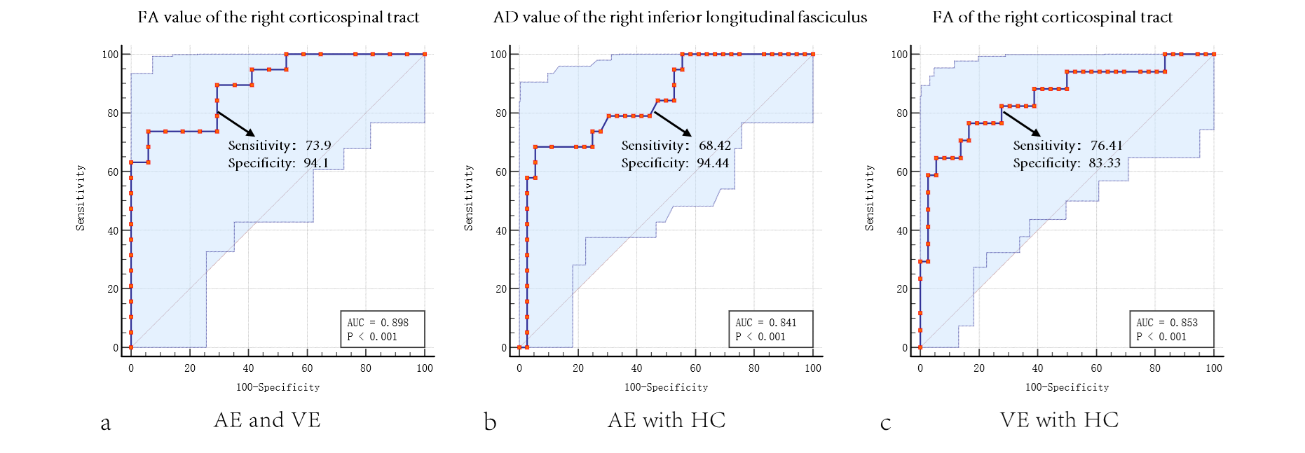
Fig 3: Classification of encephalitis patients based on DTI parameter values. a. The FA value of the right corticospinal tract had the best diagnostic efficacy for AE and VE; b. The AD value of the right inferior longitudinal fasciculus had the best diagnostic efficacy for AE and HC; c. FA of the right corticospinal tract had the best diagnostic efficiency for VE and HC.