2614
Elucidating the role of diabetes mellitus on multiple sclerosis pathology using diffusion MRI1Center for Biomedical Imaging, Department of Radiology, New York University Grossman School of Medicine, New York, NY, United States
Synopsis
Keywords: Multiple Sclerosis, Diffusion/other diffusion imaging techniques
Diabetes mellitus (DM) has been potentially associated with multiple sclerosis (MS), but has not been definitively shown to worsen its severity. Our study used diffusion kurtosis imaging (DKI) analyzed with tract-based spatial statistics to identify significant differences in DKI metrics in addition to measuring lesion volume in MS and Control patients with and without DM. We observed significantly increased diffusion and axial kurtosis and increased periventricular lesion volume in MS patients with DM compared to those without DM, indicating worsening inflammation and demyelination, suggesting that DM may serve as an exacerbating factor for worsening MS prognosis.Introduction
Multiple sclerosis (MS) affects approximately 2.8 million people worldwide and has a significant lifetime cost burden1. Diffusion MRI (dMRI), specifically diffusion kurtosis imaging (DKI), has been shown to inform on MS white matter tract integrity through quantifying diffusion metrics, allowing for identification of demyelinating and inflammatory lesions and microstructural change throughout disease progression2-4. Diabetes mellitus (DM) is another chronic health condition that affects approximately 422 million people worldwide5 and is potentially linked to developing MS and worsening MS prognosis, but no definitive causation has been established6. This study seeks to evaluate the relationship between DM and MS to establish whether DM worsens the severity of MS white matter tract integrity through measuring DKI metrics and MS lesion load.Methods
Retrospective DKI data was collected on 239 patients (165 MS, 74 Controls) propensity score-matched on age and sex and split into four groups:● MS patients with DM (9F, 15M, 51.0±12.0 years)
● Controls with DM (12F, 12M, 53.2±12.0 years)
● MS patients without DM (80F, 61M, 45.5±12.5 years)
● Controls without DM (36F, 14M, 48.1±14.6 years)
Diffusion-weighted images were collected using 5 b0 images and 1 b0 acquired with reverse phase-encoding direction (PA) for EPI distortion correction7, with the following dMRI parameters: b=250s/mm2 – 4 directions, b=1000s/mm2 – 20 directions, b=2000s/mm2 – 60 directions, TE=70ms or 96ms, TR=3.7s, 50 slices, resolution=1.7x1.7x3mm3, 6/8 partial Fourier. dMRI was processed using the Diffusion parameter EStImation with Gibbs and NoisE Removal (DESIGNER) pipeline2,3 to derive DKI parameter maps8, which underwent tract-based spatial statistics (TBSS) from the FMRIB Software Library (FSL)9 for voxel-wise comparison with age and sex as covariates between groups for fractional anisotropy, mean, radial, and axial diffusion, and mean, radial, and axial kurtosis (FA, MD, RD, AD, MK, RK, AK).
Patient volumetric data was collected using the icometrix icobrain ms report for MRI to identify changes in lesion volume from 1mm isotropic resolution MPRage scans and was analyzed using ANCOVA with Tukey’s HSD post-hoc test on the adjusted means. Data manipulation and statistical analyses were conducted in Python 3.9.7 using the Anaconda3 distribution.
Results
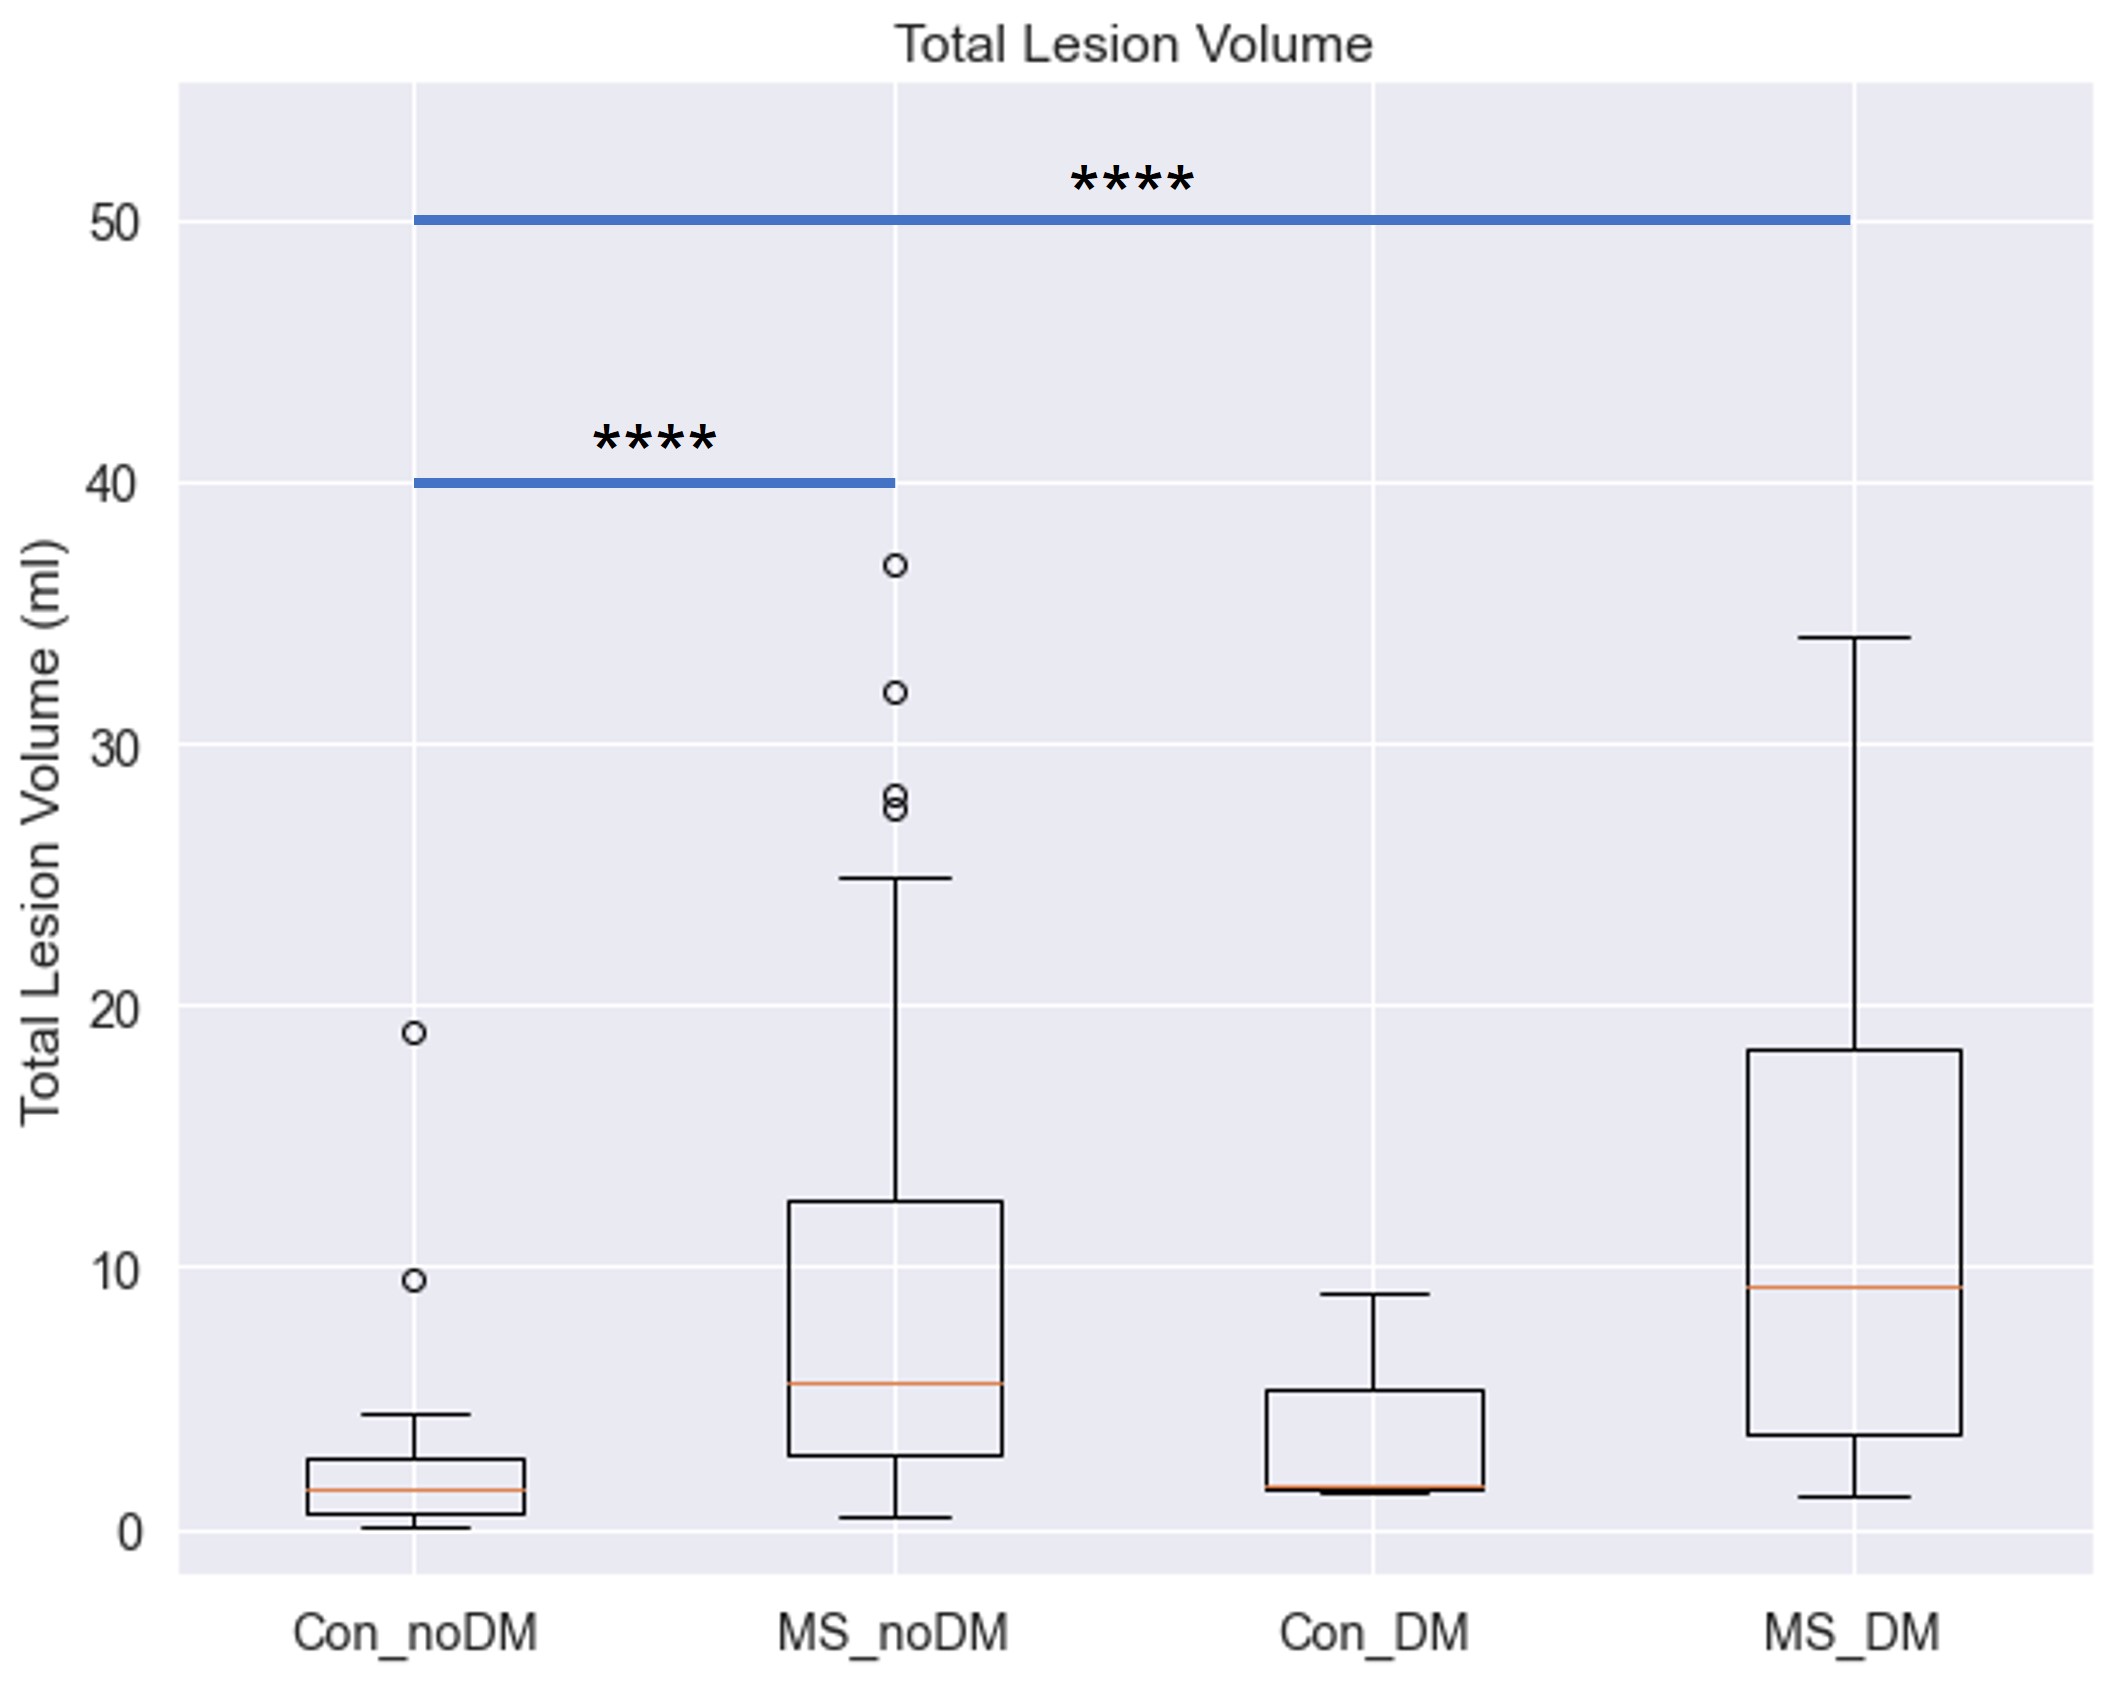
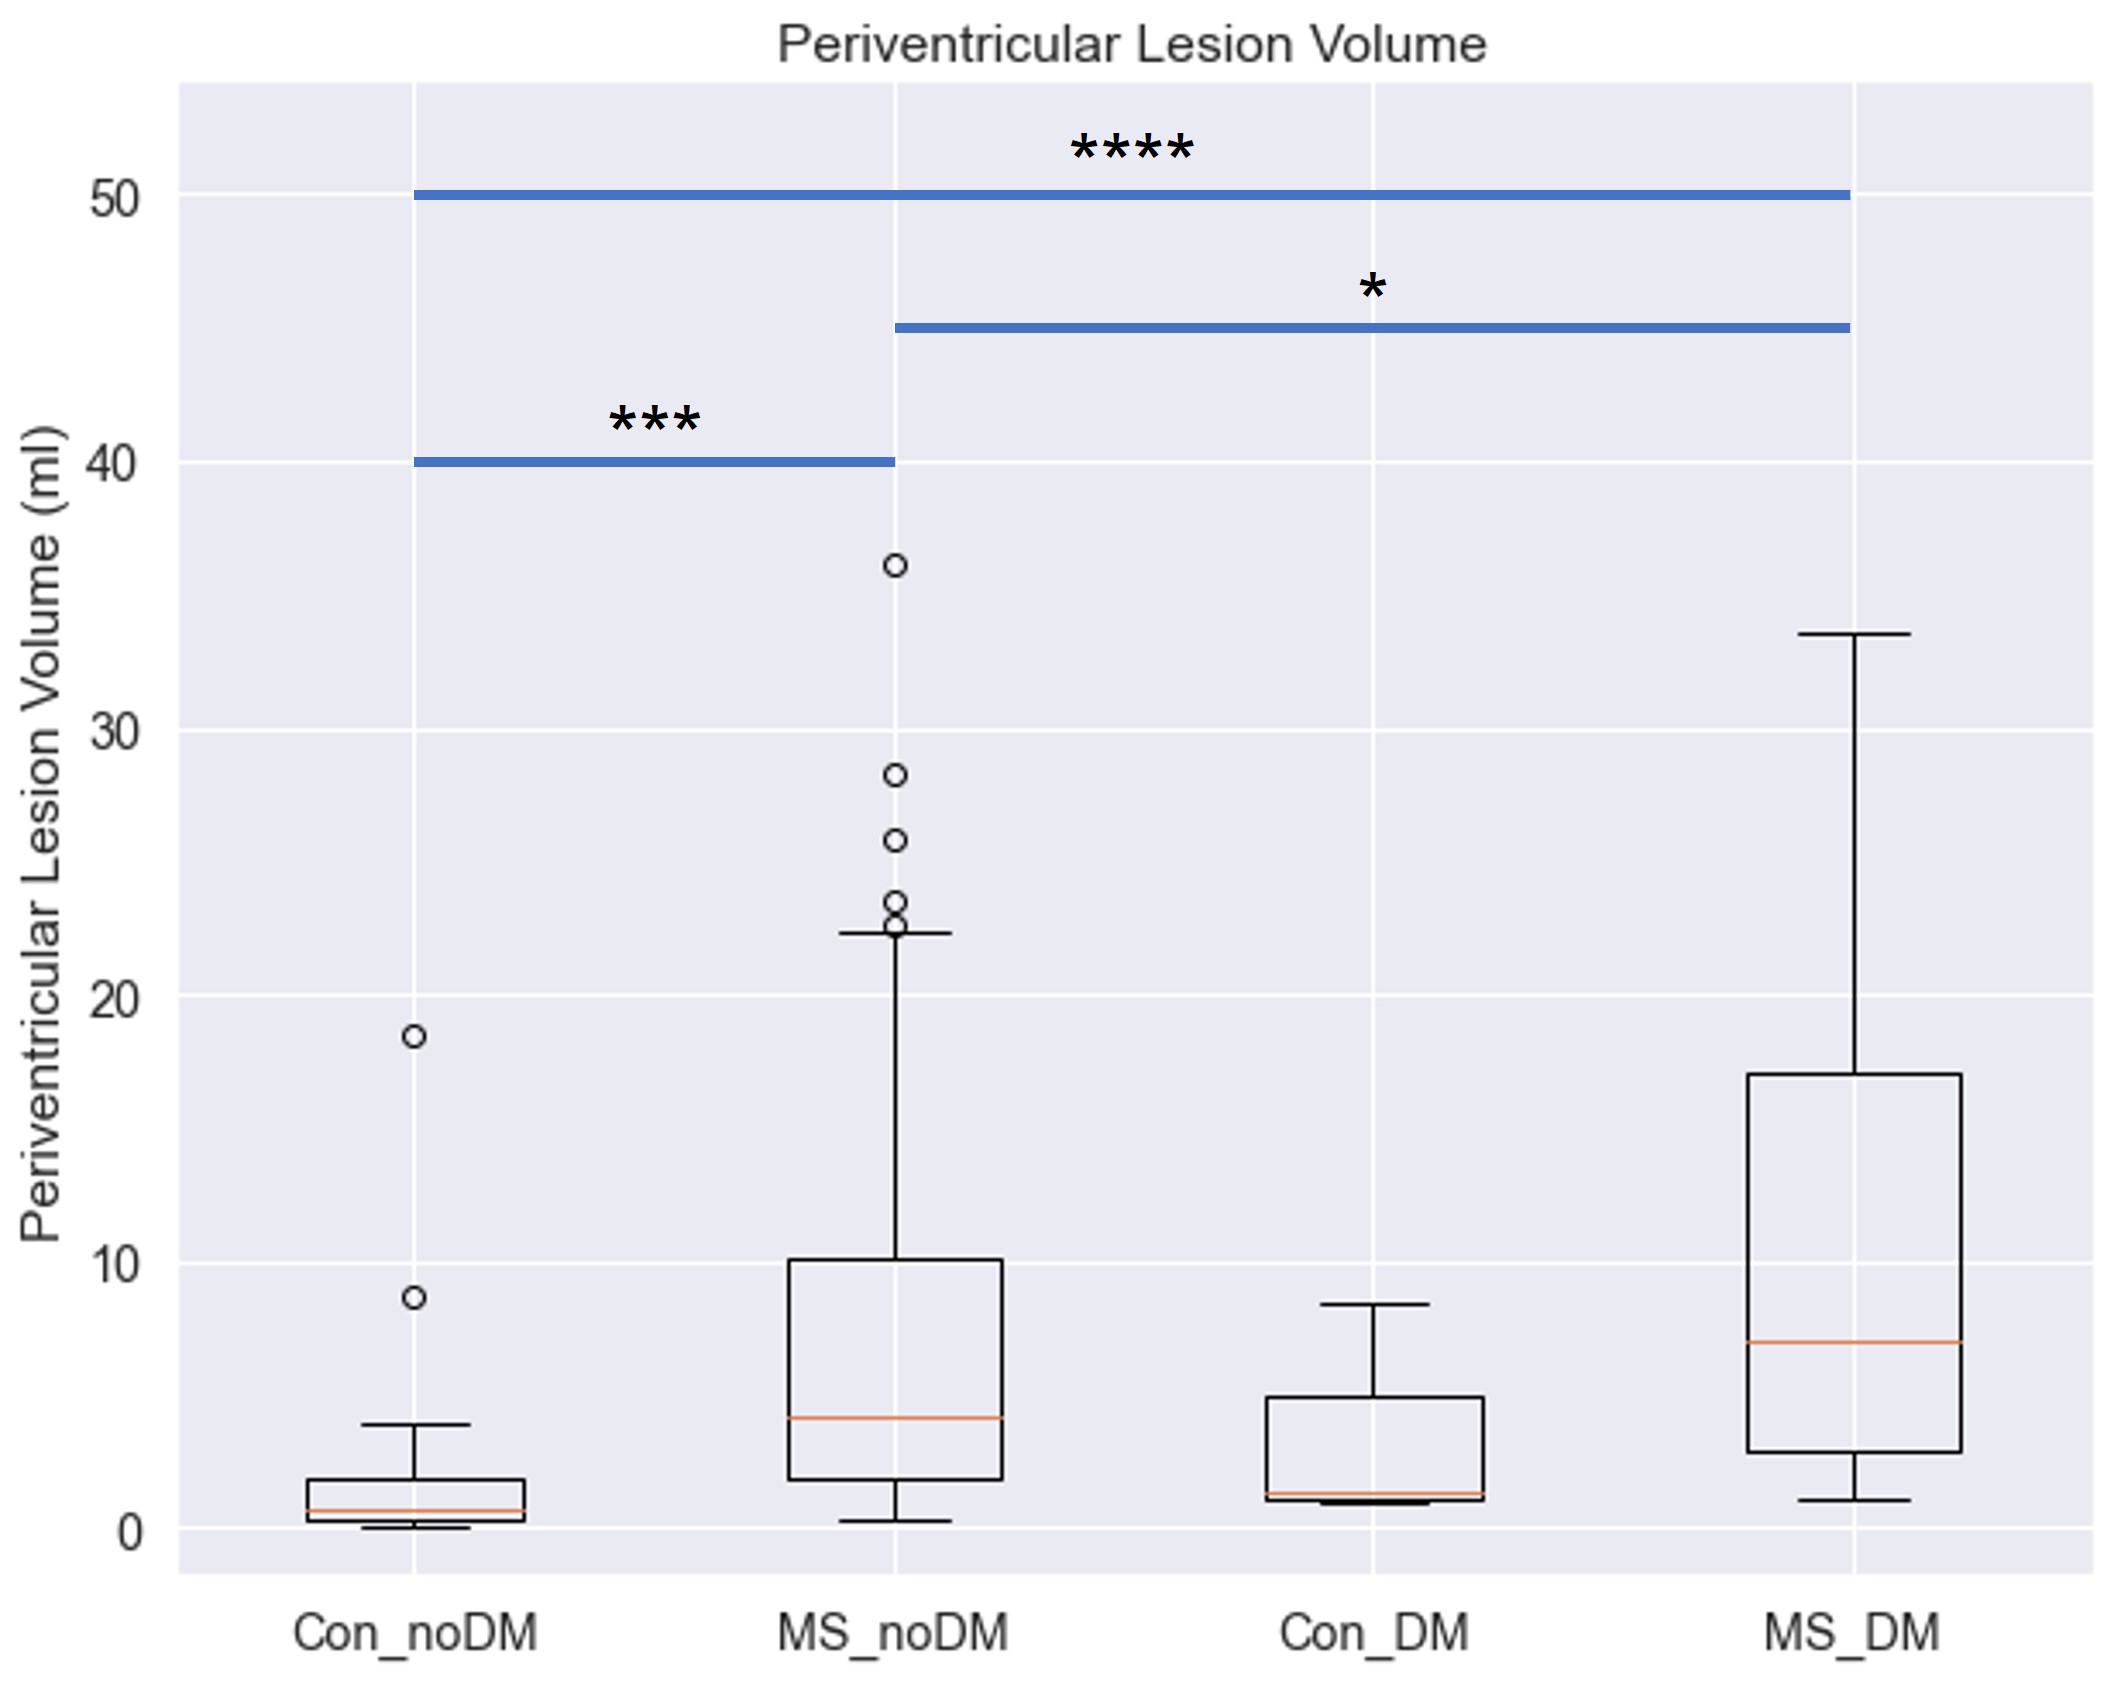
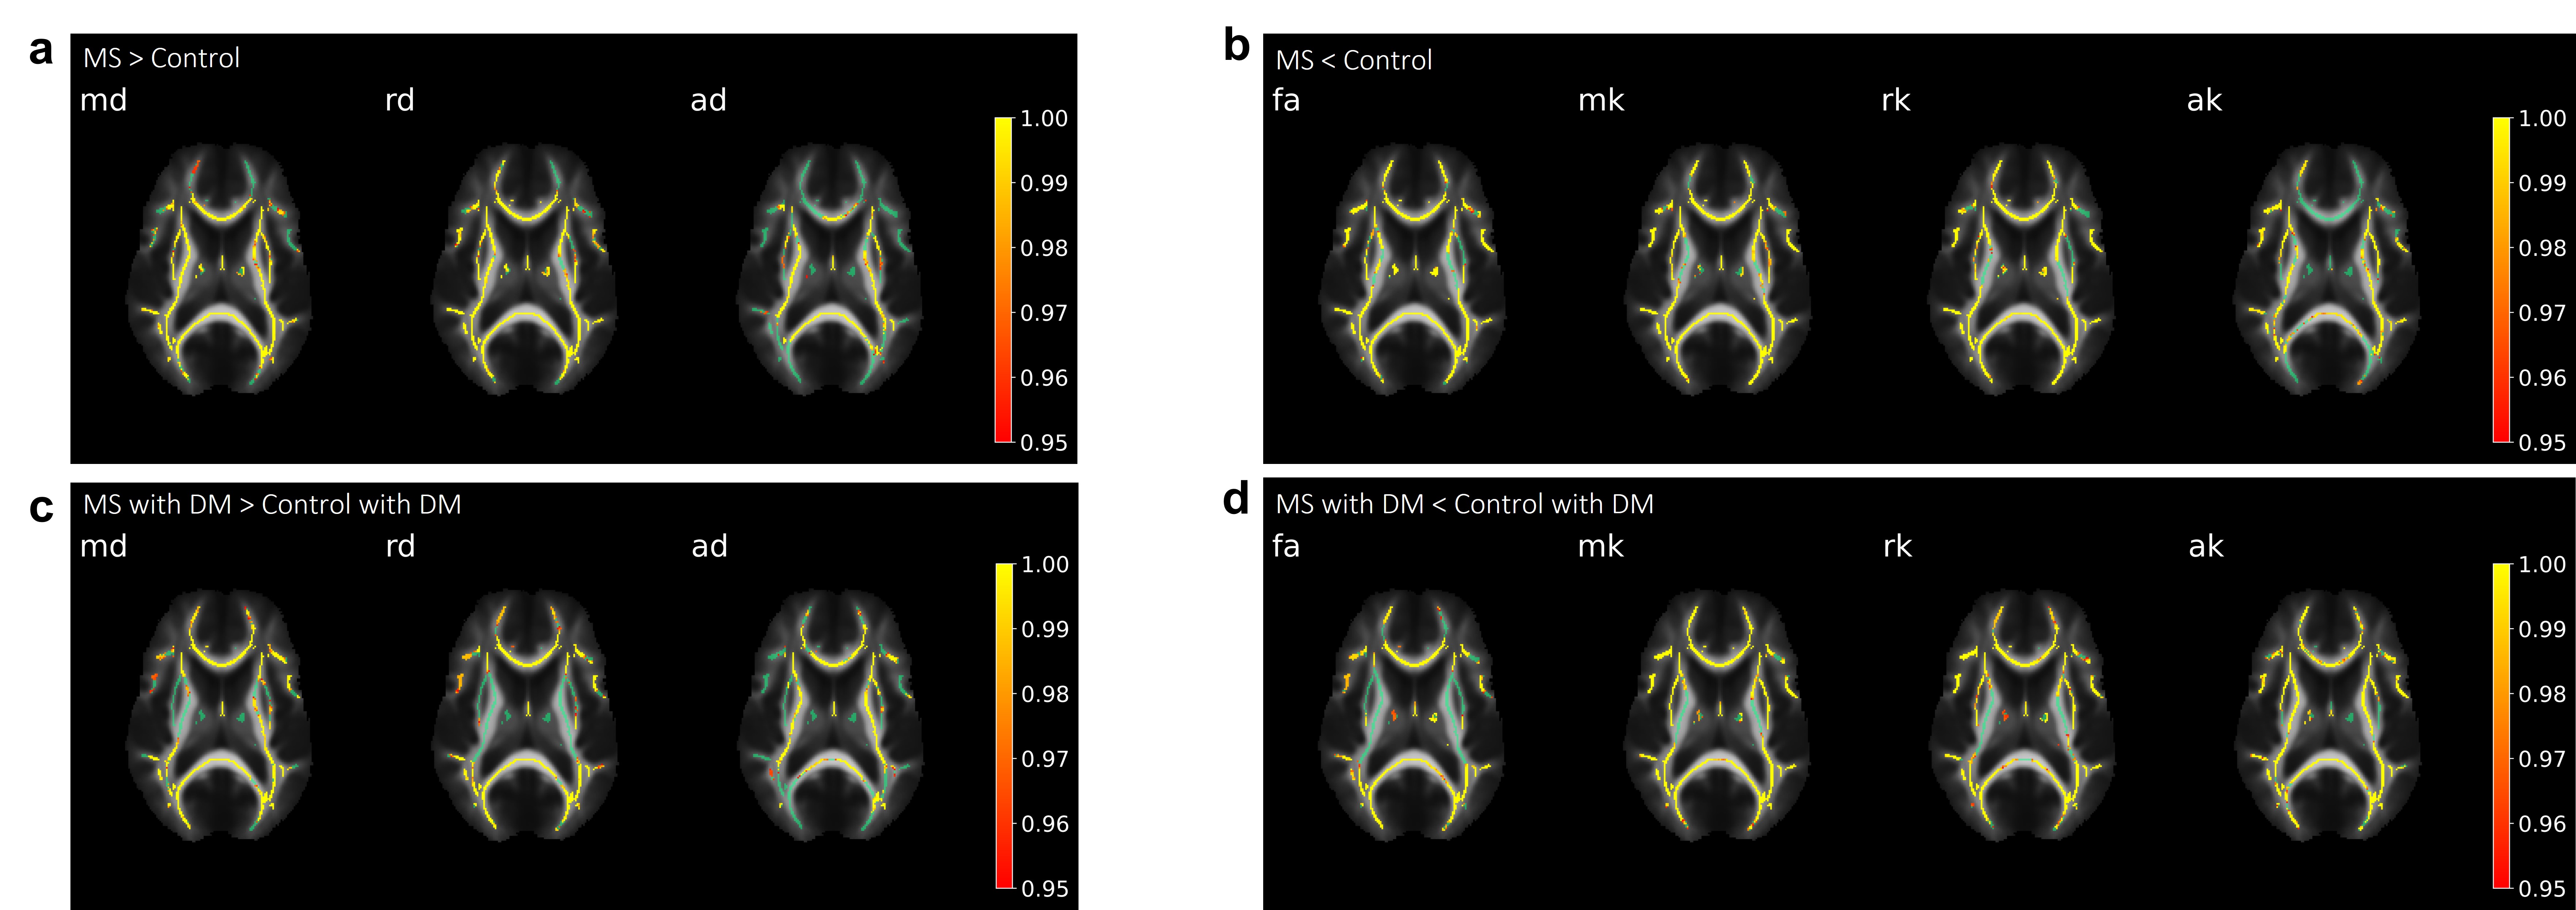
TBSS analysis demonstrated that MS patients with DM have significantly increased MD, RD, and AD and decreased MK, RK, AK, and FA in the corpus callosum compared to Controls with DM, and MS patients and Controls without DM demonstrated a similar relationship (Fig. 1). MS patients with DM also exhibited significantly increased MD, RD, AD, and AK and decreased FA compared to MS patients without DM, while Controls with DM lacked many of these changes, only demonstrating significantly decreased FA and RK compared to Controls without DM (Fig. 2).Patient volumetric data demonstrated that MS patients with and without DM have significantly increased lesion volume compared to Controls without DM (Fig. 3, MS patients without DM: 282% increase, p<0.0001; MS patients with DM: 453% increase, p<0.0001). MS patients with DM also demonstrated significantly increased periventricular lesion volume compared to both MS patients and Controls without DM (Fig. 4, 60% increase compared to MS patients without DM, p=0.02; 539% increase compared to Controls without DM, p<0.0001).
Discussion
The increased MD, RD, and AD and decreased MK, RK, AK, and FA observed in patients with MS compared to Controls indicate increased inflammation and axonal demyelination10, validating the TBSS analysis as MS patients reasonably demonstrate worsening pathology. Moreover, the increased MD, RD, AD, and AK and decreased FA observed in MS patients with DM compared to MS patients without DM is notable, as it suggests that DM may be associated with worsening microstructural change in MS patients. Particularly, the increases in D have been associated with increasing neurodegeneration, and of note is the increase in AK, which has been linked to axonal beading or inflammation in studies on acute ischemia11. Remarkably, these differences are not seen between Controls with and without DM, suggesting that, although DM may be associated with worsening white matter tract integrity in MS patients, it is not sufficient to cause microstructural damage in Controls.The increased periventricular lesion load in MS patients with DM compared to MS patients without DM has also been attributed to worsening prognosis, with “Dawson’s Fingers” being a prominent indicator of MS, and the lack of difference in Controls similarly suggests that DM may worsen MS pathology12.
Potential limitations of this study include the lack of control for disease duration and treatment, which may contribute to the observed differences in microstructural pathology, and the study population size.
Conclusion
We have demonstrated that DM may serve a potential exacerbating role for worsening MS prognosis and white matter tract integrity through increasing inflammation, demyelination, and lesion load, but is itself not sufficient to induce these changes. Our results suggest that DM may be a useful indicator of worsening MS, allowing for the development and application of earlier interventional therapies for patients to help manage their disease burden prior to worsening symptom onset.Acknowledgements
This work was supported by NIH under awards R01 NS088040 and P41 EB017183 and by the New York University Grossman School of Medicine National Institute of Diabetes & Digestive & Kidney Diseases Summer Research Fellowship for MD Students.
Thank you to Dr. Ilya Kister for his support and comments on the study.
References
1. Walton, C., King, R., Rechtman, L., Kaye, W., Leray, E., Marrie, R. A., ... & Baneke, P. (2020). Rising prevalence of multiple sclerosis worldwide: Insights from the Atlas of MS. Multiple Sclerosis Journal, 26(14), 1816-1821.
2. Ades-Aron, B., Veraart, J., Kochunov, P., McGuire, S., Sherman, P., Kellner, E., ... & Fieremans, E. (2018). Evaluation of the accuracy and precision of the diffusion parameter EStImation with Gibbs and NoisE removal pipeline. Neuroimage, 183, 532-543.
3. Shepherd, T. M., Ades-aron, B., Conti, B., Lui, Y., Novikov, D. S., & Fieremans, E. (2018). Advanced diffusion MRI characterization of microstructure changes associated with increasing T1 hypointensity in the white matter lesions of relapsing-remitting multiple sclerosis patients. Proc. Intl. Soc. Mag. Reson. Med. 26, 5286.
4. Steven, A. J., Zhuo, J., & Melhem, E. R. (2014). Diffusion kurtosis imaging: an emerging technique for evaluating the microstructural environment of the brain. American journal of roentgenology, 202(1), W26-W33.
5. World Health Organization. Diabetes. World Health Organization. Retrieved November 8, 2022, from https://www.who.int/news-room/fact-sheets/detail/diabetes
6. Warren, S. A., & Warren, K. G. (1982). Multiple sclerosis and diabetes mellitus: further evidence of a relationship. Canadian Journal of Neurological Sciences, 9(4), 415-419.
7. Andersson, J. L., Skare, S., & Ashburner, J. (2003). How to correct susceptibility distortions in spin-echo echo-planar images: application to diffusion tensor imaging. Neuroimage, 20(2), 870-888.
8. Veraart, J., Sijbers, J., Sunaert, S., Leemans, A., & Jeurissen, B. (2013). Weighted linear least squares estimation of diffusion MRI parameters: strengths, limitations, and pitfalls. Neuroimage, 81, 335-346.
9. Smith, S. M., Jenkinson, M., Johansen-Berg, H., Rueckert, D., Nichols, T. E., Mackay, C. E., ... & Behrens, T. E. (2006). Tract-based spatial statistics: voxelwise analysis of multi-subject diffusion data. Neuroimage, 31(4), 1487-1505.
10. Rueda-Lopes, F. C., Hygino da Cruz Jr, L. C., Doring, T. M., & Gasparetto, E. L. (2014). Diffusion-weighted imaging and demyelinating diseases: new aspects of an old advanced sequence. American Journal of Roentgenology, 202(1), W34-W42.
11. Hui, E. S., Fieremans, E., Jensen, J. H., Tabesh, A., Feng, W., Bonilha, L., ... & Helpern, J. A. (2012). Stroke assessment with diffusional kurtosis imaging. Stroke, 43(11), 2968-2973.
12. Poirion, E., Tonietto, M., Lejeune, F. X., Ricigliano, V. A., de la Motte, M. B., Benoit, C., ... & Stankoff, B. (2021). Structural and clinical correlates of a periventricular gradient of neuroinflammation in multiple sclerosis. Neurology, 96(14), e1865-e1875.
Figures
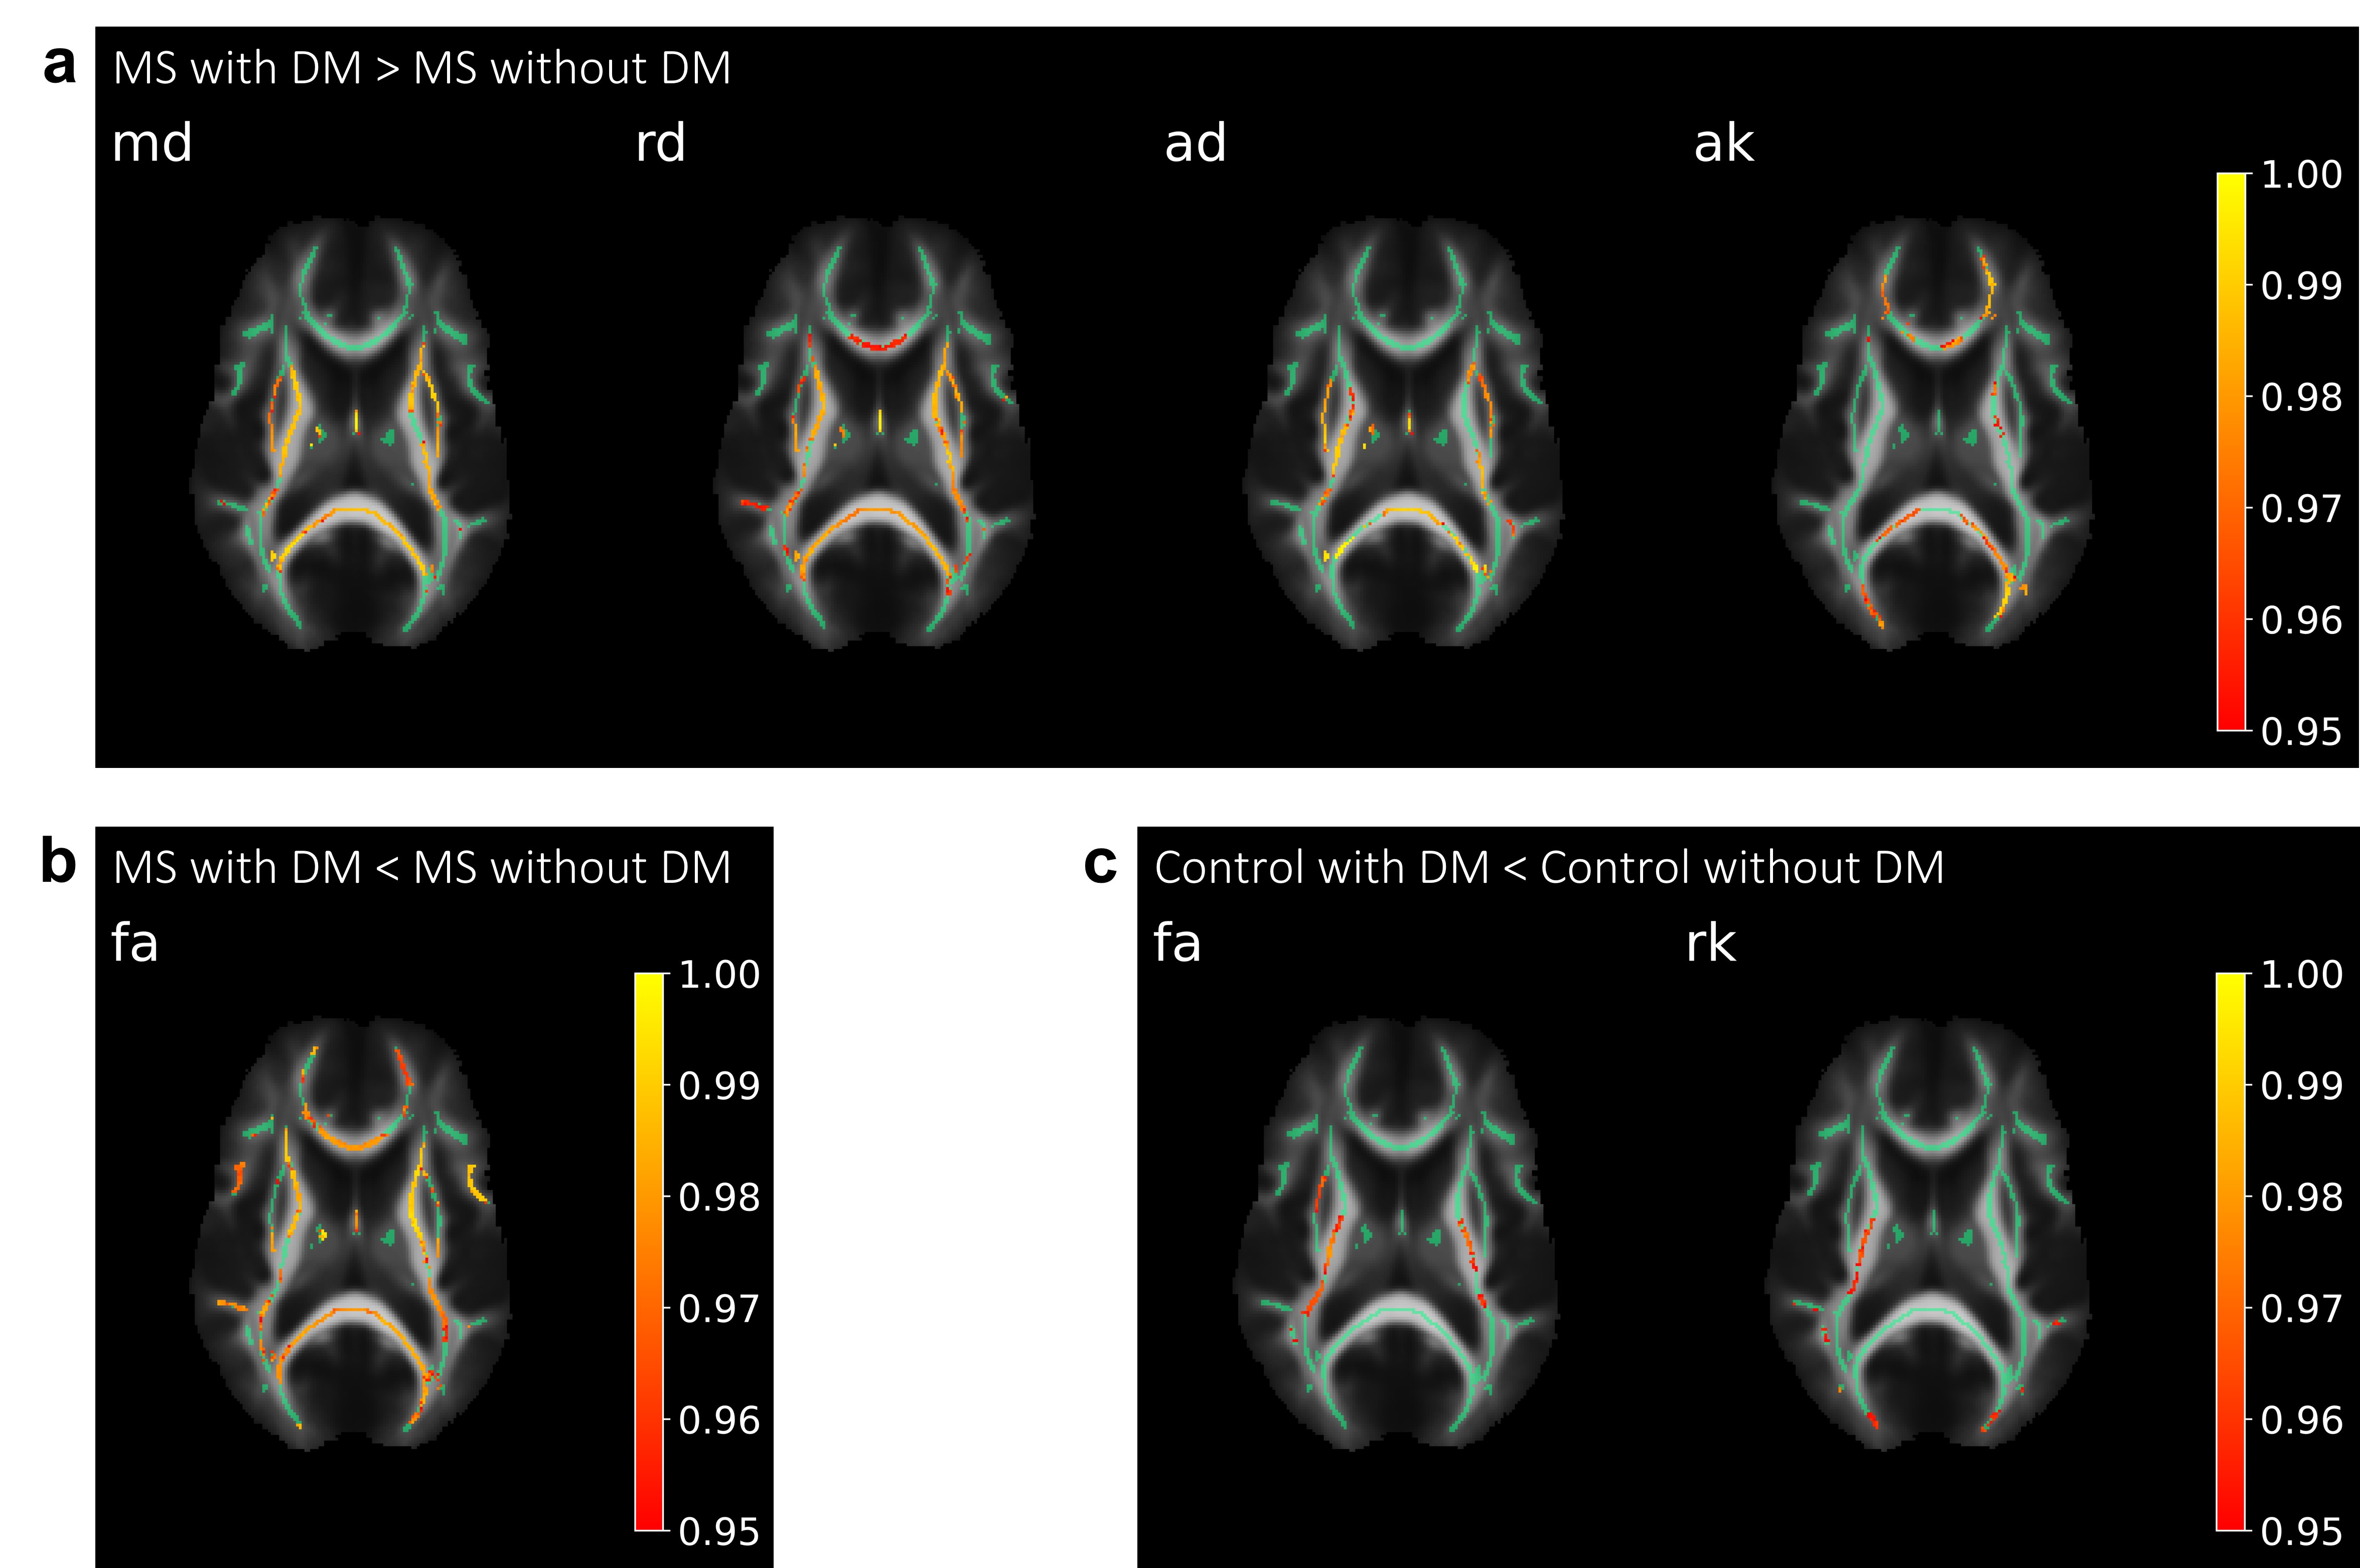
TBSS analysis comparing patients with and without DM. Significantly different tracts are overlaid on representative FA skeletonized images (green). Significance bars indicated on the right demonstrate 1-p significance values of 0.95 and greater. White matter tracts in MS patients with DM have (a) increased MD, RD, AD and AK or (b) decreased FA compared to MS patients without DM. (c) Controls with DM have decreased FA and RK compared to Controls without DM.