2608
Geometric mean T2 of the intra/extracellular water can help identify diffusely abnormal white matter in multiple sclerosis1Radiology, University of British Columbia, Vancouver, BC, Canada, 2International Collaboration on Repair Discoveries, University of British Columbia, Vancouver, BC, Canada, 3University of British Columbia, Vancouver, BC, Canada, 4Physics and Astronomy, University of British Columbia, Vancouver, BC, Canada, 5Medicine, University of British Columbia, Vancouver, BC, Canada, 6School of Biomedical Engineering, University of British Columbia, Vancouver, BC, Canada, 7Pathology & Laboratory Medicine, University of British Columbia, Vancouver, BC, Canada
Synopsis
Keywords: Multiple Sclerosis, Multiple Sclerosis, diffusely abnormal white matter, T2 relaxation
Diffusely abnormal white matter (DAWM) is seen on 25-50% of conventional brain MRI scans from all stages of multiple sclerosis (MS). From 8 advanced MRI metrics, geometric mean T2 of the intra/extracellular water (IET2) best separated MS participants with and without DAWM. Comparing IET2 to controls using z-scores, regions with an intermediate increase in IET2 (z-scores between 1-2) may identify DAWM voxels.Introduction
Diffusely abnormal white matter (DAWM) is a common, yet understudied, feature found on brain MRI in 25-50% of people with multiple sclerosis (MS). DAWM is defined as diffuse areas of white matter with mildly increased proton-density (PD) and T2-weighted signal, similar to grey matter and less hyperintense than focal lesions, with post-mortem histology showing myelin changes, axonal loss and blood-brain barrier breakdown1-5. DAWM contributes to MS disease4,6,7 and accurate identification is important for understanding MS pathogenesis.DAWM is most commonly identified based on PD/T2-weighted scan intensity, however, this is a very subjective definition. Advanced MRI measures may help in better defining areas of DAWM due to their quantitative nature and greater specificity to underlying pathology. Myelin water fraction (MWF8) has been histologically validated as a marker for myelin9. T1 relaxation is closely related to water content10 and intra/extracellular water geometric mean T2 relaxation (IET2) is related to water mobility and tissue microstructure. Diffusion basis spectrum imaging (DBSI) models myelinated and demyelinated axons as anisotropic diffusion tensors, and cells/extracellular space as isotropic diffusion tensors11 providing axial diffusivity (related to axonal integrity), fibre fraction (axon density12), radial diffusivity (modulated by myelin13), restricted fraction (cellularity11) and non-restricted fraction (edema12).
Objective
To determine the advanced MR metrics best able to separate MS participants with DAWM (DAWM+) from those without DAWM (DAWM–) and to develop an automated, quantitative approach for detection of DAWM using those MR metrics.Methods
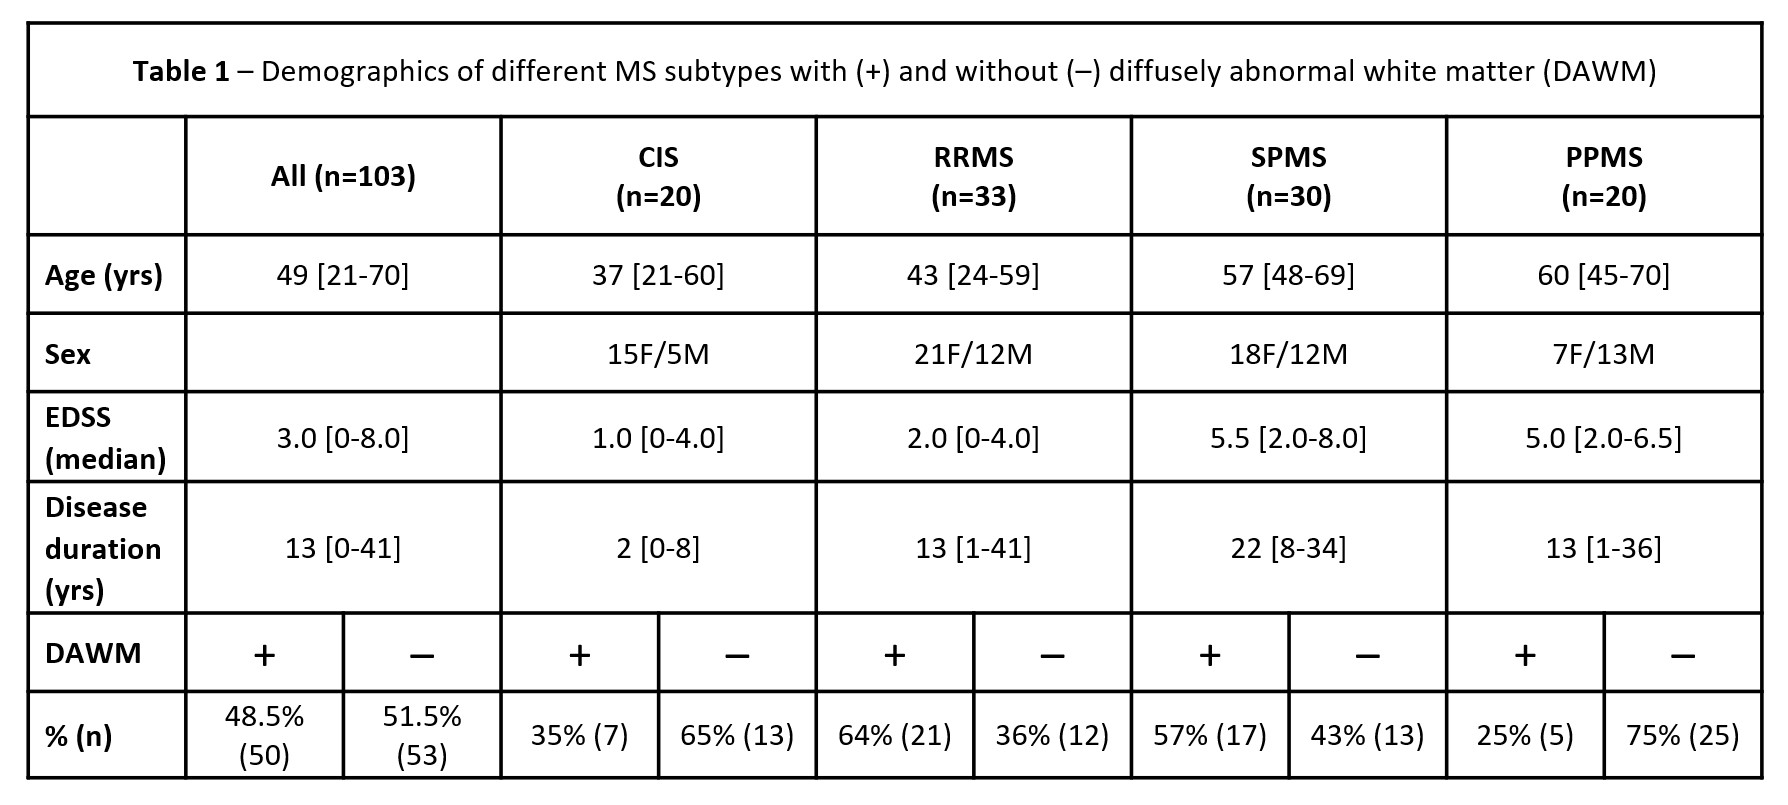
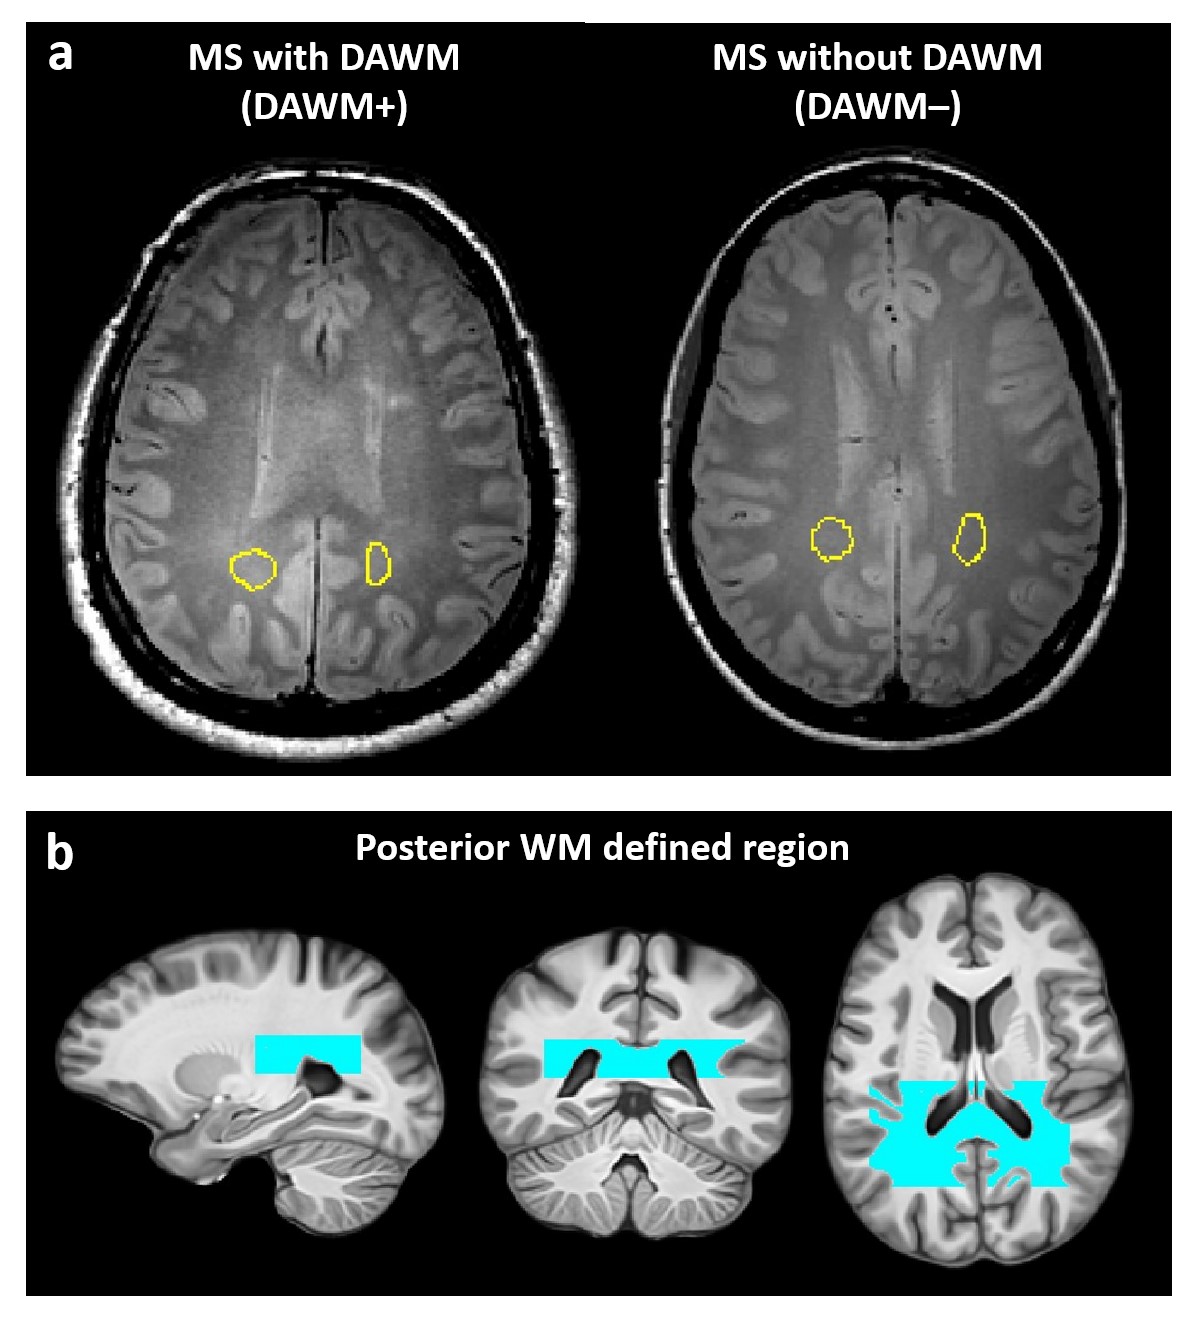
Subjects and MR Experiments: 103 MS participants (Fig.1) were scanned at 3T (Philips Achieva). Scanning sequences included 48-echo GRASE T2 relaxation (TR/TE=1073/8ms, 1x1x2.5mm3, slices=40)14, inversion recovery T1 (TIs=150,400,750,1200,2100ms, TR=3000ms, 1x1x2.5mm3, slices=40), DBSI (99 directions, b-values=0-1500, TR/TE=4798/79ms, 2x2x2mm3, slices=40)10, PD/T2-weighted (TR/TE1/TE2=2900/8.42/80ms, 1x1x3mm3), 3DT1-MPRAGE (TR/TE/TI=3000/3.5/926ms, 1x1x1mm3).Data Analysis/Statistics: Voxel-wise T2 distributions were calculated using non-negative least squares (MWF: fractional signal T2<40ms; IET2: mean 40<T2<200ms).15,16 T1 was fit to a single exponential. DBSI data was analysed to calculate DBSI metric maps12. Metric maps were registered to 3DT1 (FLIRT, FSL toolbox)17. White matter (WM) masks were created on the 3DT1 (FAST18). Lesions were automatically segmented using seed points19. DAWM+ and DAWM– participants were identified by consensus by three experienced MRI researchers. DAWM and similarly located normal-appearing white matter (NAWM) areas in the DAWM– subjects were delineated (Fig.2a). Masks were overlaid onto registered MRI metric maps to obtain mean measurements in WM, lesions and DAWM/NAWM-matched areas.
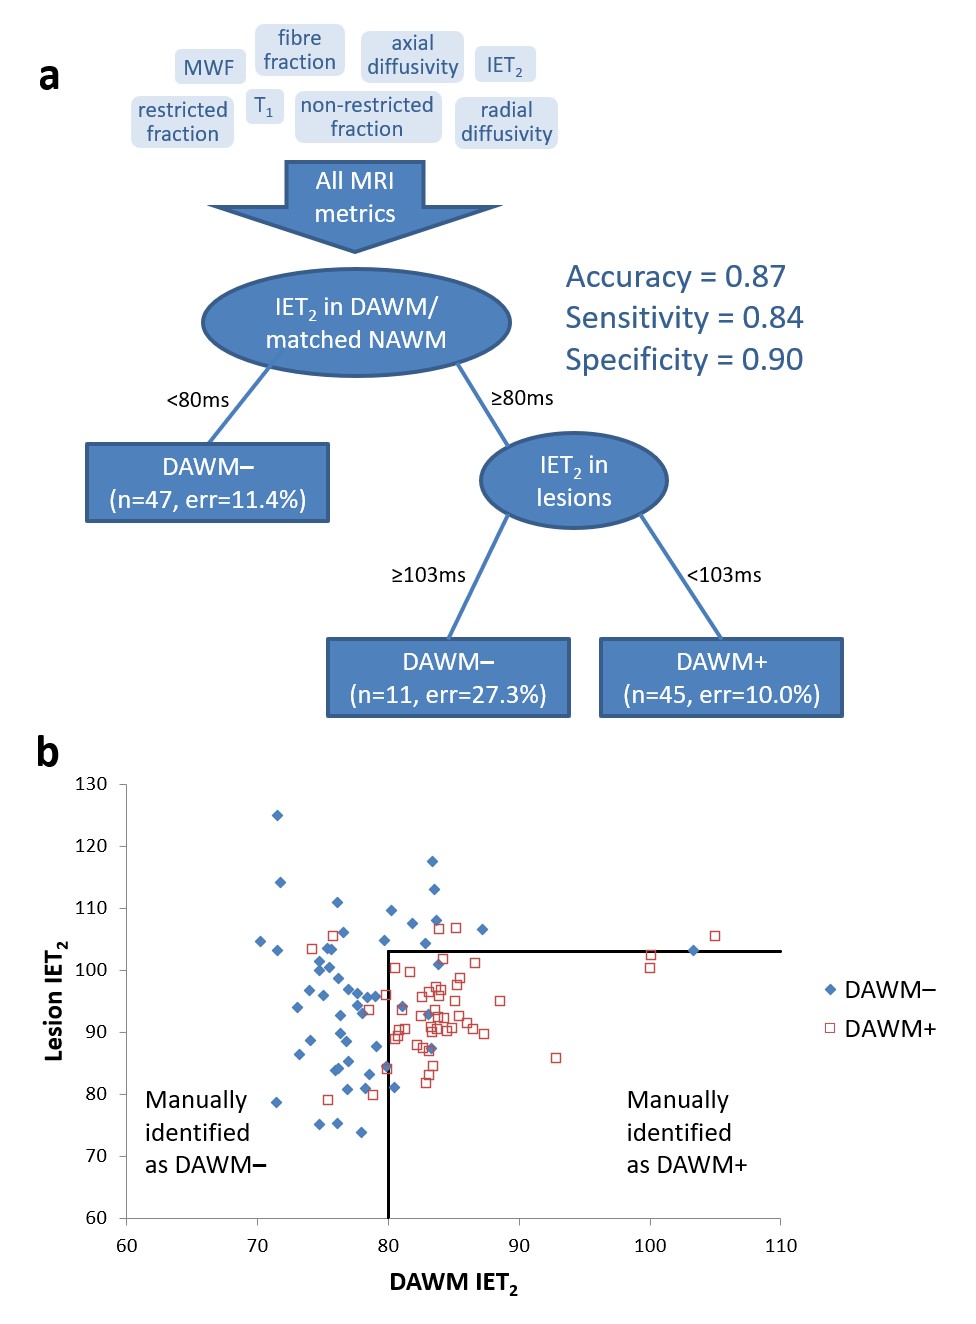
MR metrics means of each tissue mask were entered into a classification tree to identify which of the MR metrics were best able to separate DAWM+ from DAWM– participants (RStudio 2022.02.2). Z-score maps of the best DAWM+/DAWM– separator were then calculated using a premade healthy control atlas from 100 participants20 (z-score=(individual MS data – mean controls)/(standard deviation of controls)). A region surrounding the posterior end of the ventricles where DAWM is most often located was delineated and used as a mask for the z-score maps (Fig.2b). The number of voxels with a z-scores >4, 1-2 and 2-3 within all NAWM and within the posterior WM-defined region was determined and compared between DAWM+ and DAWM– participants using a t-test.
Results
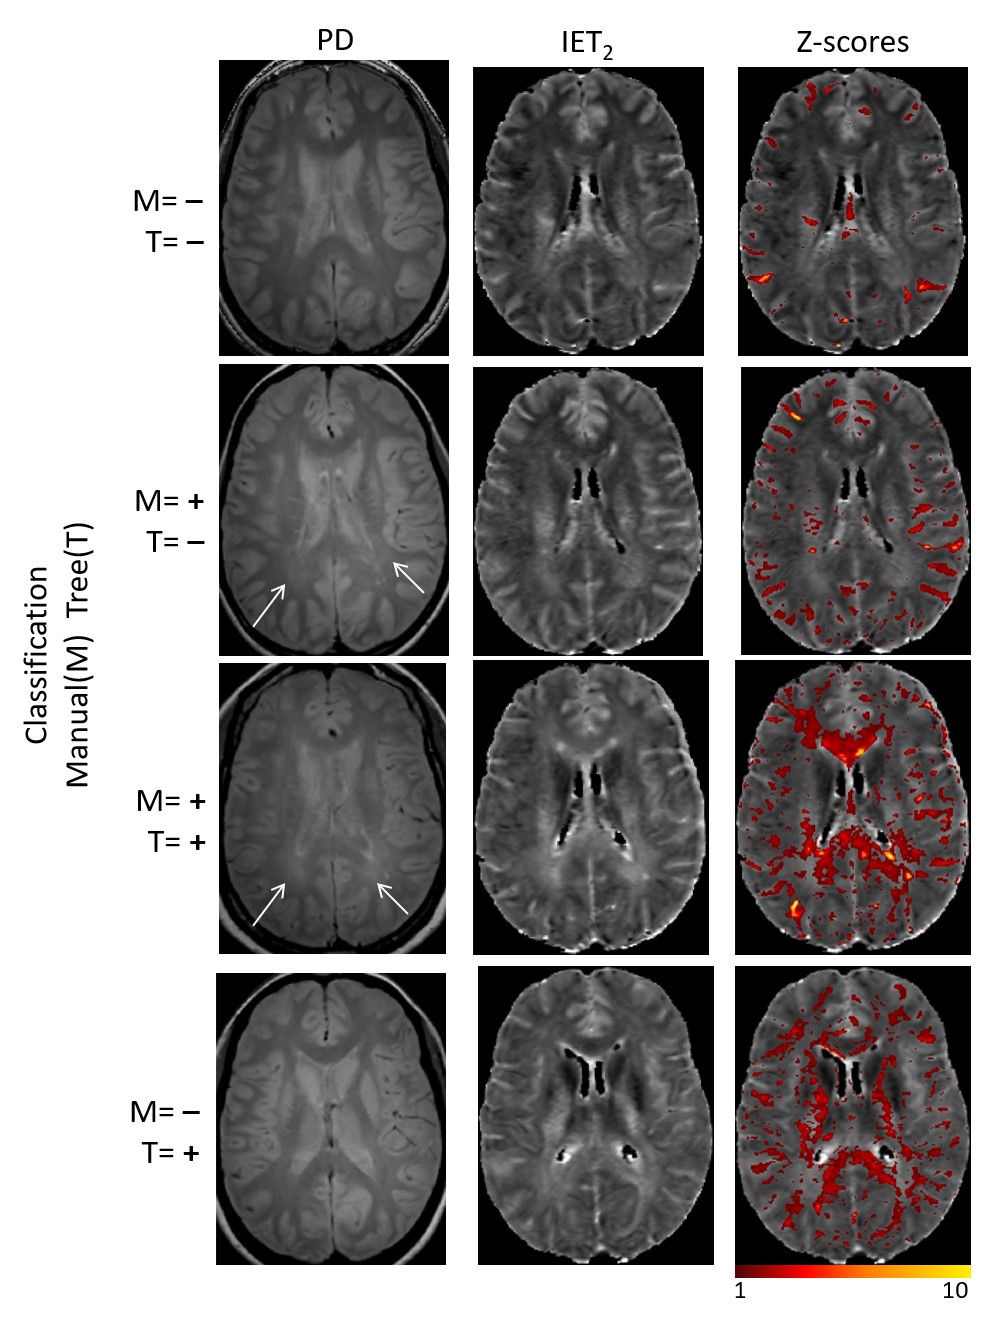
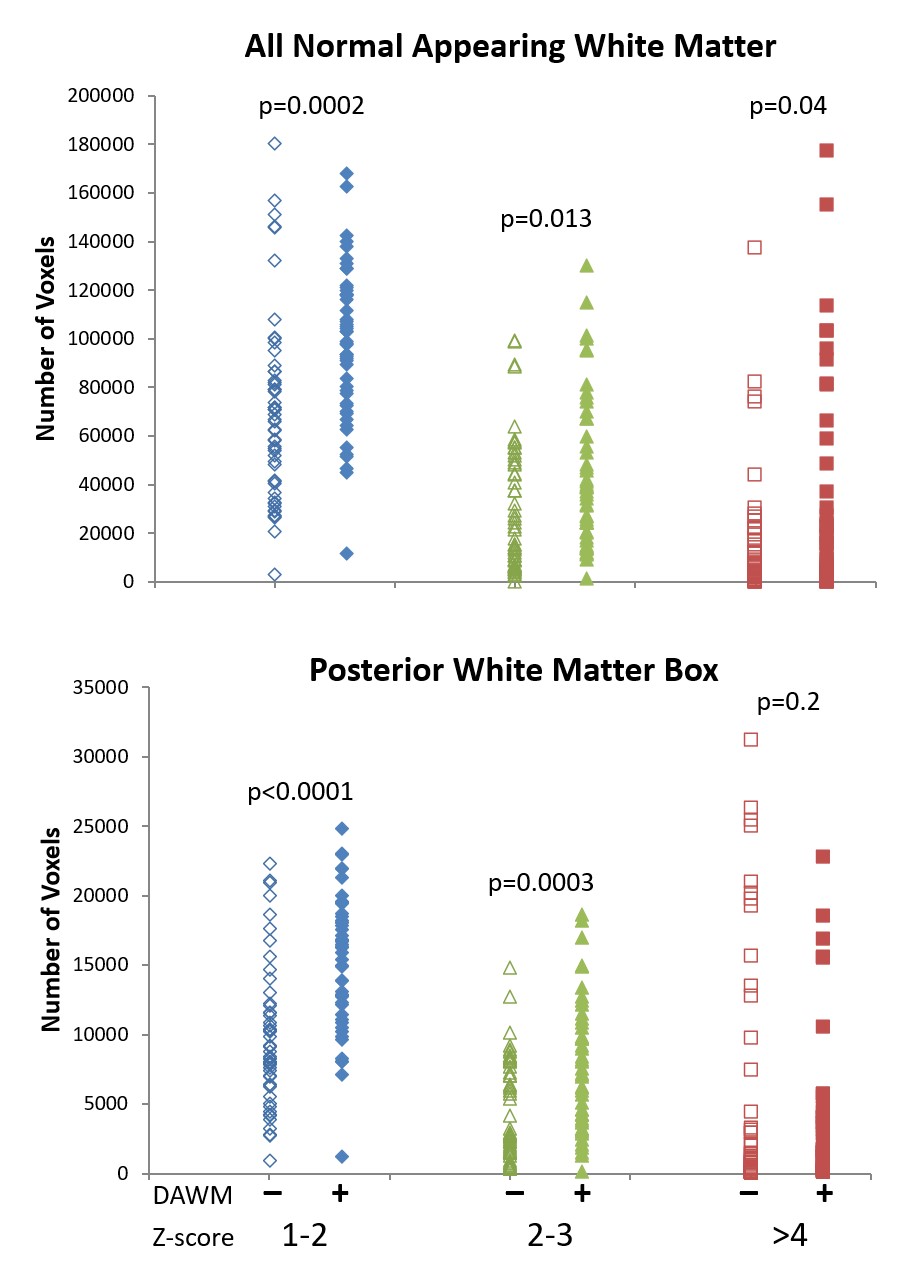
Fifty participants were identified as DAWM+ (Fig.1). From the classification tree, only IET2 in DAWM/matched-NAWM and lesions were used to best separate DAWM+ and DAWM– participants (Fig.3a). 5 participants were misclassified as DAWM+ and 9 as DAWM– (Fig.3b). Fig.4 shows example images from DAWM+ and DAWM– participants. Comparing DAWM+ and DAWM–:- the difference in the number of voxels with elevated z-score values was more significant within the posterior WM-defined region than all NAWM.
- a difference was found in the number of voxels with z-score>4 in all NAWM (p=0.04) but not in the posterior defined WM region (p=0.2) (Fig.5).
- the number of voxels with z-scores between 1-2 (all NAWM p=0.0002; posterior WM p<0.0001) and 2-3 (all NAWM p=0.012; posterior WM p=0.0003) was different between DAWM+ and DAWM– (Fig.5).
- The number of voxels with z-scores between 1-2 had the lowest p-value in both all NAWM and posterior WM regions.
Discussion
The classification tree, which maximises the separation of DAWM+ and DAWM– participants while also keeping the number of measures included low, showed that a mean IET2 < 80ms within the DAWM/NAWM-matched regions indicated no DAWM. Areas of DAWM have previously shown elevated IET221, likely representing areas of tissue edema and/or inflammation. If the DAWM/NAWM-matched areas had a mean IET2 >80ms, then if the mean IET2 of lesions was >103ms, the participant was classified as DAWM–. Lesions with large IET2 may be more extensive which makes the identification of subtle intensity changes from DAWM difficult to detect leading to a DAWM– labeling. Voxels with a z-score >4 likely represent lesional areas whereas DAWM is less abnormal and therefore more likely in the z-score range from 1-3. By limiting our region of interest to areas where DAWM predominates and using a z-score range of 1-2, we get better separation of DAWM+ and DAWM– participants.Conclusion
DAWM is most commonly identified based on PD/T2-weighted scan intensity, however, a more objective method of identification is needed. Using intermediately increased z-scores (1-2) in IET2 may identify DAWM+ voxels with less subjectivity. Incorporation of advanced imaging metrics into tissue classification may lead to more objective DAWM identification in the future.Acknowledgements
We would like to thank the MS volunteers and the staff at the UBC MRI Research Centre and UBC MS Clinic. This study was funded by the Multiple Sclerosis Society of Canada and by the VGH and UBC Hospital Foundation. This work was conducted on the traditional, ancestral, and unceded territories of Coast Salish Peoples, including the territories of the xwməθkwəy̓əm (Musqueam), Skwxwú7mesh (Squamish), Stó:lō and Səl̓ílwətaʔ/Selilwitulh (Tsleil- Waututh) Nations.References
1. Laule C, Pavlova V, Leung E, Zhao G, MacKay AL, Kozlowski P, Traboulsee AL, Li DK, Moore GR. Diffusely abnormal white matter in multiple sclerosis: further histologic studies provide evidence for a primary lipid abnormality with neurodegeneration. J Neuropathol Exp Neurol. 2013; 72: 42-52.
2. Moore GR, Laule C, Mackay A, Leung E, Li DK, Zhao G, Traboulsee AL, Paty DW. Dirty-appearing white matter in multiple sclerosis: preliminary observations of myelin phospholipid and axonal loss. J Neurol. 2008; 255: 1802-11.
3. Vos CM, Geurts JJ, Montagne L, van Haastert ES, Bö L, van der Valk P, Barkhof F, de Vries HE. Blood-brain barrier alterations in both focal and diffuse abnormalities on postmortem MRI in multiple sclerosis. Neurobiol Dis. 2005; 20: 953-60.
4. Vertinsky AT, Li DKB, Vavasour IM, Miropolsky V, Zhao G, Zhao Y, Riddehough A, Moore GRW, Traboulsee A, Laule C. Diffusely Abnormal White Matter, T2 Burden of Disease, and Brain Volume in Relapsing-Remitting Multiple Sclerosis. J Neuroimaging. 2019; 29: 151-159.
5. Vrenken H, Seewann A, Knol DL, Polman CH, Barkhof F, Geurts JJ. Diffusely abnormal white matter in progressive multiple sclerosis: in vivo quantitative MR imaging characterization and comparison between disease types. AJNR Am J Neuroradiol. 2010; 31: 541-8.
6. Holmes RD, Vavasour IM, Greenfield J, et al. Nonlesional diffusely abnormal appearing white matter in clinically isolated syndrome: Prevalence, association with clinical and MRI features, and risk for conversion to multiple sclerosis. J Neuroimaging 2021;31(5):981-994.
7. Dadar M, Narayanan S, Arnold DL, Collins DL, Maranzano J. Conversion of diffusely abnormal white matter to focal lesions is linked to progression in secondary progressive multiple sclerosis. Mult Scler 2021;27(2):208-219.
8. MacKay A, Whittall K, Adler J, et al. In vivo visualization of myelin water in brain by magnetic resonance. Magn Reson Med. 1994; 31(6): 673-677.
9. Laule C, Kozlowski P, Leung E, et al. Myelin water imaging of multiple sclerosis at 7 T: correlations with histopathology. Neuroimage. 2008; 40(4): 1575-1580.
10. Fatouros PP, Marmarou A, Kraft KA, et al. In Vivo Brain Water Determination by T1 Measurements: Effect of Total Water Content, Hydration Fraction, and Field Strength. Magn Reson Med. 1991; 17(2): 402-413.
11. Wang Y, Wang Q, Haldar JP, et al. Quantification of increased cellularity during inflammatory demyelination. Brain. 2011; 134: 3590–3601.
12. Wang Y, Sun P, Wang Q, et al. Differentiation and quantification of inflammation, demyelination and axon injury or loss in multiple sclerosis. Brain. 2015; 138: 1223–1238.
13. Song SK, Sun SW, Ju WK, et al. Diffusion tensor imaging detects and differentiates axon and myelin degeneration in mouse optic nerve after retinal ischemia. Neuroimage. 2003; 20: 1714–22.
14. Zhang J, Vavasour I, Kolind S, et al. Advanced Myelin Water Imaging Techniques for Rapid Data Acquisition and Long T2 Component Measurements. ISMRM. 2015; p824.
15. Prasloski T, Mädler B, Xiang Q-S, et al. Applications of stimulated echo correction to multicomponent T2 analysis. Magn Reson Med. 2012; 67: 1803–1814.
16. Whittall KP and MacKay AL. Quantitative interpretation of NMR relaxation data. J Magn Reson. 1989; 84: 134–152.
17. Jenkinson M, Bannister PR, Brady JM, and Smith SM. Improved optimisation for the robust and accurate linear registration and motion correction of brain images. NeuroImage. 2002; 17(2):825-841.
18. Zhang Y, Brady M, Smith S. Segmentation of brain MR images through a hidden Markov random field model and the expectation-maximization algorithm. IEEE Trans Med Imag. 2001; 20(1):45-57.
19. McAusland J, Tam RC, Wong E, et al. Optimizing the Use of Radiologist Seed Points for Improved Multiple Sclerosis Lesion Segmentation. IEEE TransBiomed Eng. 2010; 57:2689–2698.
20. Dvorak AV, Swift-LaPointe T, Vavasour IM, et al. An atlas for human brain myelin content throughout the adult life span. Scientific Reports 2021; 11:269.
21. Vavasour IV, Sun P, Graf G, et al. Characterisation of multiple sclerosis neuroinflammation and neurodegeneration with relaxation and diffusion basis spectrum imaging. Mult Scler. 2022;28(3):418-428.
Figures