2602
Assessment of Rabbit Intervertebral Disc Degeneration Using Quantitative MR Imaging1Radiology, UC San Diego, San Diego, CA, United States, 2Bioengineering, UC San Diego, San Diego, CA, United States, 3Orthopedic Surgery, UC San Diego, San Diego, CA, United States, 4Radiology, Veterans Affairs San Diego Healthcare System, San Diego, CA, United States
Synopsis
Keywords: MSK, Joints, Intervertebral disc
Intervertebral disc degeneration is a leading cause of disability. In this study, quantitative T2 and ultrashort echo time magnetization transfer ratio (UTE-MTR) measurement techniques are utilized to assess biochemical component changes for better understanding of the mechanism of disc degeneration using a rabbit spinal intervertebral disc degeneration model. Both T2 and UTE-MTR values of nucleus pulposus (NP) are significantly different between normal and degenerated discs, indicating water and/or proteoglycan content changes.Introduction
The intervertebral disc (IVD) situated between the vertebral bodies makes up about 25–30% of the spine's entire height (1). It consists of nucleus pulposus (NP), annulus fibrosus (AF), and cartilaginous endplate (CEP), which provides mechanical support and enables spinal movement (flexion, extension, and rotation). AF is rich in collagen and serves as a laminar fibrous container, while NP is rich in proteoglycan and operates as an interior semi-fluid mass. When either of these structures get compromised, degenerative changes shall ensue because of altered mechanical force distribution (2).IVD degeneration is the primary cause of musculoskeletal disability in humans (3). Given the challenge of controlling disc degeneration status in the human spine, animal models become essential in defining the transition from scientific concepts to clinical applications (4).
In this work, quantitative T2 and ultrashort echo time magnetization transfer ratio (UTE-MTR) measurement techniques are utilized to assess biochemical component changes for better understanding of the mechanism of disc degeneration using a rabbit spinal IVD degeneration model.
Methods
A total of 10 New Zealand White (NZW) rabbits were involved in this study. Under general anesthesia, lumbar discs of L23 and L45 were subject to a 18G needle punctures to produce IVD degeneration and then subjected to a saline injection at 4 weeks (5). L34 serves as the normal non-puntured control. MRI scan of the lumbar specimen was performed on a Bruker 3T scanner after a period of 8 weeks. The CPMG and UTE-MT sequences were used for T2 and MTR mapping, respectively, to evaluate the disc degeneration (6). For data analysis, each disc was manually segmented into the following sections: NP, anterior AF, and posterior AF.The sequence parameters are provided below: 1) CPMG: repetition time (TR)=2500ms, 22 TEs ranging from 8.7 to 191.2ms, field of view (FOV)=77.3x44mm2, matrix size=373x230, slice thickness=1mm, bandwidth=69kHz, and scan time=9min35sec; 2) UTE-MT: a Fermi shaped pulse for MT preparation (duration=8ms and bandwidth=160 Hz) with two different flip angles (FAs) of 1500° (MT on) and 0° (MT off) and a frequency offset of 2 kHz, TR/TE = 40/0.42ms, FA=15°, FOV=77.3x77.3mm2, matrix=256x256, slice thickness=1mm, bandwidth=50 kHz and scan time=5min10sec.
Results and Discussion
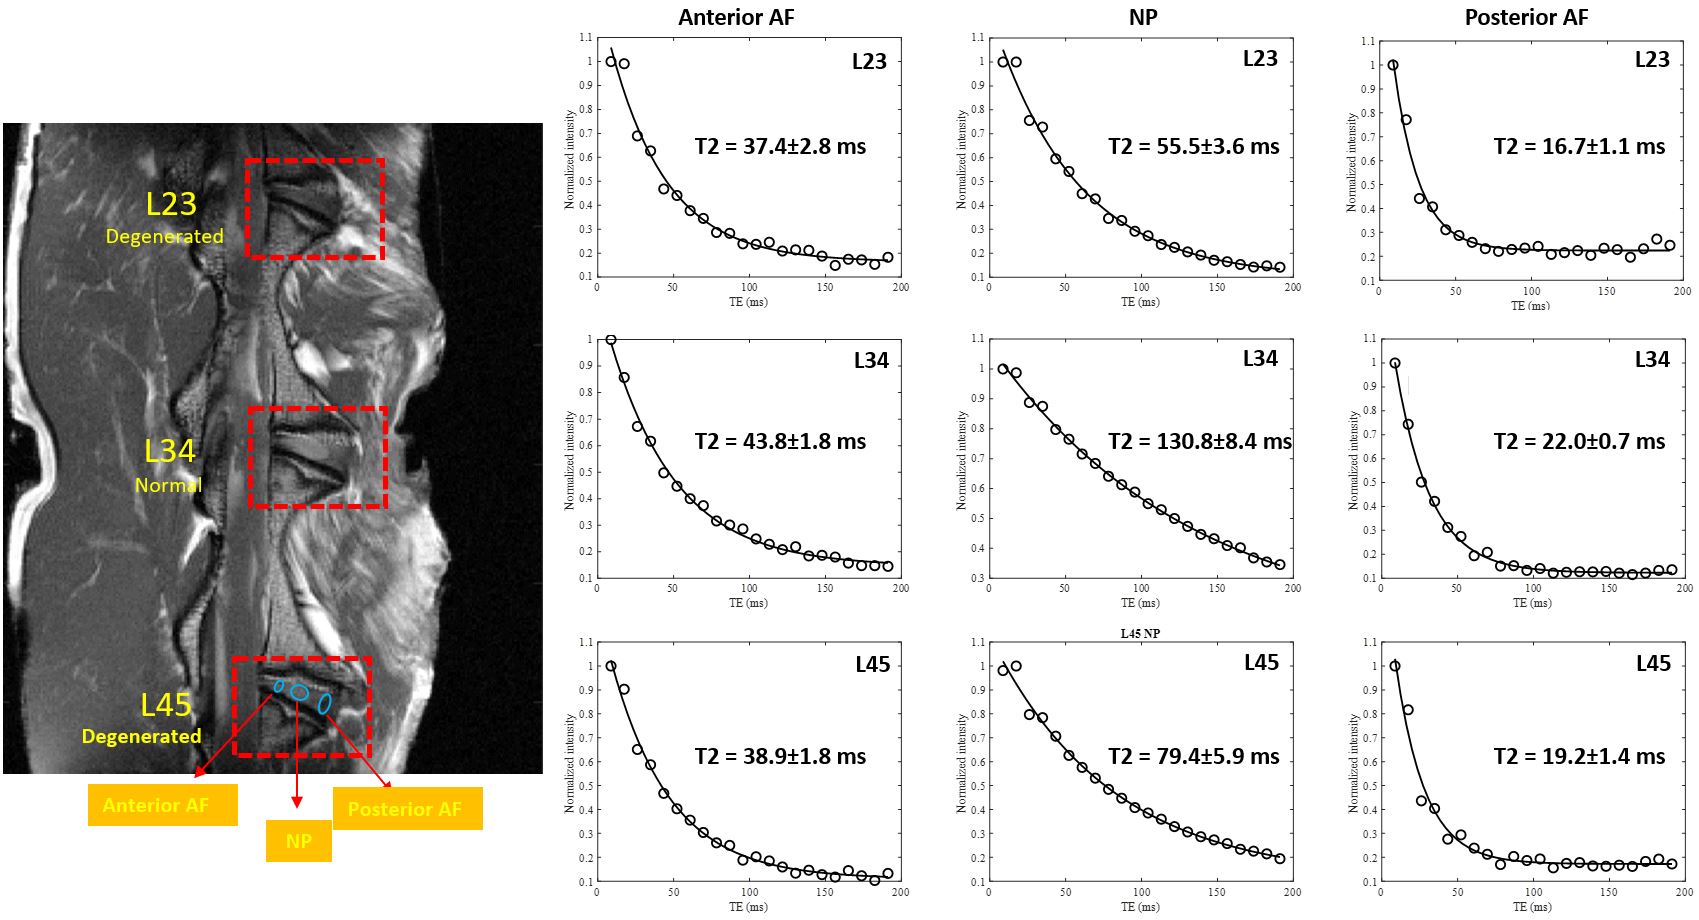
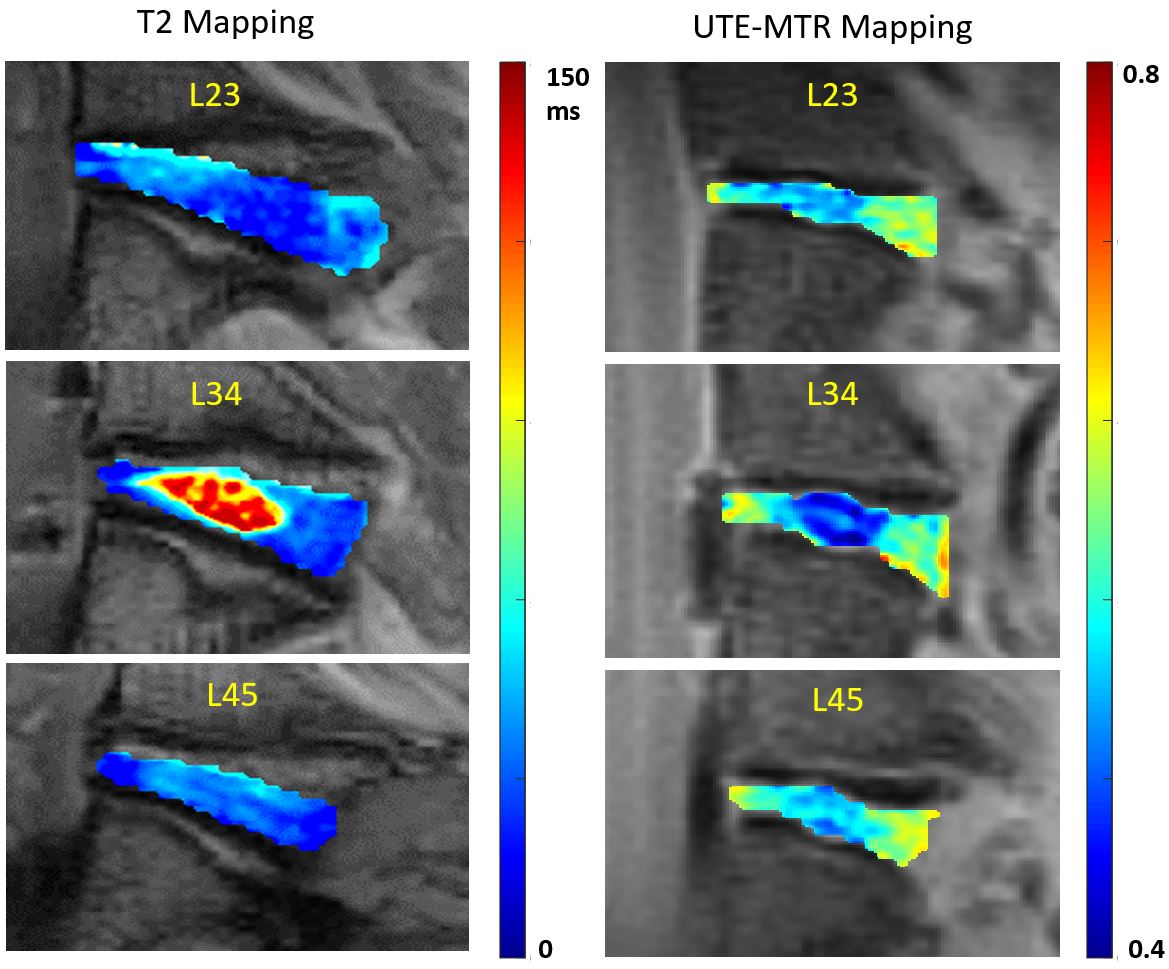
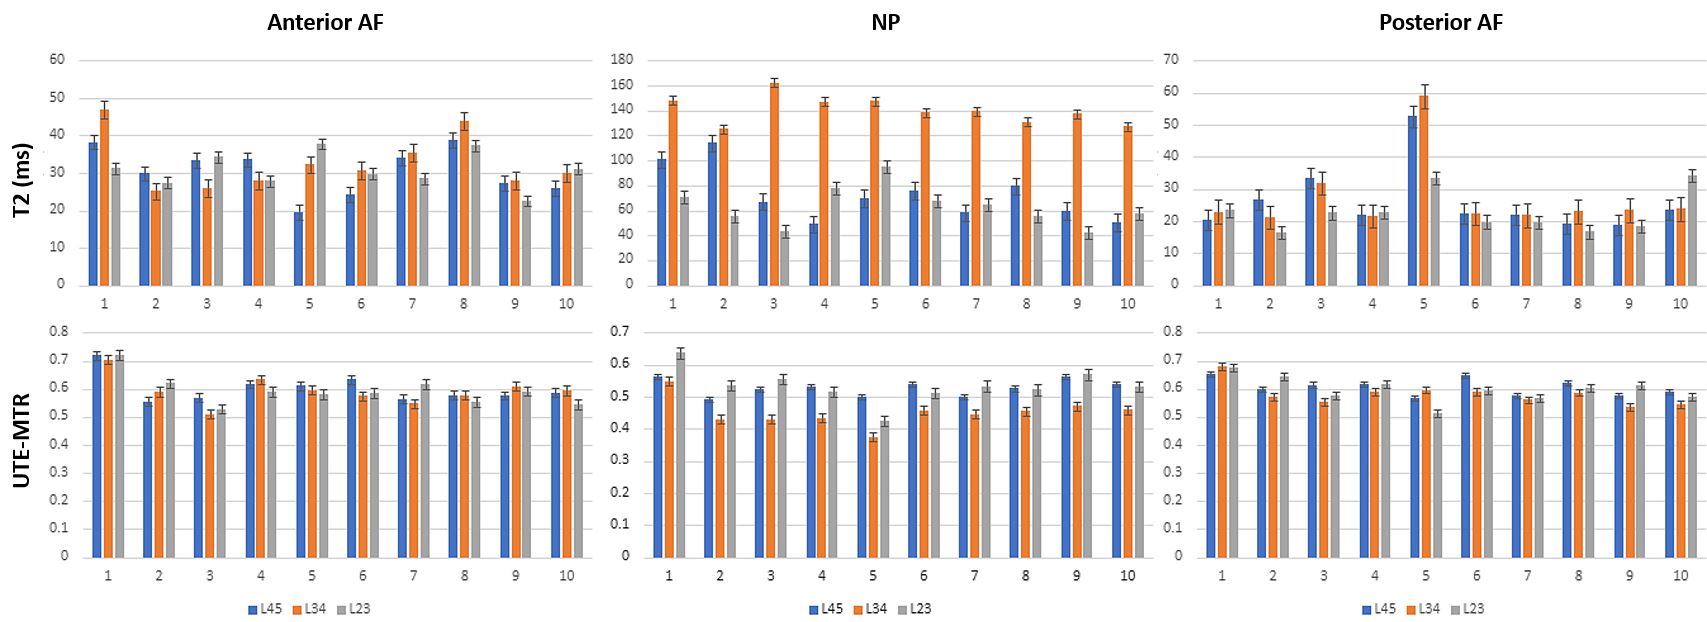
Figure 1 shows the representative fitting curves and T2 values obtained at different parts of the IVD for normal and degenerated discs from a rabbit spine sample. Figure 2 shows the corresponding T2 and UTE-MTR maps of this rabbit spine sample. L23 and L45 have been puncturedto mimic degeneration while L34 is a normal disc. From the quantitative T2 mapping results, it can be inferred that the non-punctured disc retains it viscous nature, indicated by a higher T2 value, while the degenerated disc has a significantly lower value in NP. For UTE-MTR mapping, the normal disc has a relatively lower MTR as compared to degenerated discs indicating a decrease in water content and/or increase in macromolecular content in NP after disc operation.Figure 3 shows the bar plots of quantitative T2 and UTE-MTR measurements for all 10 rabbit spine samples at NP, anterior, and posterior AF regions. For the NP regions in all 10 samples, T2 values are significantly higher for normal discs as compared to degenerated discs. In the AF regions (anterior and posterior), the normal region has a marginally higher T2 signal for L34 than for L23 and L45. The UTE-MTR values follow a reverse trend in all three regions with the normal discs reporting a lower ratio than abnormal disc regions.
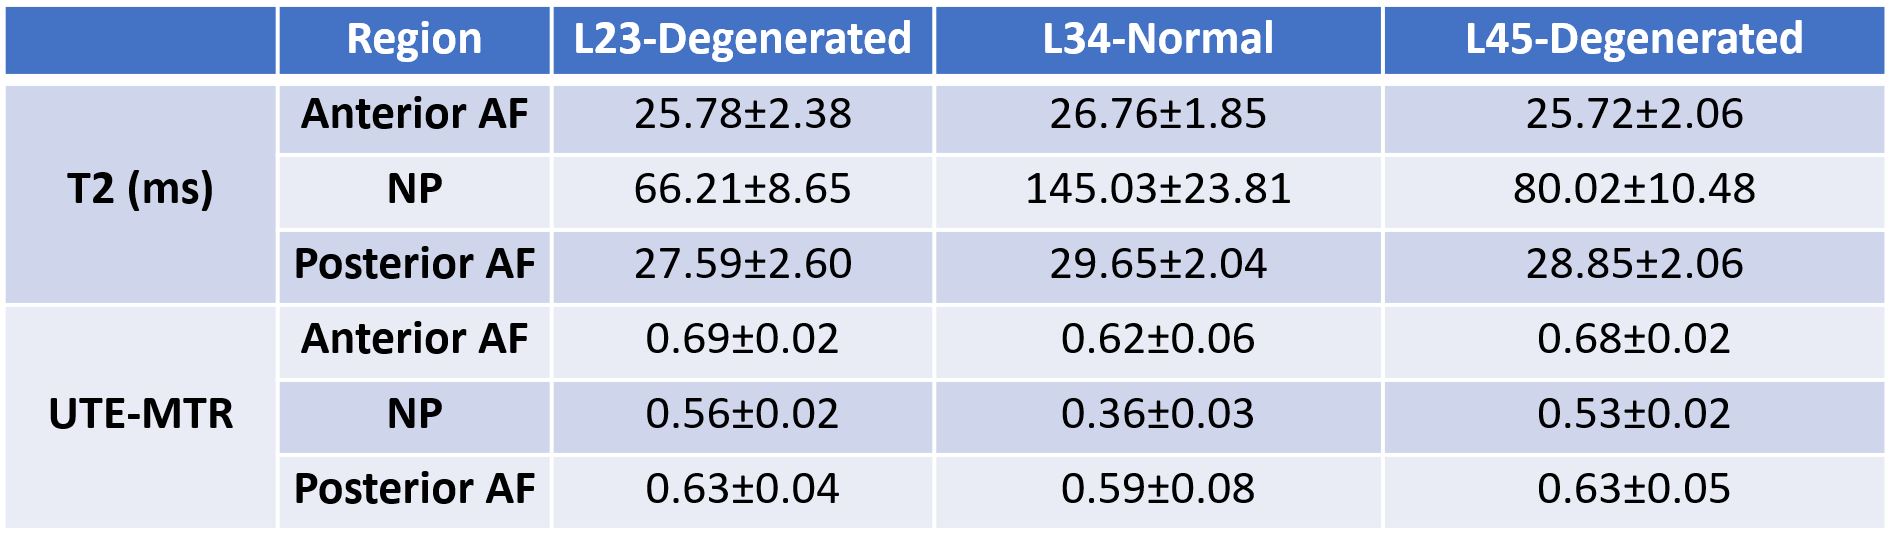
Table 1 summarizes the mean and standard deviation (SD) values of quantitative T2 and UTE-MTR measurements for all 10 rabbit spine samples. As can be seen, the T2 values of NP in normal discs (L34: 145.03±23.81ms) are significantly higher than the degenerated discs (L23: 66.21±8.65ms and L45: 80.02±10.48ms) (p<0.05). The UTE-MTR values of NP in normal discs (L34: 0.36±0.03) were significantly lower than the degenerated discs (L23: 0.56±0.02 and L45: 0.53±0.02). These results indicate that there can be significant water loss and/or macromolecular content increase in NP after disc rupture. However, the AF regions show marginal differences in both T2 and UTE-MTR measures between normal and degenerated discs, which suggests that the biochemical changes in AF regions are not significant during the studied time period.
All these findings together demonstrate that the rabbit disc puncture model used in this study mimics the biological process of human IVD and can be valuable for the assessment of IVD degeneration. The T2 and UTE-MTR mapping sequences allow for non-invasive detection of disc degeneration, which may be of great value in clinical practice, especially for evaluating pathophysiological changes and processes in the IVD.
Conclusion
The quantitative MR imaging techniques including both T2 and UTE-MT can provide non-invasive assessment of biochemical changes in the disc, which may have great potential to be translated into future clinical practice.Acknowledgements
The authors acknowledge grant support from the National Institutes of Health (R01AR062581, R01AR068987, R01AR075825, R01AR079484, RF1AG075717 and R21AR075851), VA Clinical Science and Rehabilitation Research and Development Services (Merit Awards I01CX001388, I01CX002211, and I01RX002604), and GE Healthcare.References
1. Devereaux MW. Anatomy and Examination of the Spine. Neurol. Clin. 2007;25:331–351 doi: 10.1016/j.ncl.2007.02.003.
2. Singh K, Masuda K, An HS. Animal models for human disc degeneration. Spine J. 2005;5:S267–S279 doi: 10.1016/j.spinee.2005.02.016.
3. Ferguson SJ, Steffen T. Biomechanics of the aging spine. Eur. Spine J. 2003;12:97–103 doi: 10.1007/s00586-003-0621-0.
4. Alini M, Eisenstein SM, Ito K, et al. Are animal models useful for studying human disc disorders/degeneration? Eur. Spine J. 2008;17:2–19 doi: 10.1007/s00586-007-0414-y.
5. Masuda K, Aota Y, Muehleman C, et al. A novel rabbit model of mild, reproducible disc degeneration by an anulus needle puncture: Correlation between the degree of disc injury and radiological and histological appearances of disc degeneration. Spine (Phila. Pa. 1976). 2005;30:5–14 doi: 10.1097/01.brs.0000148152.04401.20.
6. Ma YJ, Chang EY, Carl M, Du J. Quantitative magnetization transfer ultrashort echo time imaging using a time-efficient 3D multispoke Cones sequence. Magn. Reson. Med. 2018;79:692–700 doi: 10.1002/mrm.26716.
Figures