2600
Automated quantification of intervertebral disc volume loss, ADC and normalized T2 using convolutional neural networks1Medical College of Wisconsin, Milwaukee, WI, United States, 2Milwaukee School of Engineering University, Milwaukee, WI, United States
Synopsis
Keywords: MSK, Quantitative Imaging, spine, lumbar, intervertebral disc degeneration
Intervertebral disc degeneration is the leading cause of chronic low back pain (CLBP). However, there are no objective measures of the disc degeneration process. The current gold standard for grading disc degeneration relies on visual assessment of discs using MRI, which may not adequately capture complex physiological changes in degenerating discs. We developed a deep convolutional neural network to automatically segment vertebral structures and calculate quantitative MRI metrics. Results show significant changes in ADC and normalized T2 values with disc volume loss.Introduction
Chronic low back pain (cLBP) is a major health problem with high healthcare costs. Although degeneration of the intervertebral discs is strongly associated with cLBP, the disc itself is not generally the source of pain. When a patient does not respond to conservative therapies, an MRI is usually ordered. The current practice is to visually inspect those MRI scans and report disc herniation/protrusion, modic changes1, disc space narrowing and Pfirrmann degeneration grades2. Our studies have shown that quantitative MRI metrics derived from the discs and vertebrae might be more objective and accurate biomarkers of disc degeneration compared to visual evaluation3–6. However, one of the impediments to adoption of such quantitative metrics is the tedious process of manually segmenting structures in the spine and calculating various metrics to provide useful information for the clinicians. If these processes are automated, the MRI scans can be augmented with such quantitative metrics to help physicians make more informed decisions. Therefore, a Convolutional Neural Network was implemented in this study to label lumbar spine images and calculate quantitative metrics related to disc degeneration.Methods
Images were acquired using a 3T GE MRI system (Waukesha, WI USA). T1 and T2 weighted scans were acquired using Fast Spin-Echo pulse sequences with 1.2 mm in-plane resolution and 3mm slice thickness. Diffusion-weighted images were acquired using single-shot spin-echo echo planar imaging with b= 0, 600s/mm2, 2.4 mm in-plane resolution and 3mm slices.MRI scans from 70 subjects (38 controls/32 cLBP) were manually segmented to outline 5 vertebral bodies (L1-S1) and 5 discs (L1/L2-L5/S1) for training and validation of a Convolutional Neural Network. The study was approved by the IRB and participants gave written consents.
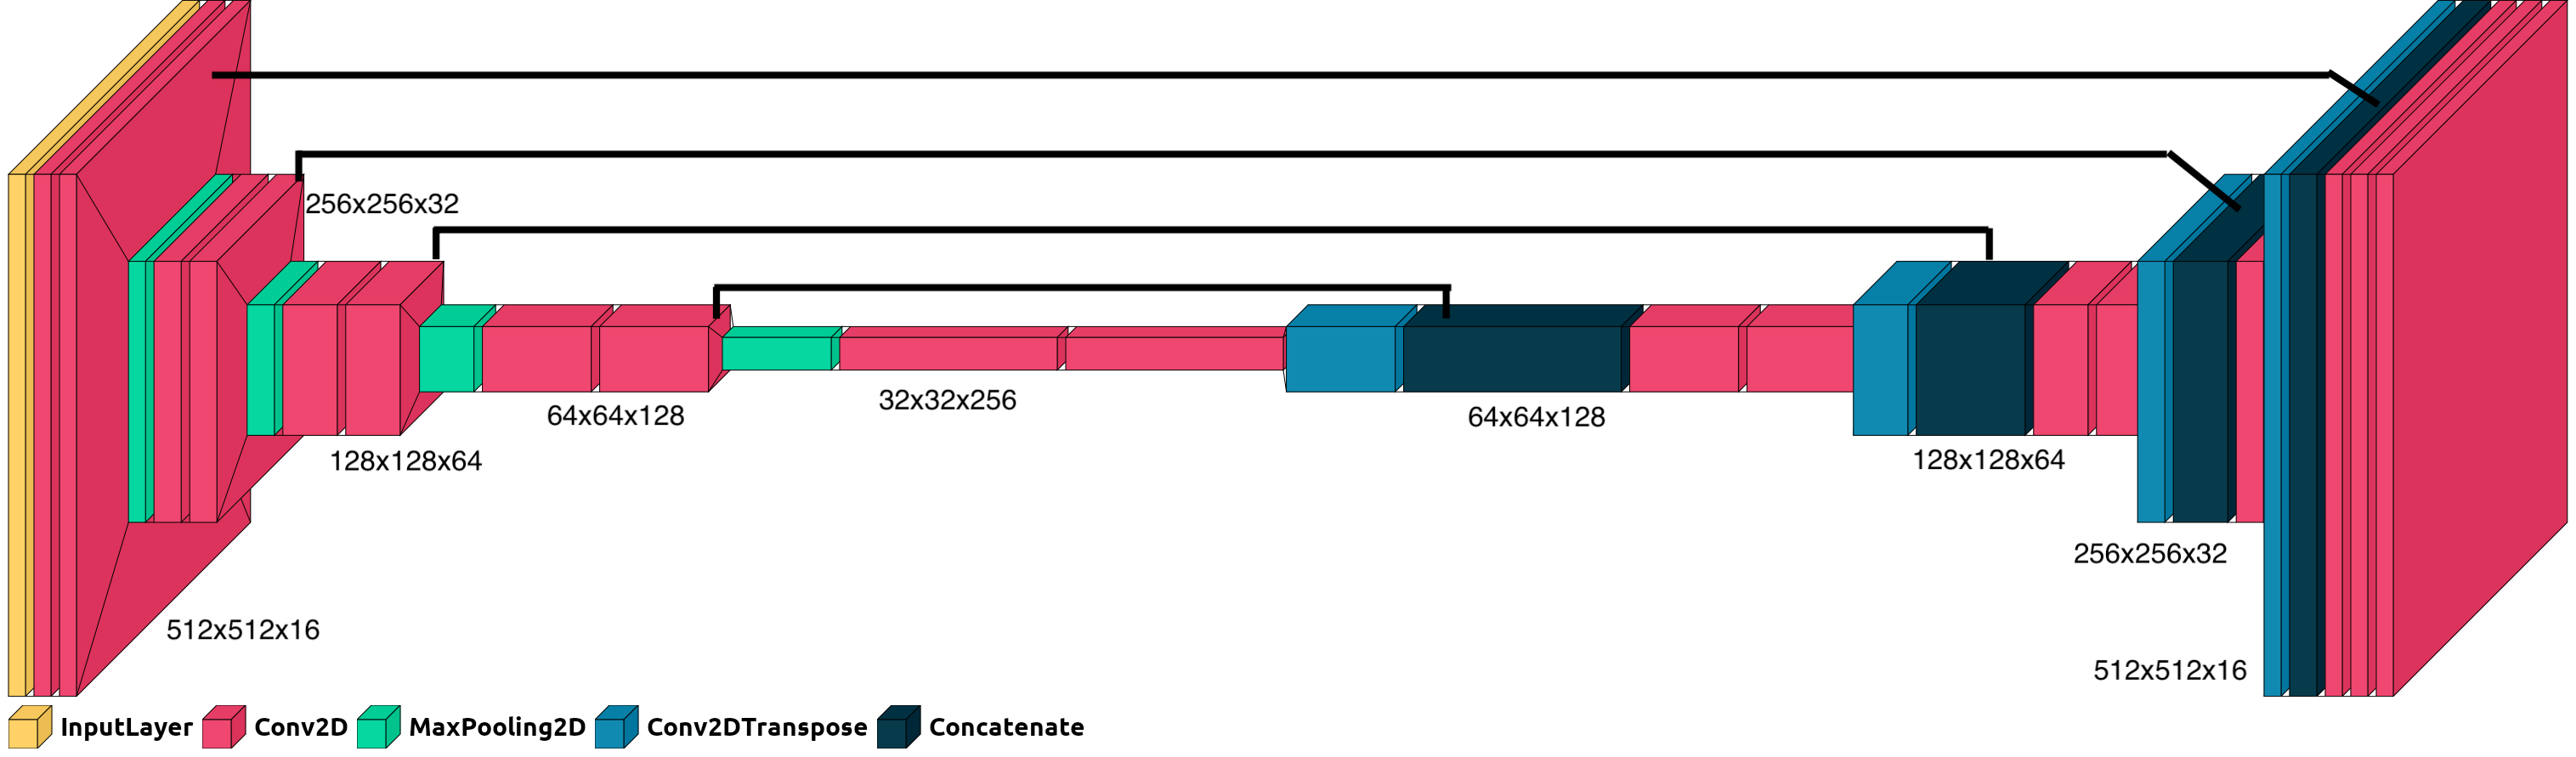
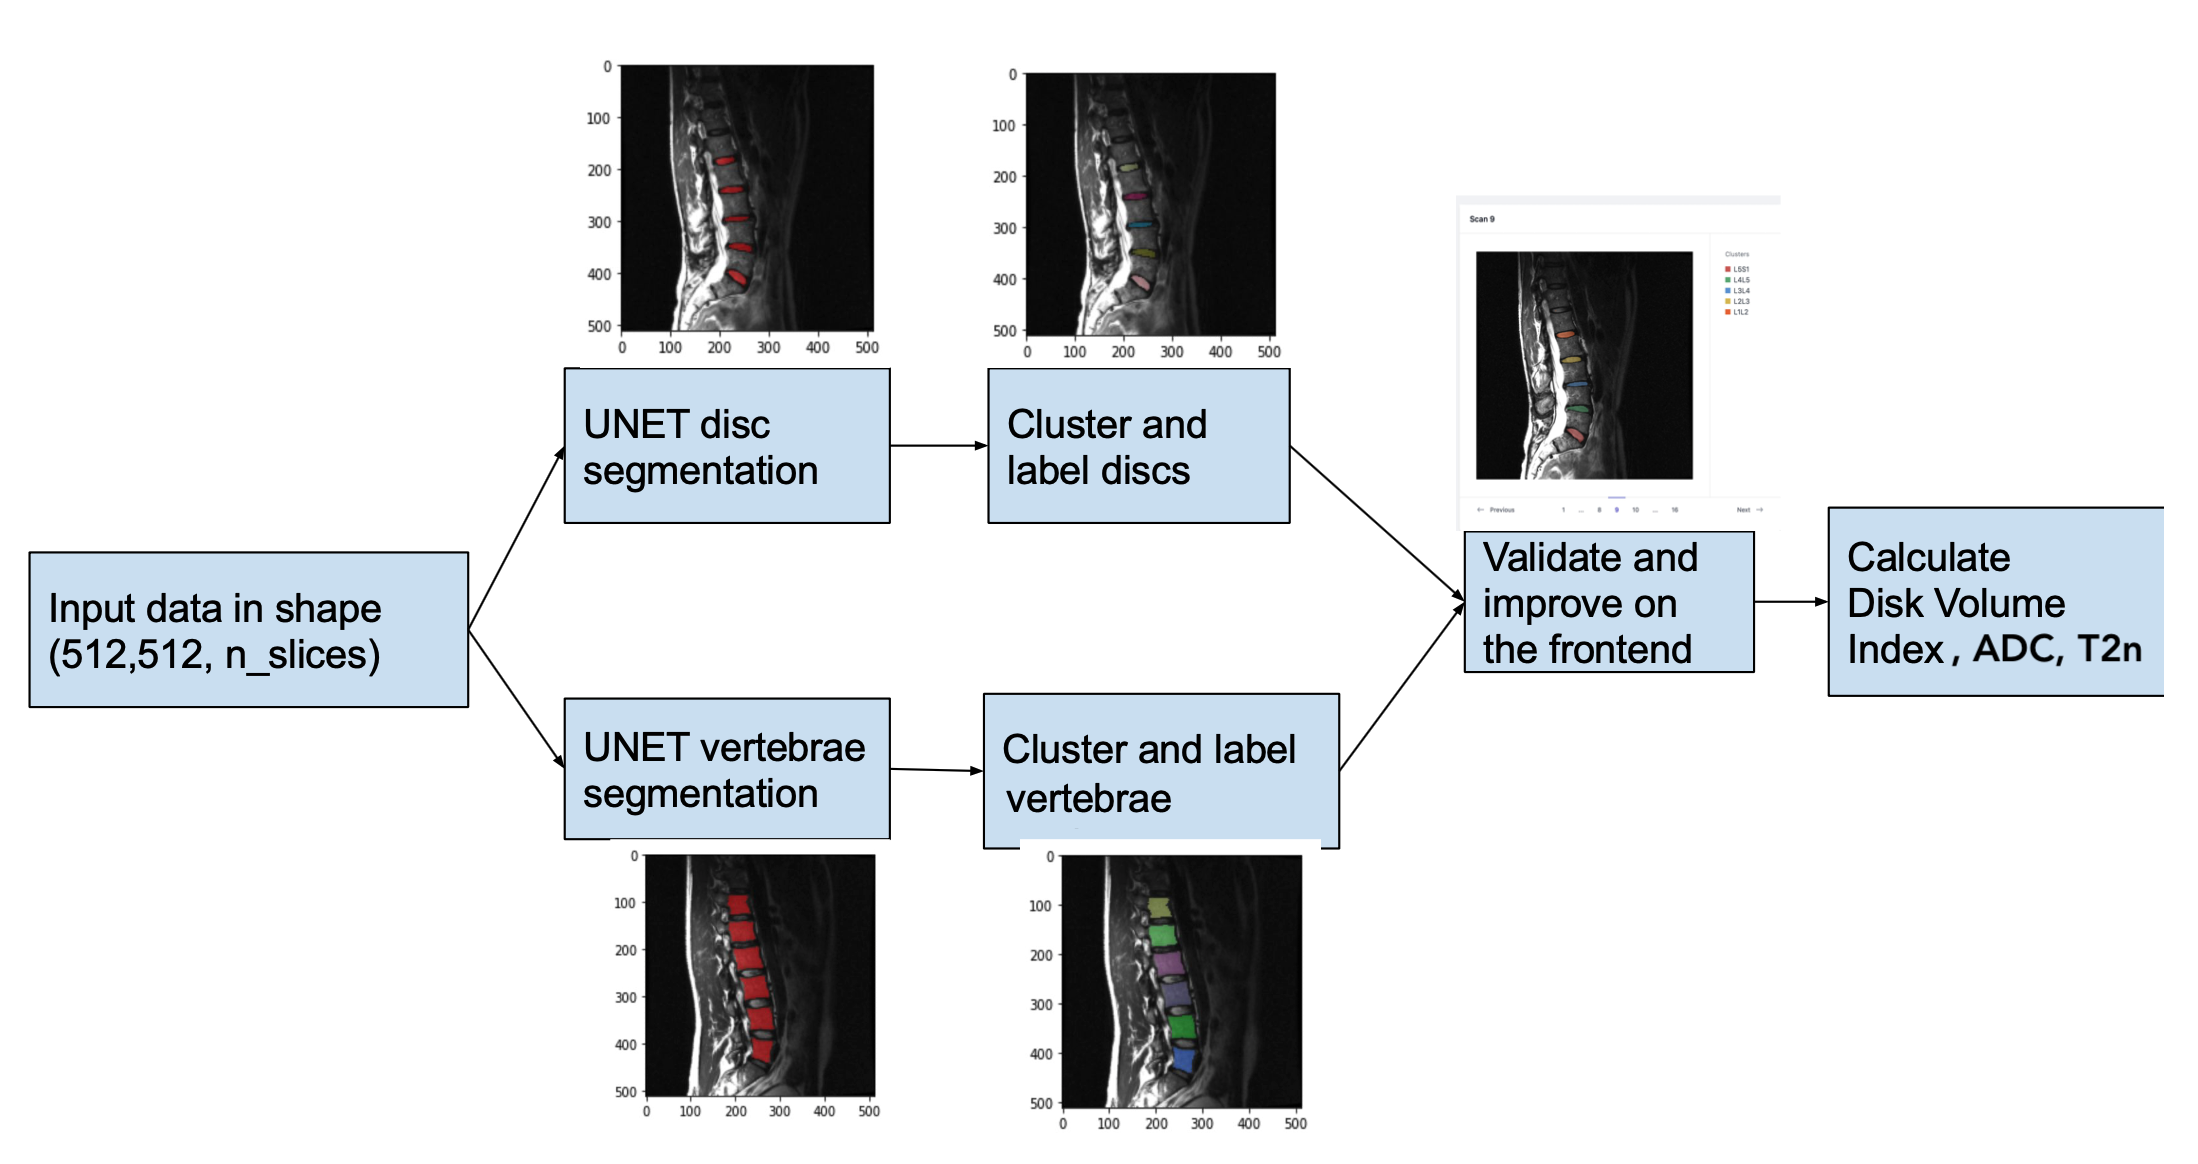
A U-Net architecture with custom encoder-decoder architecture was implemented to label discs and vertebrae (Fig.1). The network had 8,629,923 trainable parameters. ADAM optimizer was used with sparse categorical crossentropy loss function. Performance of the models were validated using the Dice coefficient. The data was split into 80/10/10 for training, validation and testing. Two separate models were estimated for the discs and vertebrae. Labeling individual discs or vertebrae had poorer outcomes, so one model labeled all lumbar discs and the other all vertebrae. Then a density based clustering method identified each individual structure. The pipeline is shown in Fig.2.
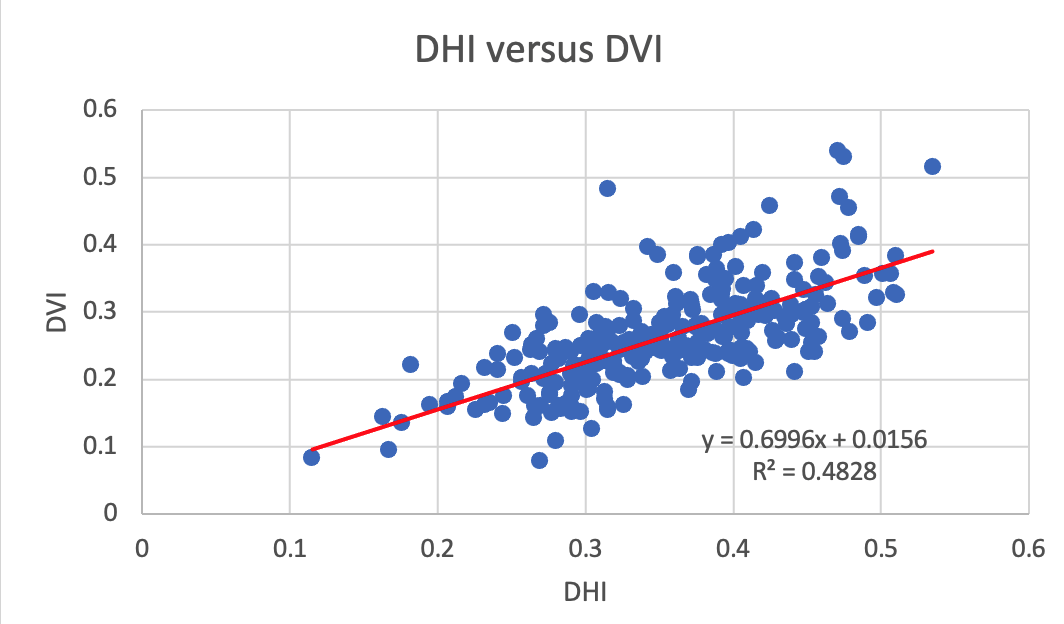
Three metrics were calculated for each lumbar disc for this study. ADC was calculated using conventional methods. Normalized T2 maps5 are semi-quantitative metrics obtained by dividing voxel signals in each disc by average signal in the cerebrospinal fluid in spine. The third one is Disc Volume Index (DVI), which could be used as a measure of disc volume loss when compared to the average DVI from healthy discs. To calculate DVI, a disc volume was normalized by the adjacent vertebral body volume to account for body size variations. We previously published the manual version of this with Disc Height Index using only measurements from mid-sagittal slice5.
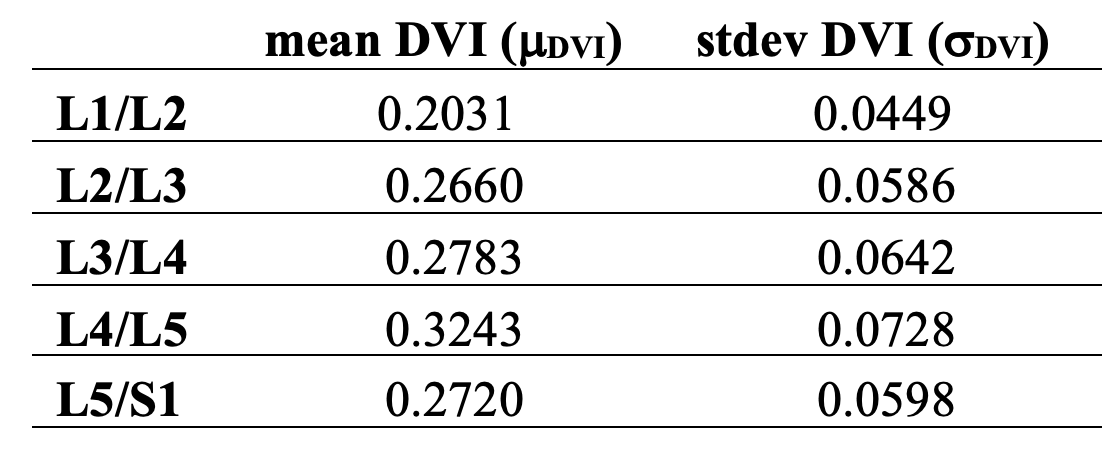
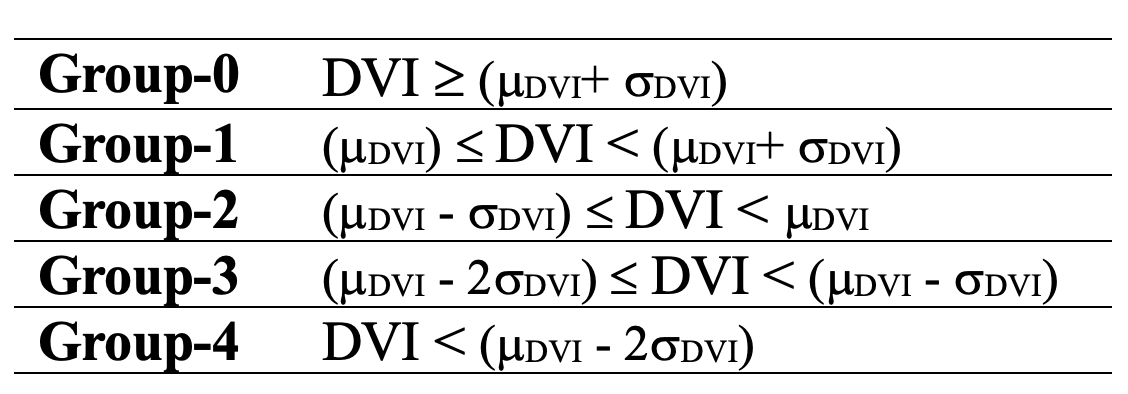
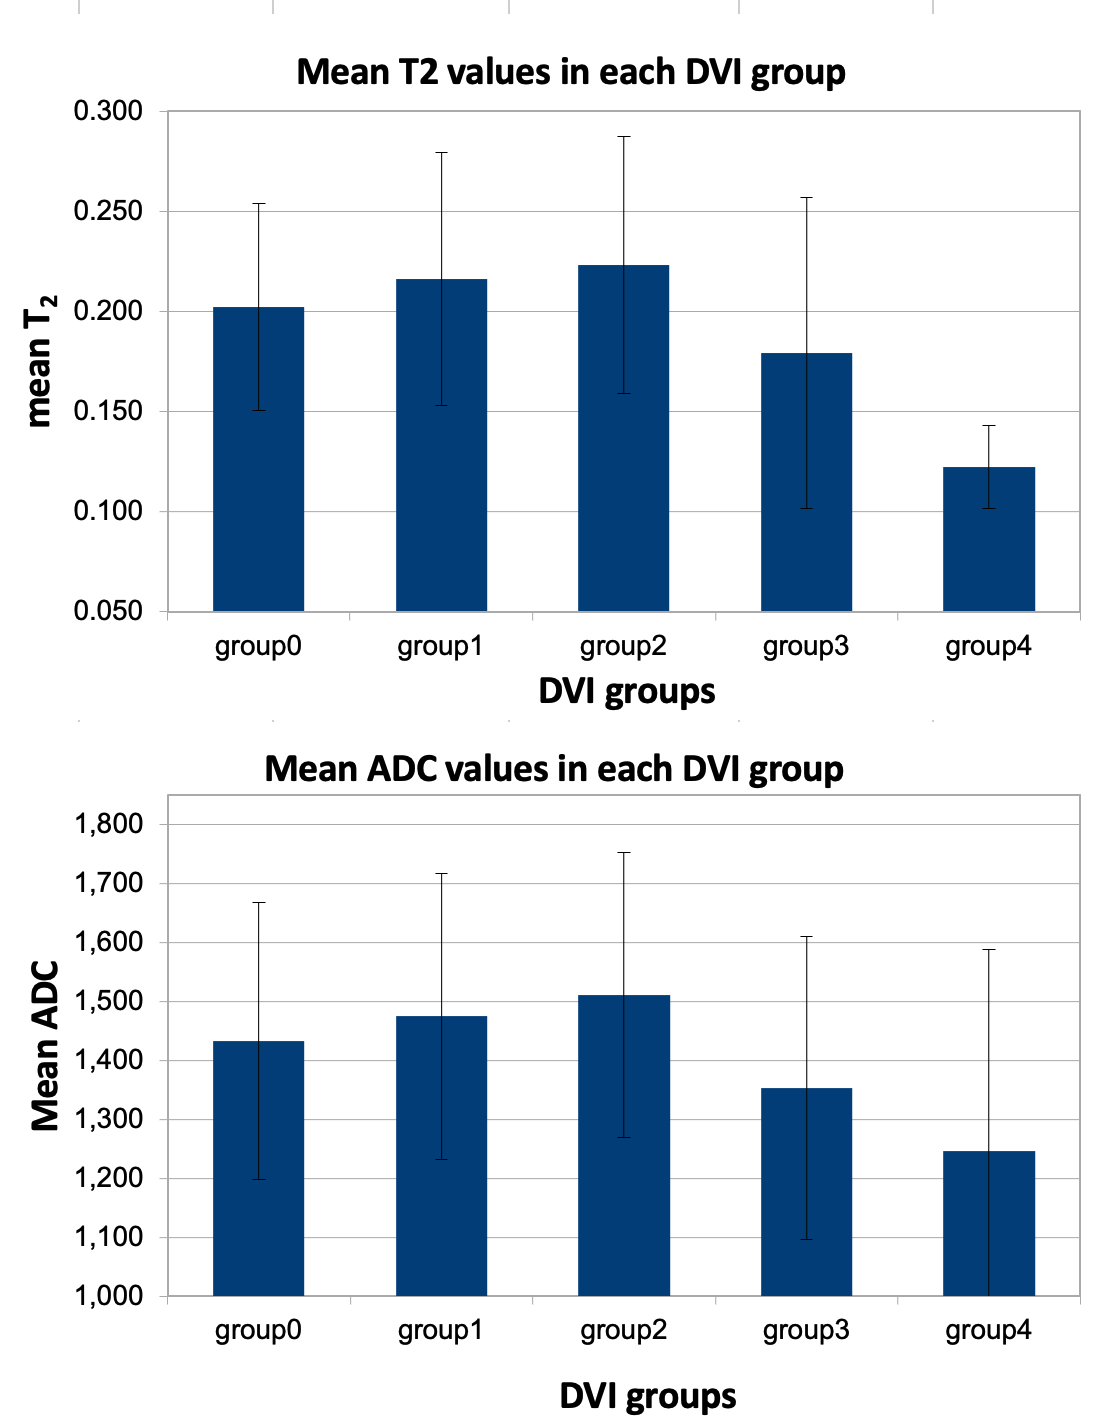
Using the DVIs as a measure of disc health, we pooled the discs into five bins from the healthiest to the most degenerated. First, the mean and standard deviation of DVI of healthy discs (Pfirrmann grades 1-2) were calculated for each lumbar disc (Table-1). Then each disc is sent to one of those bins based on its DVI compared to the respective mean value (Table-2).
The ADC and normalized T2 values are compared between those five DVI bins using one-way ANOVA.
Results
U-Net models successfully labeled the discs (Dice=0.95) and vertebrae (Dice=0.93). Good agreement was observed between the automated DVI and manual DHI calculations (Fig.3).Fig.4 shows that both ADC and normalized T2 values dropped significantly with decreasing DVI (p=0.002 and P<0.001, respectively).
Discussion
This study demonstrated an automated method to segment lumbar discs and vertebrae and calculate various metrics that could be used as indicators of disc health. These results are in accord with our earlier work where we showed a threshold of DHI after which other MRI metrics decrease sharply5. Our group and several others have shown that ADC is a reliable marker of disc degeneration that could complement Pfirrmann classification7–12. Similarly, signal intensity in discs in T2 weighted images and disc height are the primary features used in Pfirrman scoring. However, visual assessment of signal intensity or disc height loss is somewhat subjective. Therefore, generating such quantitative metrics to augment MRIs could help physician avoid ambiguities and make more informed decisions. This could be particularly helpful to monitor for adjacent segment degeneration after spinal fusion surgeries13,14.Some of the variance between DVI and DHI could be partly due to volumetric versus 2D calculations of the two methods. There were also 58 vertebrae out of 350 with slight underestimation with the U-Net model, which would lead to higher DVI.
The information can be enriched by adding other metrics such as disc herniation, bulging, Schmorl’s nodes or Modic changes once the discs and vertebrae are labeled automatically.
Conclusion
A set of quantitative MRI metrics could be more sensitive to physiological and morphological changes in degenerating discs compared to subjective visual evaluation approaches. Automated techniques would make it practical and feasible to generate such metrics from a set of MRI scans and identify potential problems.Acknowledgements
This study is supported in part by funds from Advancing a Healthier Wisconsin endowment and AOSpine Research Commission, Clinical Priority Program. We would like to thank study participants for their help and participation on this study.References
1. Modic, M. T., Steinberg, P. M., Ross, J. S., Masaryk, T. J. & Carter, J. R. Degenerative disk disease: assessment of changes in vertebral body marrow with MR imaging. Radiology 166, 193-199 (1988).
2. Pfirrmann, C. W., Metzdorf, A., Zanetti, M., Hodler, J. & Boos, N. Magnetic resonance classification of lumbar intervertebral disc degeneration. Spine (Phila Pa 1976) 26, 1873-1878 (2001).
3. Arpinar, V. E., Rand, S. D., Klein, A. P., Maiman, D. J. & Muftuler, L. T. Changes in perfusion and diffusion in the endplate regions of degenerating intervertebral discs: a DCE-MRI study. Eur Spine J 24, 2458-2467 (2015).
4. Arpinar, V. E., Gliedt, J. A., King, J. A., Maiman, D. J. & Muftuler, L. T. Oswestry Disability Index scores correlate with MRI measurements in degenerating intervertebral discs and endplates. Eur J Pain 24, 346-353 (2020).
5. Jarman, J. P. et al. Intervertebral disc height loss demonstrates the threshold of major pathological changes during degeneration. European Spine Journal 24, 1944-1950 (2015).
6. Muftuler, L. T. et al. Association between intervertebral disc degeneration and endplate perfusion studied by DCE-MRI. Eur Spine J 24, 679-685 (2015).
7. Antoniou, J. et al. Apparent diffusion coefficient of intervertebral discs related to matrix composition and integrity. Magnetic resonance imaging 22, 963-972 (2004).
8. Kealey, S. M. et al. Assessment of apparent diffusion coefficient in normal and degenerated intervertebral lumbar disks: initial experience. Radiology 235, 569-574 (2005).
9. Kerttula, L. et al. Apparent diffusion coefficients and T2 relaxation time measurements to evaluate disc degeneration. A quantitative MR study of young patients with previous vertebral fracture. Acta radiologica 42, 585-591 (2001).
10. Kurunlahti, M., Kerttula, L., Jauhiainen, J., Karppinen, J. & Tervonen, O. Correlation of diffusion in lumbar intervertebral disks with occlusion of lumbar arteries: a study in adult volunteers. Radiology 221, 779-786 (2001).
11. Tokuda, O., Okada, M., Fujita, T. & Matsunaga, N. Correlation between diffusion in lumbar intervertebral disks and lumbar artery status: evaluation with fresh blood imaging technique. J Magn Reson Imaging 25, 185-191 (2007).
12. Yu, H. J., Bahri, S., Gardner, V. & Muftuler, L. T. In vivo quantification of lumbar disc degeneration: assessment of ADC value using a degenerative scoring system based on Pfirrmann framework. European Spine Journal 24, 2442-2448 (2015).
13. Hashimoto, K., Aizawa, T., Kanno, H. & Itoi, E. Adjacent segment degeneration after fusion spinal surgery-a systematic review. Int Orthop 43, 987-993 (2019).
14. Xia, X. P., Chen, H. L. & Cheng, H. B. Prevalence of adjacent segment degeneration after spine surgery: a systematic review and meta-analysis. Spine (Phila Pa 1976) 38, 597-608 (2013).
Figures