2599
Quantitative assessment of longitudinal changes in intervertebral discs1Medical College of Wisconsin, Milwaukee, WI, United States
Synopsis
Keywords: Skeletal, Degenerative, intervertebral disc
Chronic low back pain is usually associated with degeneration of the intervertebral discs, although the disc itself may not be the source of pain. Unfortunately, there are no objective measures of the disc degeneration process. The gold standard relies on visual assessment of MRI scans, which may not capture complex physiological changes in degenerating discs. We used quantitative MRI metrics to study longitudinal changes disc degeneration over a period of 2 years. Although most subjects did not show visible changes in discs, there were significant losses in disc height and some discs also showed a reduction in ADC and T1ρ.Introduction
Chronic low back pain (CLBP) is a major health problem with high costs and lost productivity. CLBP is usually associated with degeneration of the intervertebral discs, although the disc itself may not be the source of pain. Unfortunately, there are no objective measures of the disc degeneration. The current gold standard is the Pfirrmann classification that relies on visual assessment of discs using MRI1. We postulate that visual inspection of MRIs may not adequately capture complex physiological changes in degenerating discs. Furthermore, we anticipate that the rate of changes over time will vary from patient to patient, which may influence the treatment decision. Therefore, the goal of this study was to assess the degenerative changes in the lumbar discs in a 2-year interval using a set of quantitative MRI metrics that we reported earlier2.Age related degenerative changes in discs have been studied extensively using imaging. The cross-sectional studies included participants between ages 20-70 years3–8. Longitudinal studies followed up participants between 4 to 17 years after baseline scans9–11. These studies utilized qualitative assessments such as disc herniation/protrusion, modic changes12, disc space narrowing and Pfirrmann grading1. To our knowledge, objective quantitative evaluation of disc degeneration in shorter time intervals using a longitudinal study design has not been reported. Observing the rate of degenerative changes in the discs in CLBP patients could aid the physician decide the best course of treatment.
Methods
This work was part of a larger study investigating degenerative changes in the lumbar spine and their associations with CLBP2,13–15. From a total of 70 subjects (38 controls/32 CLBP), 12 patients with CLBP were recalled for a follow up scan (median=24months, standard deviation:7.8months) on a 3T GE MRI system (Waukesha, WI USA). The study was approved by the IRB and participants gave written consents.T1 and T2 weighted scans were acquired using Fast Spin-Echo with 1.2mm in-plane resolution and 3mm slice thickness. Diffusion-weighted images were acquired using single-shot spin-echo echo planar imaging with b=0,600s/mm2, 2.4mm in-plane resolution and 3mm slices. T1ρ (spin-lattice relaxation in the rotating frame) data were acquired using a spin-lock amplitude of 400Hz; spin-lock durations of (0,20,40,60) ms; TR=6.5ms; and TE=1.6ms.
Three metrics were used in this study. In addition to the ADC and T1ρ relaxation maps, we measured Disc Height Index (DHI) that we previously published2. Disc height measurements were normalized by vertebral body measurements to account for body size variations.
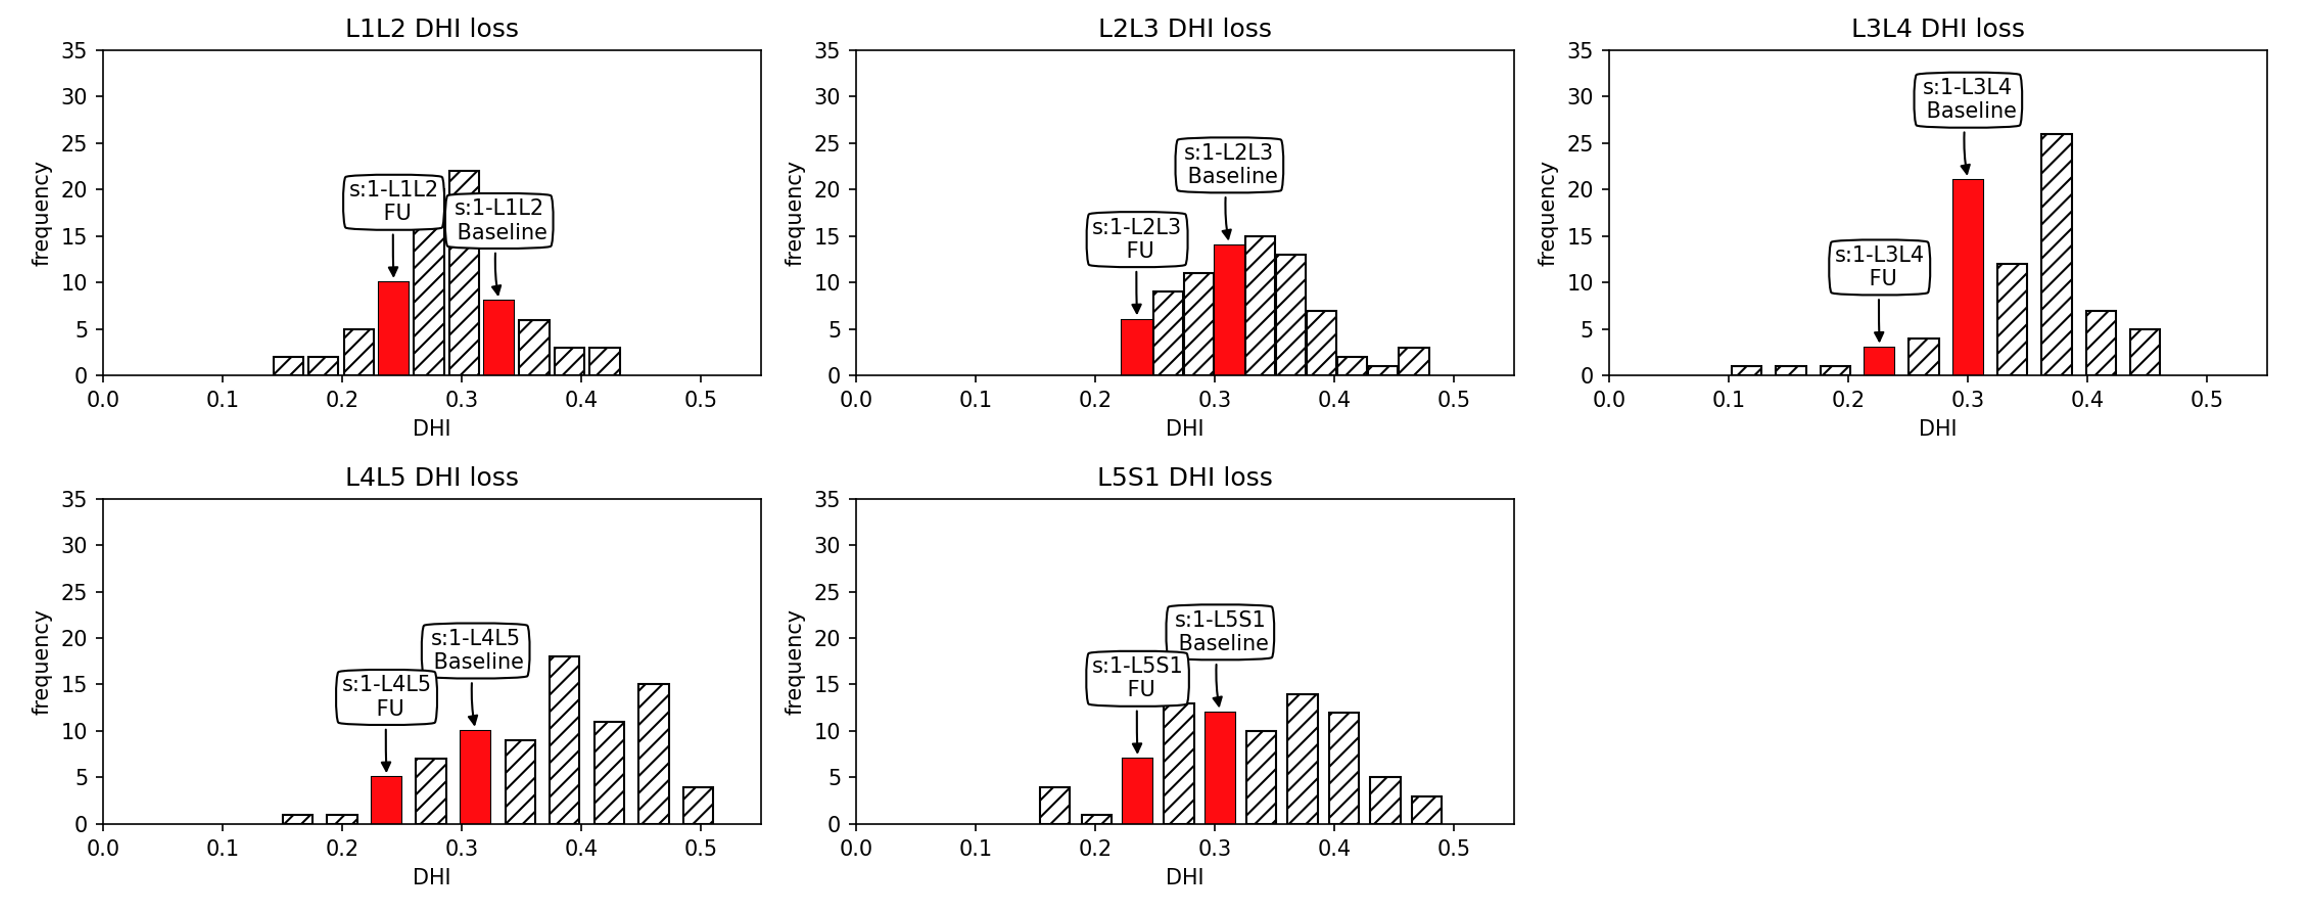
SPSS version 26 was used for statistical analyses (Armonk, NY USA). Differences between the baseline and follow up scans were calculated for each metric from each disc in each of the 12 subjects. Then each difference measure was averaged over the five lumbar discs for each subject to generate a set of 3 degeneration scores (average DHI, ADC and T1ρ losses) per participant. Associations between these degeneration scores were investigated using Pearson correlation. In addition, a linear Mixed Model (LMM) was implemented to investigate group-wise changes in each MRI metric in each disc between the baseline and follow-up. Finally, the data from the full dataset of 70 subjects were used to generate a histogram of DHI for each lumbar disc in the full cohort. Then, DHI measurements at baseline and follow-up in a subject were marked on the corresponding histogram to illustrate the initial and final condition of a subject’s discs with respect to the whole cohort.
Results
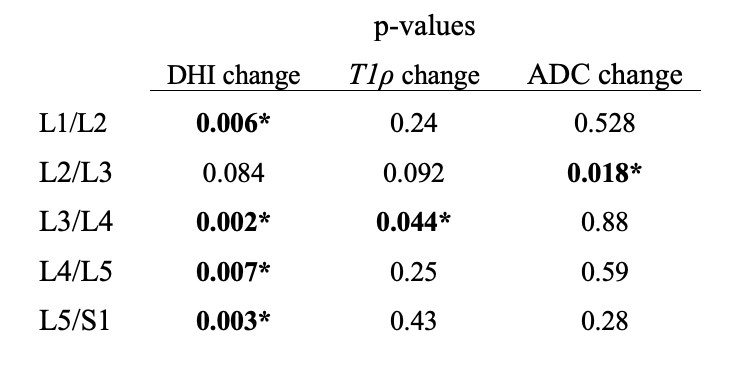
There were not significant correlations between average disc height loss and T1ρ loss or ADC loss in the cohort (r = 0.25 and r = 0.33, respectively).LMM results are listed in table-1. Four lumbar discs had significant disc height loss between the baseline and follow-up scans. L2/L3 DHI loss was not significant but showed a similar trend. L3/L4 disc showed a significant T1ρ loss and L2/L3 showed a notable trend in T1ρ loss and significant drop in ADC.
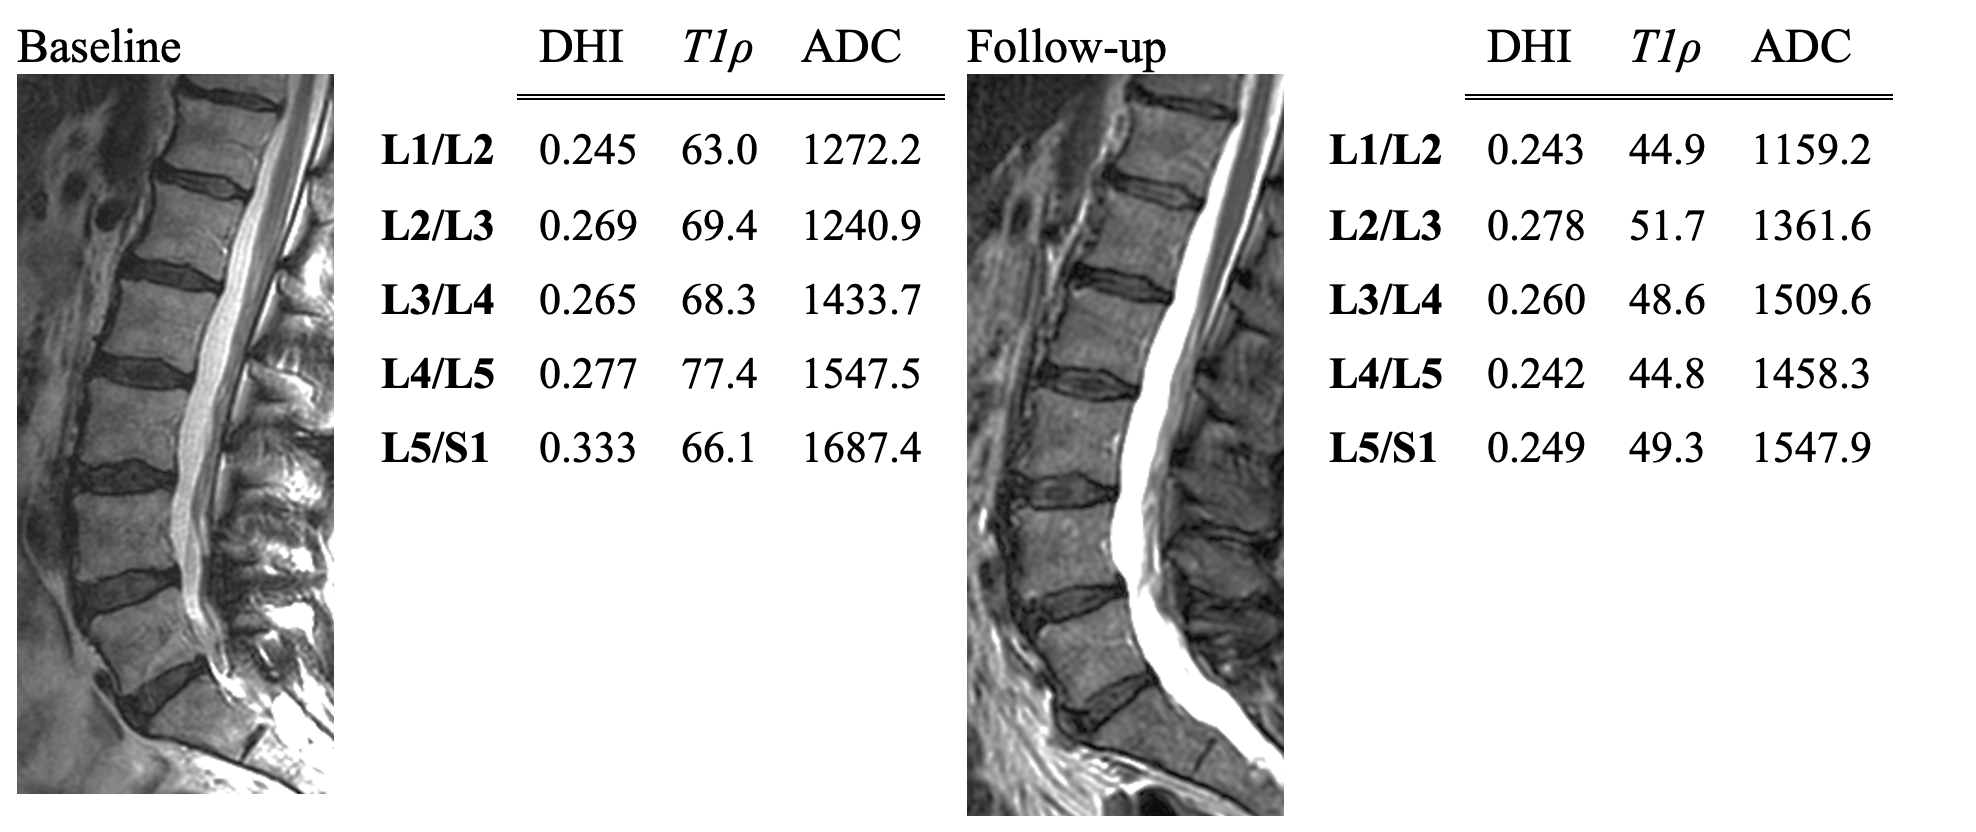
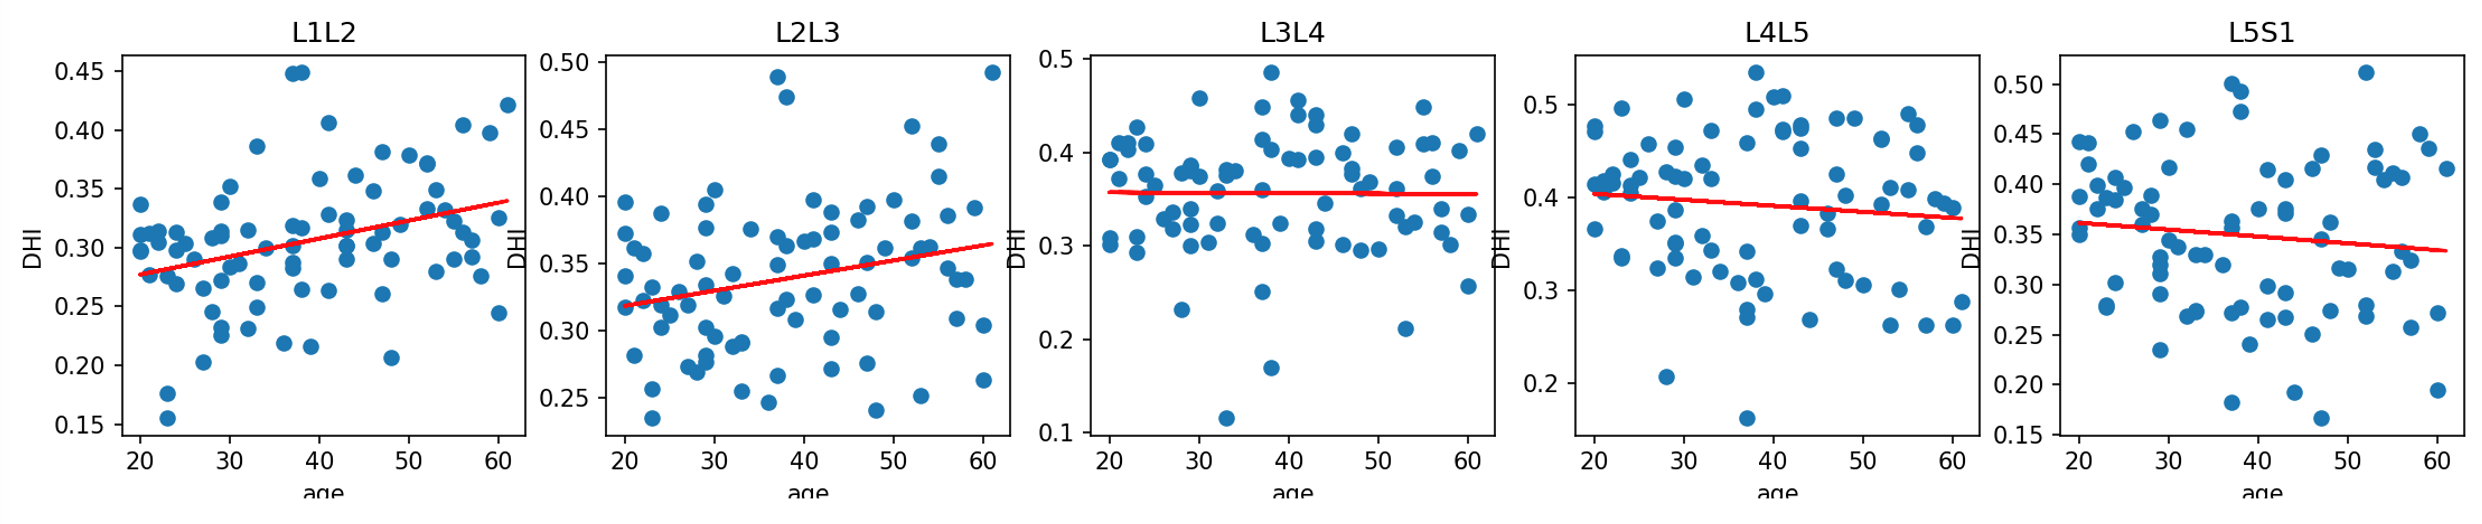
Fig.1. shows the mid-sagittal slices and corresponding MRI measurements at baseline and follow-up scans of a participant. Fig.2. illustrates the histograms of DHI derived from the full cohort. The baseline and follow-up DHIs are marked for each disc of the subject shown in Fig.1. The time between the two scans was 36 months for this participant. We also plotted age related DHI changes in each disc in our full cohort of 70 subjects to illustrate the general trends in our cohort.
Discussion
This study explored longitudinal changes in a cohort of 12 CLBP patients using quantitative MRI metrics. Although most subjects did not have clear visible changes in about 2-years, there were notable reductions in DHI. This might indicate an accelerated degenerative process because analysis of age-related changes in DHI in our full cohort did not show any notable trends (fig.3). This was a surprising finding, but a study of 627 asymptomatic subjects with no known spinal disorder reported similar results16. Histograms were helpful in determining the condition of a patient’s disc at baseline scan and how far it degenerated during the follow-up period.Conclusion
A set of quantitative MRI metrics could be more sensitive to physiological and morphological changes in degenerating discs compared to subjective visual evaluation approaches.Acknowledgements
This study is supported in part by funds from Advancing a Healthier Wisconsin endowment and AOSpine Research Commission, Clinical Priority Program. We would like to thank study participants for their help and participation on this study. We also would like to thank Lisa Rein ScM, Biostatistician II, Medical College of Wisconsin Institute for Health & Equity, for her assistance in statistical analyses.References
1. Pfirrmann, C. W., Metzdorf, A., Zanetti, M., Hodler, J. & Boos, N. Magnetic resonance classification of lumbar intervertebral disc degeneration. Spine (Phila Pa 1976) 26, 1873-1878 (2001).
2. Jarman, J. P. et al. Intervertebral disc height loss demonstrates the threshold of major pathological changes during degeneration. European Spine Journal 24, 1944-1950 (2015).
3. Boos, N. et al. Classification of age-related changes in lumbar intervertebral discs: 2002 Volvo Award in basic science. Spine (Phila Pa 1976) 27, 2631-2644 (2002).
4. Lehto, I. J. et al. Age-related MRI changes at 0.1 T in cervical discs in asymptomatic subjects. Neuroradiology 36, 49-53 (1994).
5. Boden, S. D. et al. Abnormal magnetic-resonance scans of the cervical spine in asymptomatic subjects. A prospective investigation. J Bone Joint Surg Am 72, 1178-1184 (1990).
6. Boden, S. D., Davis, D. O., Dina, T. S., Patronas, N. J. & Wiesel, S. W. Abnormal magnetic-resonance scans of the lumbar spine in asymptomatic subjects. A prospective investigation. J Bone Joint Surg Am 72, 403-408 (1990).
7. Kanayama, M., Togawa, D., Takahashi, C., Terai, T. & Hashimoto, T. Cross-sectional magnetic resonance imaging study of lumbar disc degeneration in 200 healthy individuals. J Neurosurg Spine 11, 501-507 (2009).
8. Peterson, C. K., Bolton, J. E. & Wood, A. R. A cross-sectional study correlating lumbar spine degeneration with disability and pain. Spine (Phila Pa 1976) 25, 218-223 (2000).
9. Teraguchi, M. et al. Progression, incidence, and risk factors for intervertebral disc degeneration in a longitudinal population-based cohort: the Wakayama Spine Study. Osteoarthritis Cartilage 25, 1122-1131 (2017).
10. Tonosu, J. et al. The associations between magnetic resonance imaging findings and low back pain: A 10-year longitudinal analysis. PLoS One 12, e0188057 (2017).
11. Waris, E., Eskelin, M., Hermunen, H., Kiviluoto, O. & Paajanen, H. Disc degeneration in low back pain: a 17-year follow-up study using magnetic resonance imaging. Spine (Phila Pa 1976) 32, 681-684 (2007).
12. Modic, M. T., Steinberg, P. M., Ross, J. S., Masaryk, T. J. & Carter, J. R. Degenerative disk disease: assessment of changes in vertebral body marrow with MR imaging. Radiology 166, 193-199 (1988).
13. Arpinar, V. E., Rand, S. D., Klein, A. P., Maiman, D. J. & Muftuler, L. T. Changes in perfusion and diffusion in the endplate regions of degenerating intervertebral discs: a DCE-MRI study. Eur Spine J 24, 2458-2467 (2015).
14. Arpinar, V. E., Gliedt, J. A., King, J. A., Maiman, D. J. & Muftuler, L. T. Oswestry Disability Index scores correlate with MRI measurements in degenerating intervertebral discs and endplates. Eur J Pain 24, 346-353 (2020).
15. Muftuler, L. T. et al. Association between intervertebral disc degeneration and endplate perfusion studied by DCE-MRI. Eur Spine J 24, 679-685 (2015).
16. Machino, M. et al. Age-related degenerative changes and sex-specific differences in osseous anatomy and intervertebral disc height of the thoracolumbar spine. J Clin Neurosci 90, 317-324 (2021).
Figures