2598
Magnetic-Resonance Tag Imaging of Cervical Spinal-Cord Motion in Patients with Segmental Stenosis1Advanced Clinical Imaging Technology, Siemens Healthineers International AG, Zurich, Switzerland, 2Swiss Center of Musculoskeletal Imaging, Balgrist Campus AG, Zurich, Switzerland, 3Radiology, Balgrist University Hospital, Zurich, Switzerland, 4Spinal Cord Injury Center, Balgrist University Hospital, Zurich, Switzerland
Synopsis
Keywords: MSK, Skeletal, Spine, Tagging
The reference standard for spinal-cord motion measurement is phase-contrast (PC) imaging. This approach, however, requires a dedicated phase correction during post processing, which renders clinical application very challenging. The objective of this work was to employ MR-tag imaging to directly visualize cervical spinal-cord motion in patients with spinal-canal stenosis and compare results with PC imaging. Among all patients, a good correlation between tag imaging and matched PC measurements was found (R2 = 0.84). Hence, MR-tag imaging may well complement standard static imaging within clinical routine of patients with spinal-canal stenosis, reflecting dynamic spinal cord distress.Introduction
Degenerative cervical myelopathy (DCM) is the most common spinal-cord disease in adults with spinal-canal stenosis being one of the main causes of DCM1,2. Phase-contrast (PC) imaging has shown that stenosis induced spinal canal narrowing leads to a pathologically accelerated and range-extended motion of the spinal cord3–5 during a heart-beat period, which may be a promising biomarker for spinal cord stress. PC imaging, however, requires dedicated phase correction3 during post processing, which renders clinical application challenging. In this study we explored the technical feasibility of MR-tag imaging6 as a diagnostic tool capable of directly visualizing and measuring pathologic changes of the spinal-cord motion at stenotic cervical levels without the need for additional phase correction. For this purpose, we optimized the MR tag acquisition technique and quantitatively compared results with those obtained by PC imaging.Materials and Methods
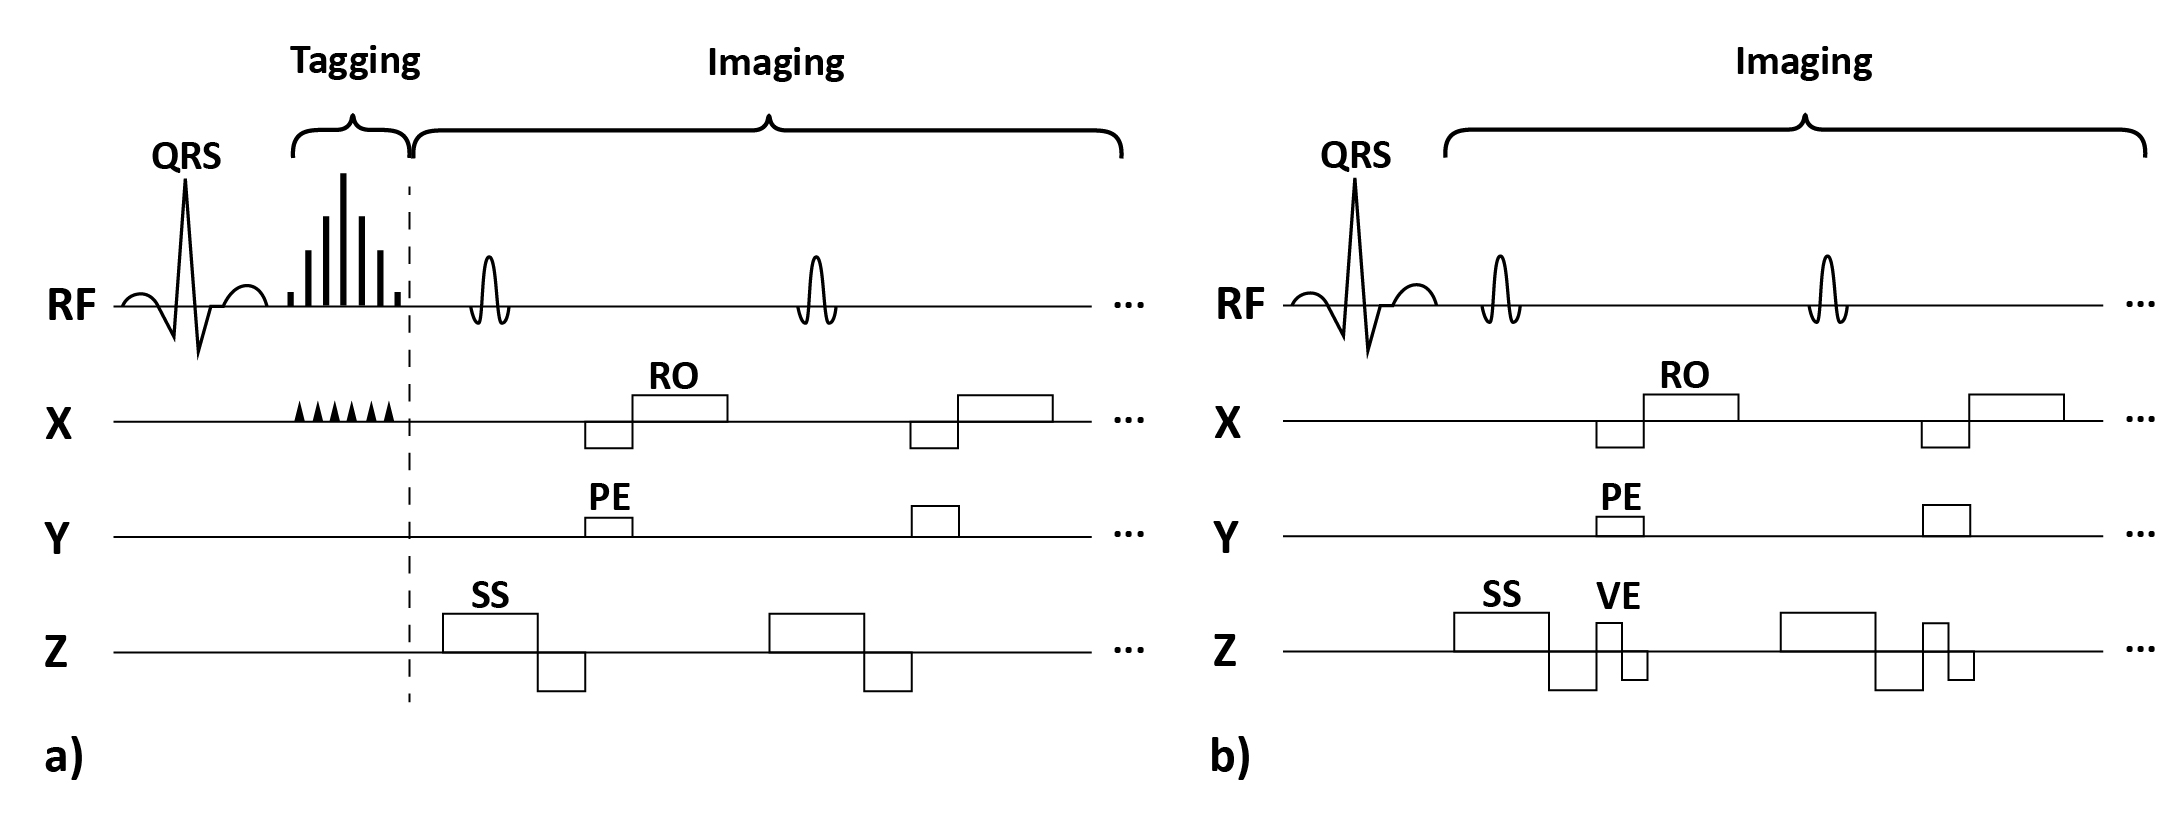
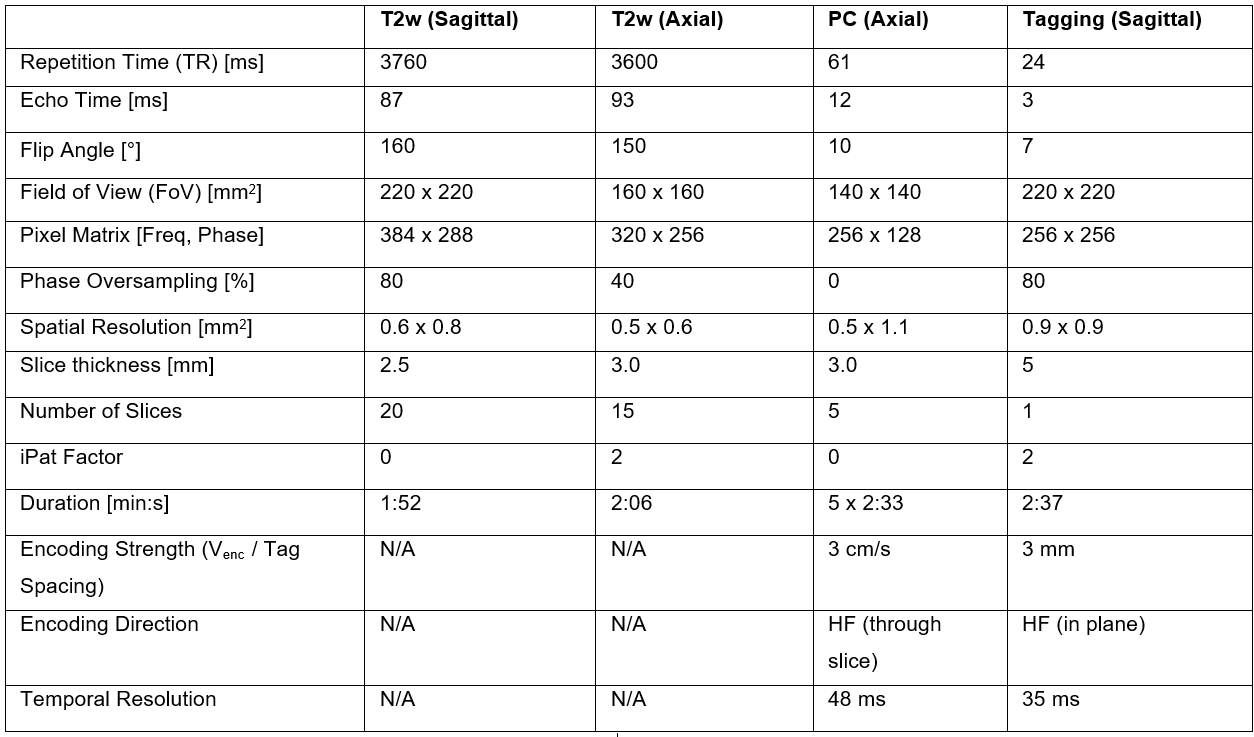
Nine adult patients with degenerative mono-segmental cervical spinal-canal stenosis were imaged head first in a clinical 3-T MR-imaging system (MAGNETOM Prisma, Siemens Healthcare, Erlangen, Germany, maximum gradient strength: 80 mTm-1, maximum slew rate: 200 Tm-1sec-1) using a 20-channel head and neck coil for signal reception. The protocol included acquisition of a stack of T2 weighted sagittal and transverse turbo-spin-echo images that covered the cervical spine. Transverse 2D PC images were acquired at the intervertebral disc levels C2/3-C6/7 in separate acquisitions. The tag images were acquired in sagittal orientation with a research application 2D cine sequence. Its spatial modulation of magnitude (SPAMM) preparation module was optimized for a tag-line spacing of 3 mm by extending the vendor-implemented radio-frequency (RF) pulse train from 5 to 7 sub pulses (RF pulse duration/gap: 0.1/1ms, flip angles: 2, 18, 32, 38, 32, 18, 2°) as shown in Figure 1. PC and tagging acquisitions were retrospectively gated and prospectively triggered, respectively, based on pulse-oximeter information on the cardiac phase. The acquisition parameters are listed in Table 1. PC data was evaluated as described in Hupp et al.3. Circular regions of interest (ROIs; area 15.3±9.1 mm2) were manually placed in the center of the spinal cord while special care was taken to avoid partial-volume effects with the surrounding static tissue. Upon phase correction3, the time course of spinal-cord velocity was determined using a custom-built software (MATLAB, The MathWorks, Inc., Natick, Massachusetts, United States). Via time integration of the velocity signal and projection on the head-feet (HF) axis, the spatial displacement along the cranio-caudal direction was determined. For the tagging data, the peak spinal HF displacement relative to the first timeframe was visually determined and manually measured by a radiologist with 12 years of experience blinded for the measurements at the PACS viewing platform (Phönix-PACS, Phönix-PACS GmbH, Freiburg, Germany). Peak displacements (i.e., maximum cranial displacements relative to the first timeframe) are reported for the ROI at stenosis level for both imaging methods. A linear-regression analysis was performed on spinal-cord displacements derived from both imaging techniques and values were compared using the Wilcoxon test for paired samples. P < 0.05 was considered to indicate a significant difference. Values are reported as mean ± standard deviation.Results
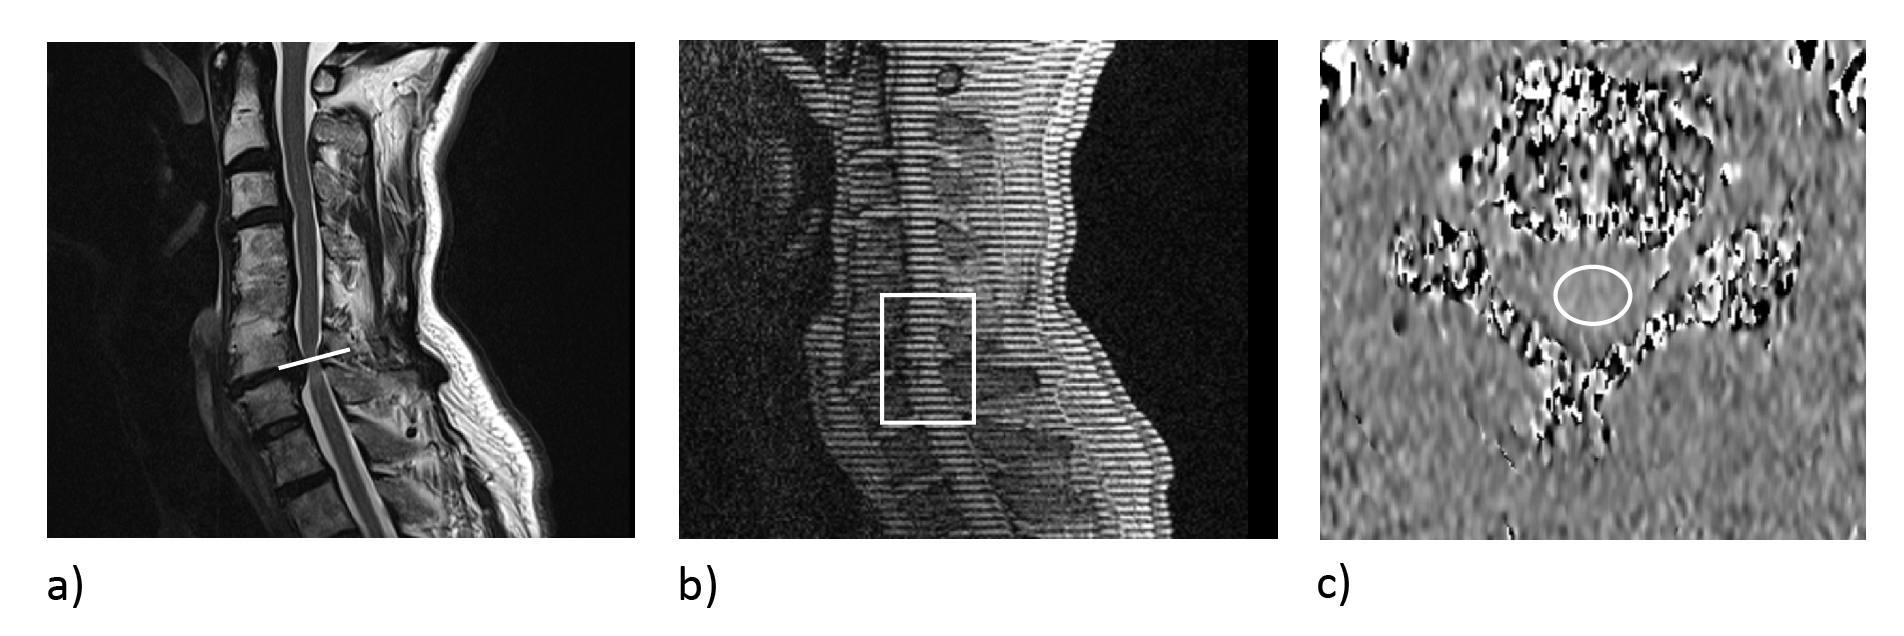
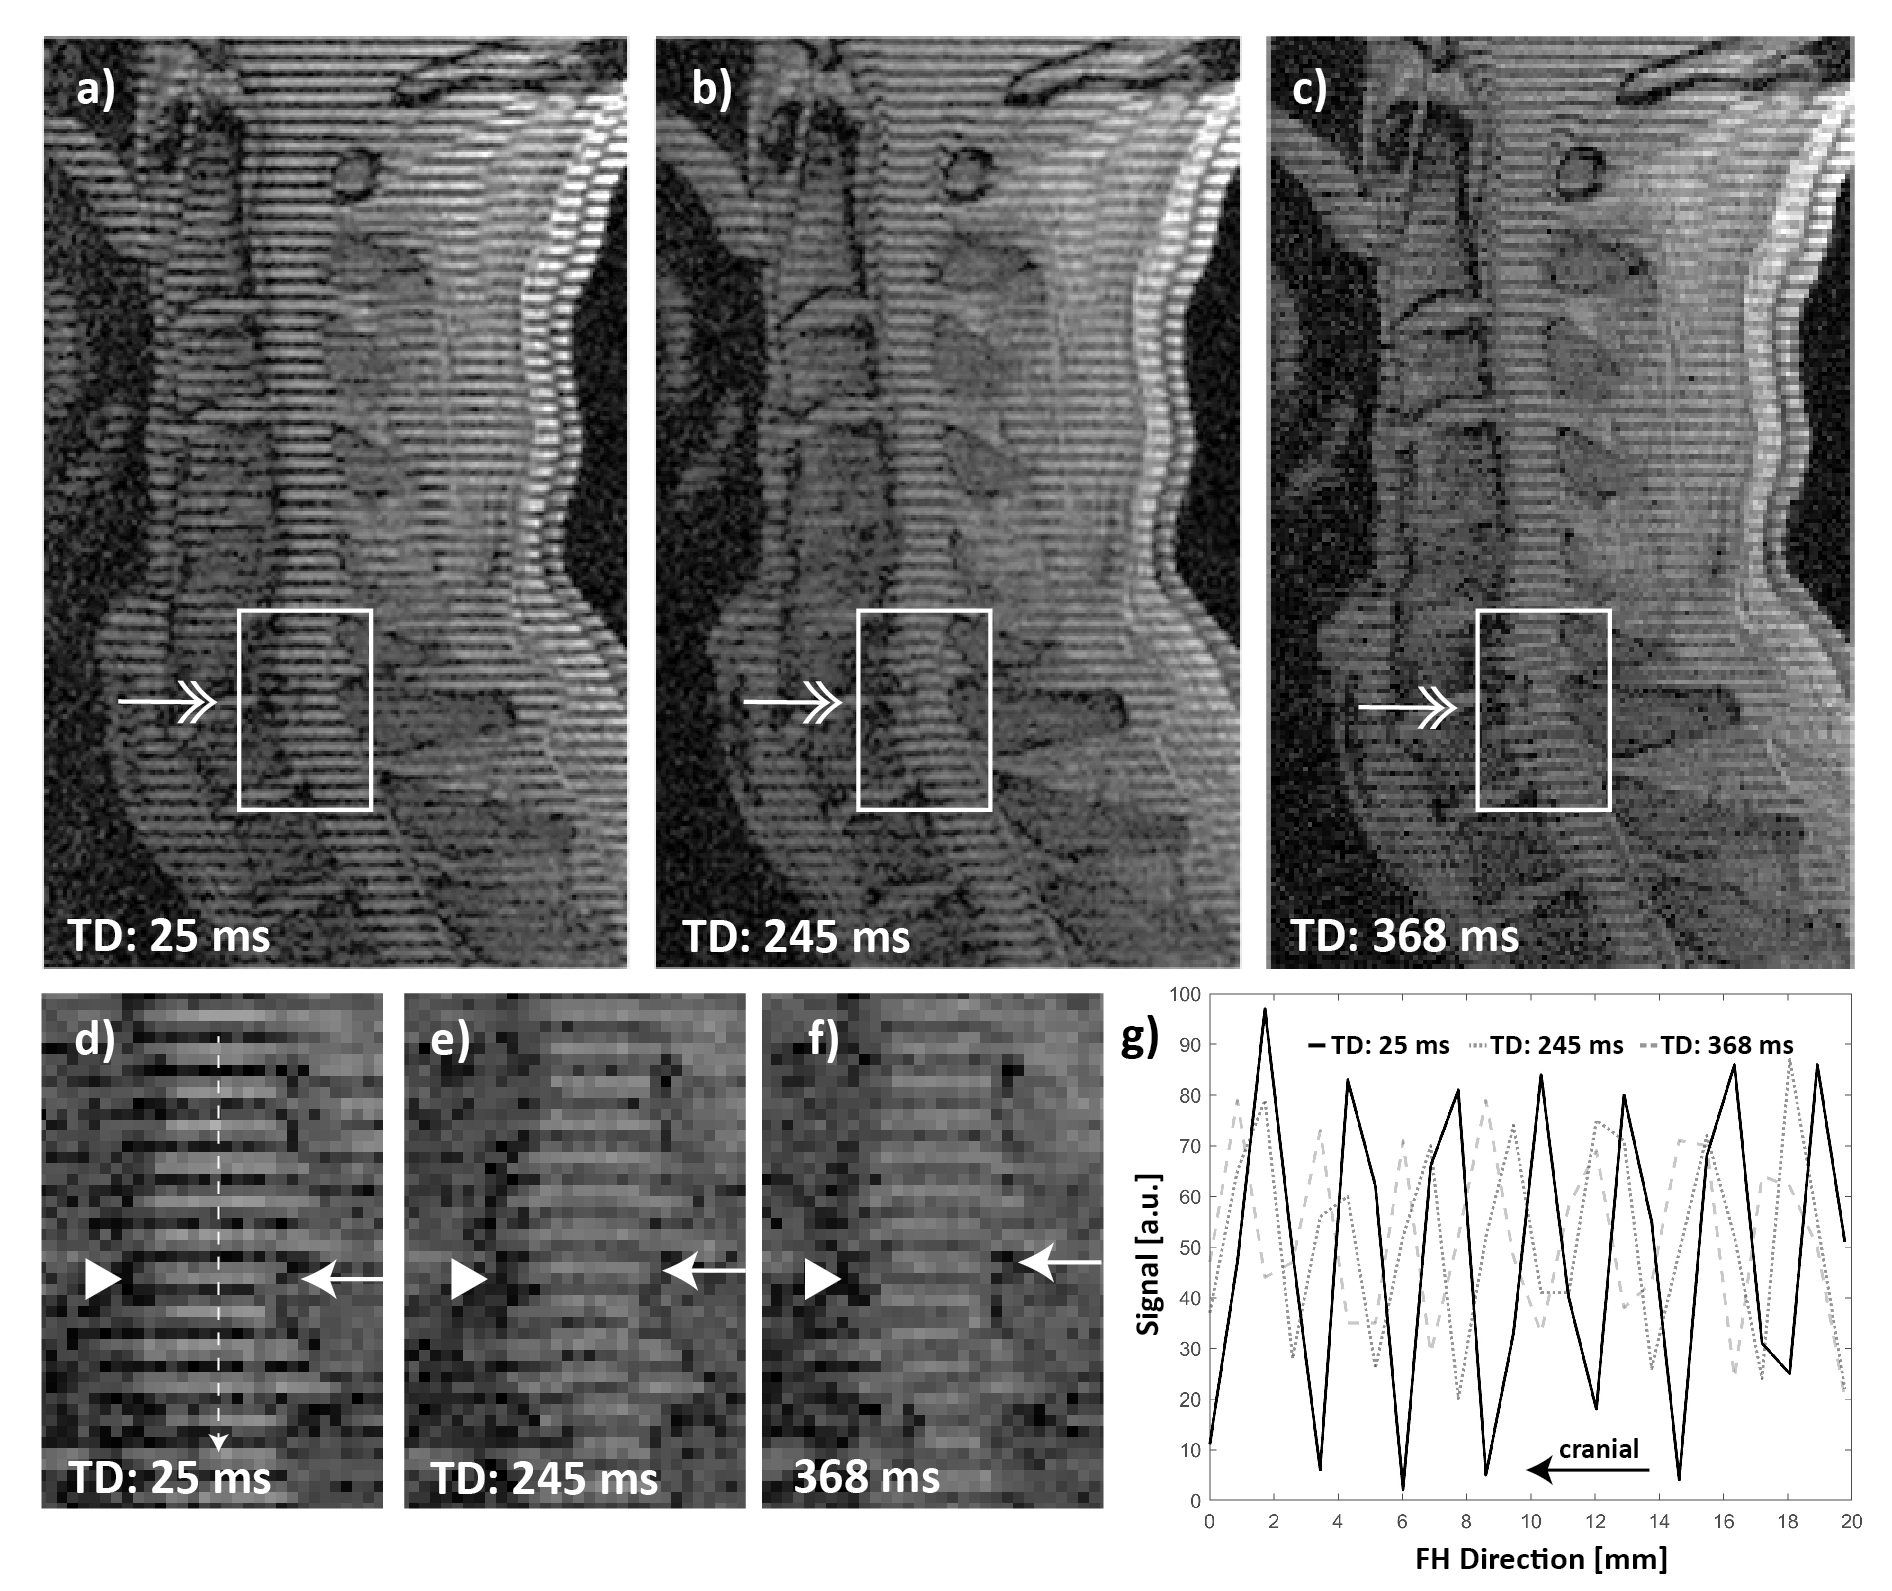
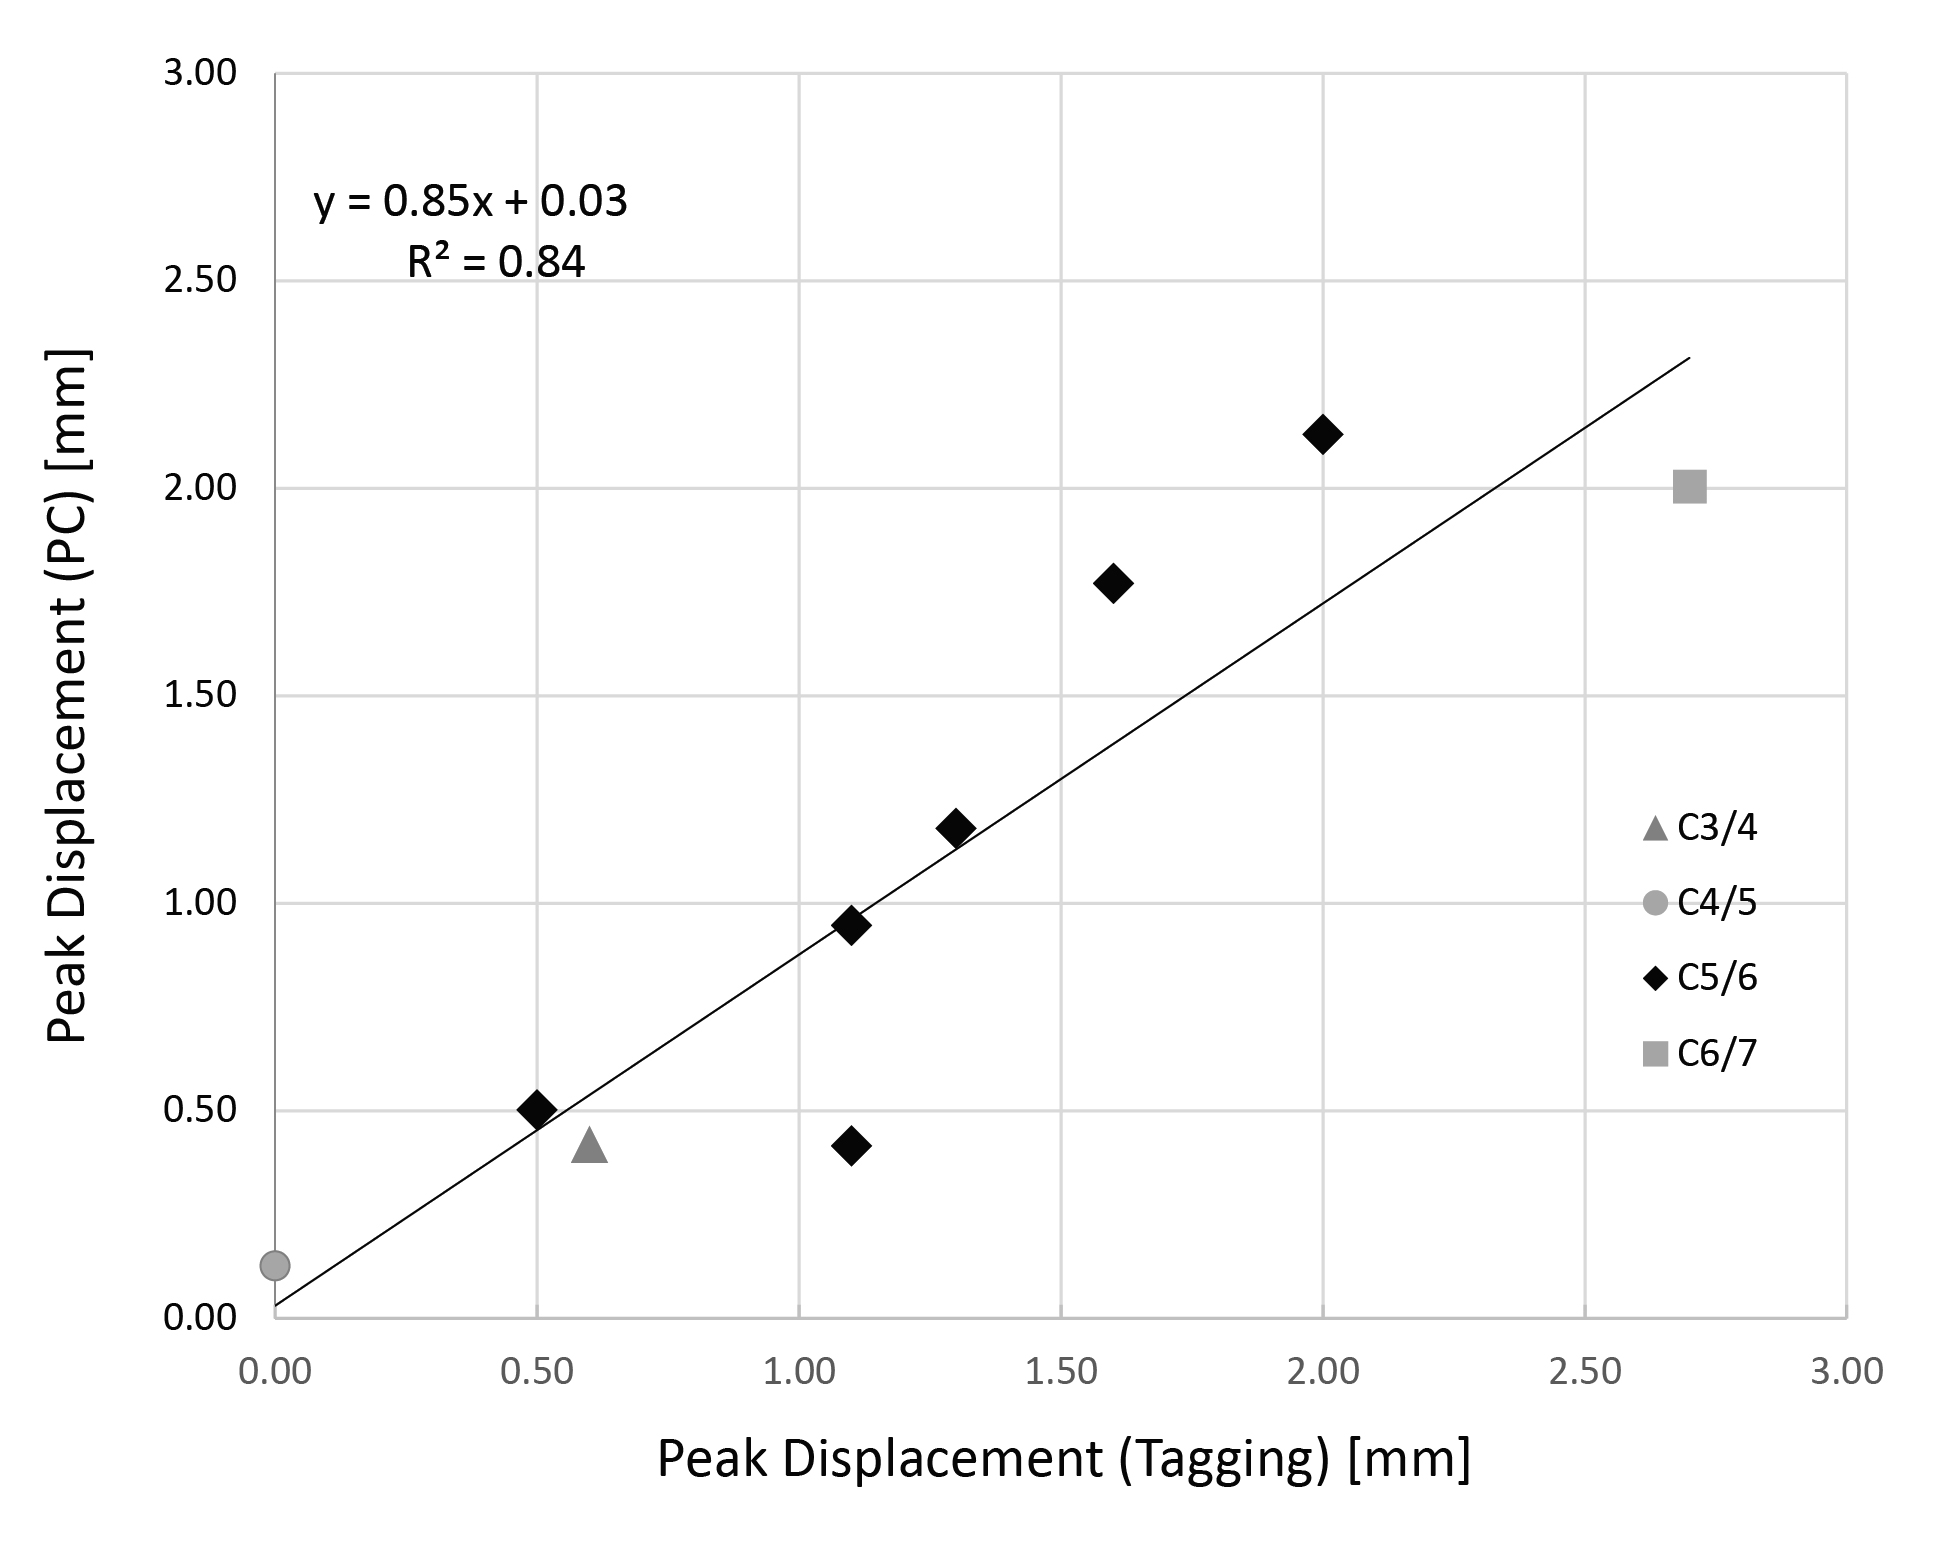
The patients (4 female and 5 male) had a mean age of 57 ± 7 years and a mean body-mass index of 26.2 ± 7.3 kg/m2. Six out of the nine selected patients had stenoses at the C5/6 level, while the remaining three had a stenosis at C3/4, C4/5, and C6/7 levels, respectively. Figure 2 shows examples of anatomical, tagging and PC images and the placement of the regions of interest (ROI). As shown in Figure 3, in tag images, spinal-cord motion was directly visible when compared to the reference images captured in the first time frame. In case of tagging, T1 relaxation during the cardiac cycle caused the contrast to increasingly weaken in later time frames. Figure 4 shows a good linear relationship between peak spinal-cord displacement D determined by PC and tag imaging (R2 = 0.84, linear relation: DPC = 0.85*DTagg + 0.03). No significant difference in D was found between PC- and tagging-derived peak (1.16±0.63 mm vs 1.27±0.46 mm, p = 0.43). A trend towards larger spinal-cord displacement from cranial to caudal can be seen in Figure 4.Conclusion
Our study confirmed the feasibility of a direct visualization of spinal-cord motion in patients with DCM by an intuitive magnitude-based tagging technique which requires no post-processing in contrast to state-of-the art PC imaging. Similar to Kohgo et al.6, we found spinal cord motion along the cranial-caudal direction during the cardiac cycle and quantitative results from MR tag imaging were in agreement with those from PC MRI. However, due to the pulse oximeter trigger in our work and T1 relaxation effects, we focused solely on the diastole, while Kohgo et al6 captured the systolic and early diastolic phase using ECG triggering. In our study, MR-tag imaging was performed in less than three minutes; thus, it is well suited to be added to a standard clinical MR protocol. It has the potential to become a tool in clinical routine for patient monitoring and therapy surgery decision.Acknowledgements
Constantin von Deuster and Shila Pazahr contributed equally to this work. This study (i.e., cost for MRI examinations) was supported by Balgrist Foundation, Zurich, Switzerland.References
1. Nouri A, Tetreault L, Singh A, et al. Degenerative cervical myelopathy: Epidemiology, genetics, and pathogenesis. Spine (Phila. Pa. 1976). 2015;40(12):E675–E693.
2. Badhiwala JH, Ahuja CS, Akbar MA, et al. Degenerative cervical myelopathy — update and future directions. Nat. Rev. Neurol. 2020;16(2):108–124.
3. Hupp M, Pfender N, Vallotton K, et al. The restless spinal cord in degenerative cervical myelopathy. Am. J. Neuroradiol. 2021;42(3):597–609.
4. Chang HS, Nejo T, Yoshida S, et al. Increased flow signal in compressed segments of the spinal cord in patients with cervical spondylotic myelopathy. Spine (Phila. Pa. 1976). 2014;39(26):2136–2142.
5. Vavasour IM, Meyers SM, Macmillan EL, et al. Increased spinal cord movements in cervical spondylotic myelopathy. Spine J. 2014;14(10):2344–2354.
6. Kohgo H, Isoda H, Takeda H, et al. Visualization of spinal cord motion associated with the cardiac pulse by tagged magnetic resonance imaging with particle image velocimetry software. J. Comput. Assist. Tomogr. 2006;30(1):111–115.
Figures