2596
Decipher the simultaneous progress of fat infiltration and muscle atrophy with fat-clustering analysis of MRI1Vascular and Physiologic Imaging Research (VPIR) Lab, School of Biomedical Engineering, ShanghaiTech University, Shanghai, China, 2Department of Radiology, Shanghai Guanghua Hospital of Integrative Medicine, Shanghai, China, 3Central Research Institute, UIH Group, Central Research Institute, UIH Group, Shanghai, China, 4School of Biomedical Engineering, Shanghai Jiao Tong University, Shanghai, China
Synopsis
Keywords: Osteoarthritis, Aging
Fat content and clustering are linked to muscle function in various disorders and are of therapeutic importance because they reflect the physical activity. Thus, we studied the fat content and clustering in three groups: hip-joint replacement surgery (HJRS) patients, ankylosing spondylitis (AS) patients who received medicine, and healthy controls. Although the intramuscular fat of unaffected side remained same in HJRS patients, Moran's index declined. Meanwhile, the Moran index of HJRS patients' affected side decreased significantly when fat content decreased. Besides, the drug treatment for AS patients resulted in a decrease in both fat content and Moran's index.Introduction
Multiple diseases including ankylosing spondylitis (AS) lead to deterioration of physical performance. In rehabilitation, it is desirable to precisely monitor the progress for optimal management1. MRI-measured fat content seems suit the purpose, but does not discriminate between fat infiltration and muscle atrophy that often occur simultaneously2. Herein, we proposed a method to quantify both fat content and clustering (by Moran’s index) based on a same set of MR images, and tested on patients of two clinical scenarios: AS (a chronic disease) or hip-joint replacement surgery (HJRS).Methods
The study was approved by the institutional review board. Twelve subjects (4 with HJRS, 4 AS patients that underwent medication for a period of half a year, and 4 healthy controls) participated in this study after signing the written consent form. The MRI exam was performed on a 1.5T MR scanner (United Imaging Healthcare, Shanghai, China), using a 12-channel coil for lower limbs. T1-weighted, and T2-weighted imaging with fat suppression were performed for an axial slice across the covered upper pole of thigh muscles and gluteus maximus, which are believed to be susceptible to fat infiltration and muscle atrophy (Fig.1a and 1b). T1-weighted images based on spin-echo were acquired with the following parameter values: field of view (FOV, 210x210 mm), TR/TE (550/9 ms),and slice thickness (3 mm). The parameter of T2-weighted image with fat suppression is the same FOV and slice thickness as T1-weighted image, except for the TR/TE (2847/84 ms). The acquired data were transferred to a personal computer and then were processed in a MATLAB environment. In post-processing, we applied Gaussian clustering to the T1WI and T2WI signals as displayed in a joint histogram, thus identified the fat voxels in the images (Fig. 1c and 1d). With the obtained fat map, we computed intramuscular fat content as a percentage over the entire muscle region, and the Moran’s Index to quantify fat clustering. A higher level of the index indicates more clustering3. Student’s t-test and one-way analysis of variance (ANOVA) with multiple comparisons corrected by Tukey testing were used for detecting differences among the various groups of results. A difference was regarded as significant if the associated P value was less than 0.05.Results and Discussion
Before the operation, the affected and unaffected sides for the HJRS group did not show any significant difference between their intramuscular fat, or between their Moran’s index (P>0.70, Fig.2a and 2b). After the operation, the unaffected side’s overall fat content did not change (P=0.94), but Moran’s index decreased from 0.49±0.01 to 0.44±0.09 (P=0.24), which means less clustering of adipose tissue. This can be due to the regrowth of muscle fibers that segregated the fat clusters into parts. On the affected side, both fat content and Moran’s index decreased. The fat contents decreased from 0.68±0.01 to 0.05±0.02 (P=0.25), while the Moran’s index significantly decreased from 0.51±0.03 to 0.39±0.08 (P=0.04). Such a phenomenon suggests the possible effect of both muscle re-growth and fat reduction. For the AS patients, their medication treatment led to a subtle decrease in both fat content and Moran’s index (Fig. 3a and 3b). The Moran’s index decreased from 0.059±0.007 to 0.053±0.008 (P=0.29), but still higher than the health (0.038±0.08). Similarly, fat content decreased from 0.43±0.04 to 0.41±0.05 (P=0.14), but still higher than the health (0.39±0.06). This indicates that the half-a-year treatment worked.Conclusion
The proposed method was sensitive to the changes in fat/muscle distribution in patients with hip joint replacement and in AS patients’ medication treatment, thus showing promise in deciphering the combined effect of fat infiltration and muscle regrowth that occur in the patients’ recovery.Acknowledgements
This work was supported by the National Natural Science Foundation of China (Grant No. 82171924).References
- Sieper J, Braun J, Rudwaleit M, et al. Ankylosing spondylitis: an overview[J]. Annals of the rheumatic diseases, 2002, 61(suppl 3): iii8-iii18.
- Ren C, Zhu Q, Yuan H. Mono-exponential and bi-exponential model-based diffusion-weighted MR imaging and IDEAL-IQ sequence for quantitative evaluation of sacroiliitis in patients with ankylosing spondylitis[J]. Clinical rheumatology, 2018, 37(11): 3069-3076.
- Santago A C, Vidt M E, Tuohy C J, et al. Quantitative analysis of three-dimensional distribution and clustering of intramuscular fat in muscles of the rotator cuff[J]. Annals of biomedical engineering, 2016, 44(7): 2158-2167.
Figures
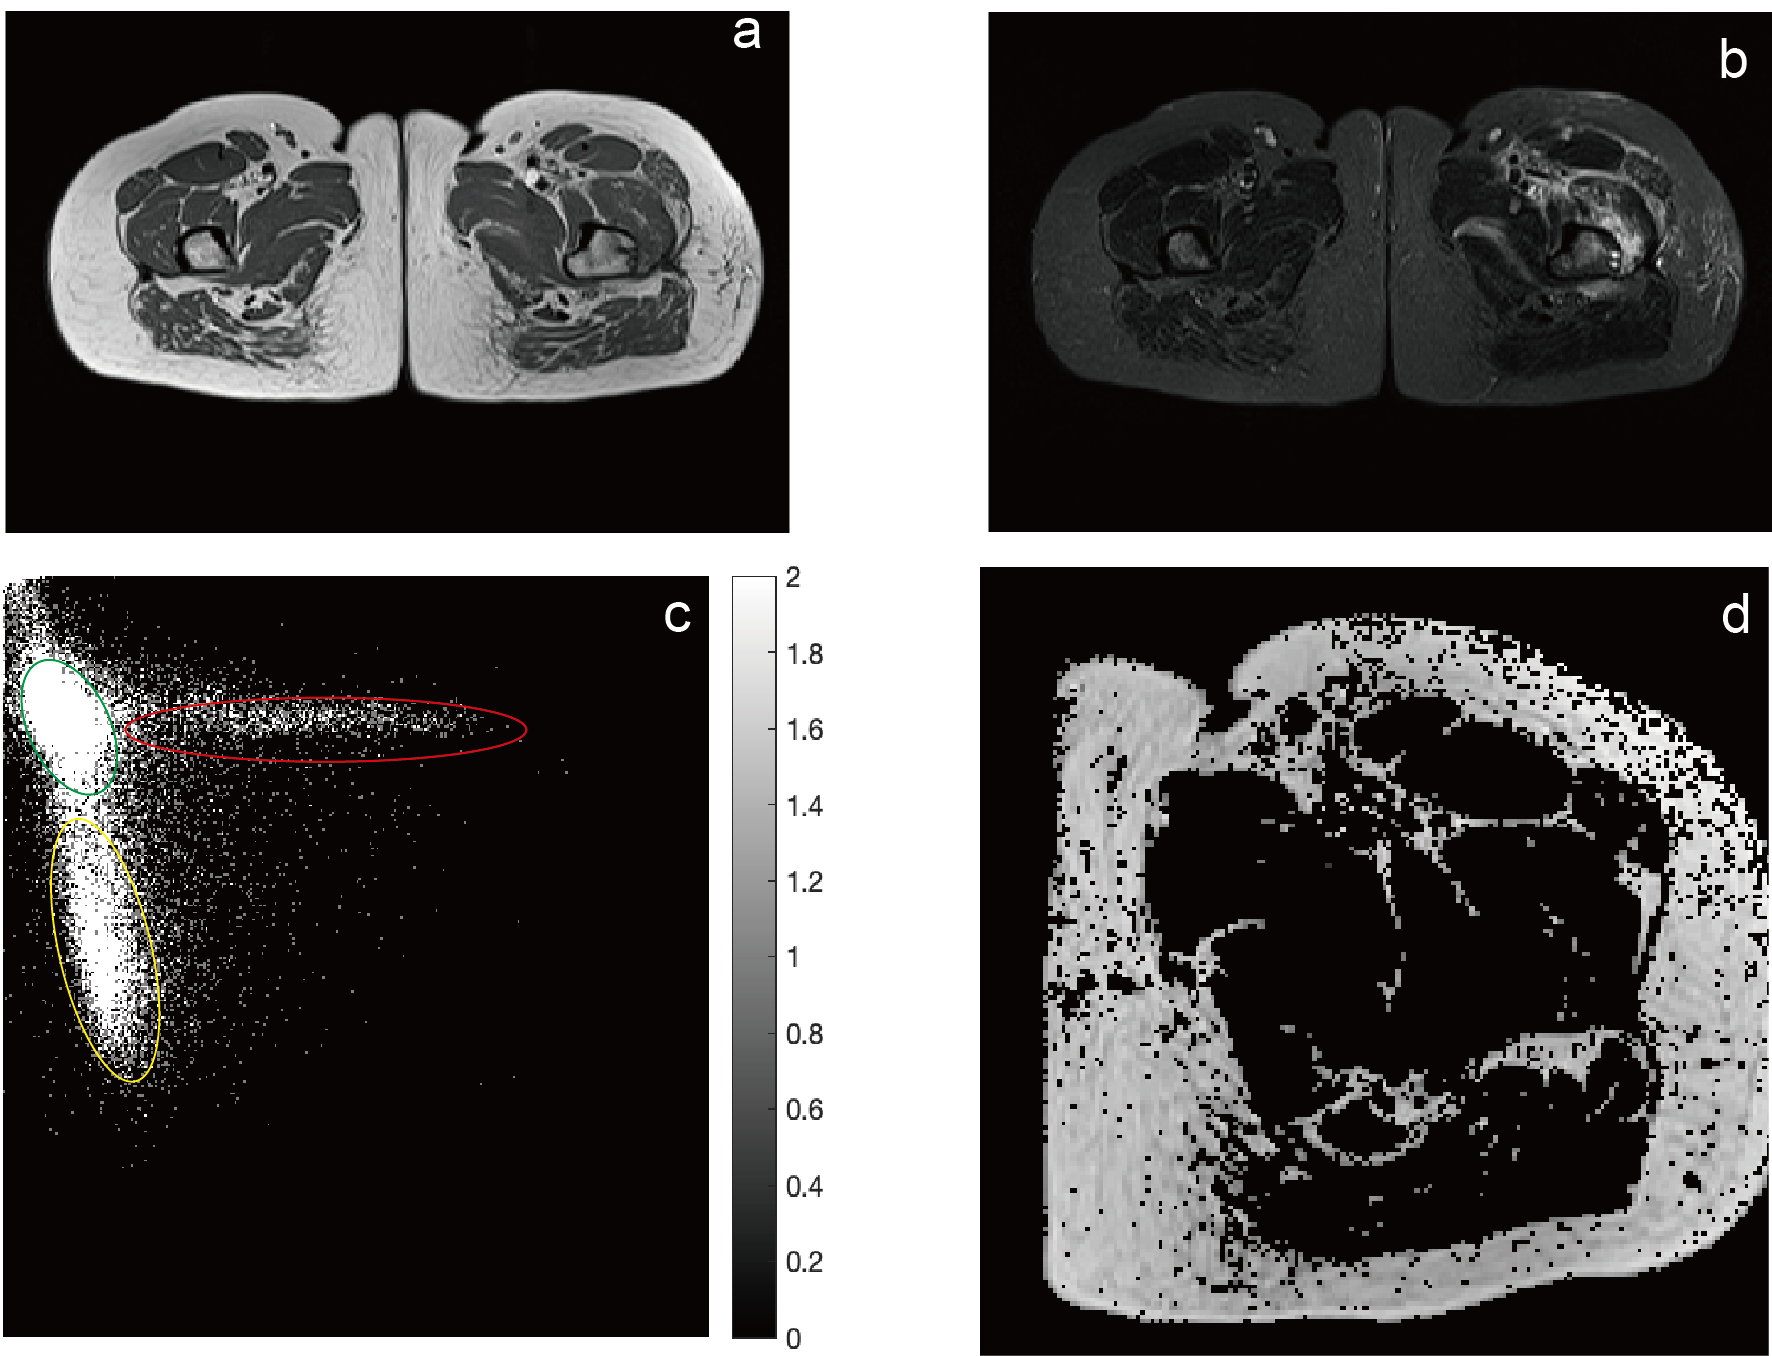
Fig. 1a. An example of T1-weighted images acquired with a fast spin echo sequence.
Fig. 1b. An example of T2-weighted images acquired with a fast spin-echo sequence with fat suppression.
Fig. 1c. An example of the joint histogram of the T1w and T2w signals. The cluster marked by the yellow ellipse corresponds to the fat signals, the cluster of the green ellipse the muscle signals, and the cluster of the red ellipse the signals from blood.
Fig. 1d. The mask of fat determined by applying Gaussian clustering to the joint histogram in c.
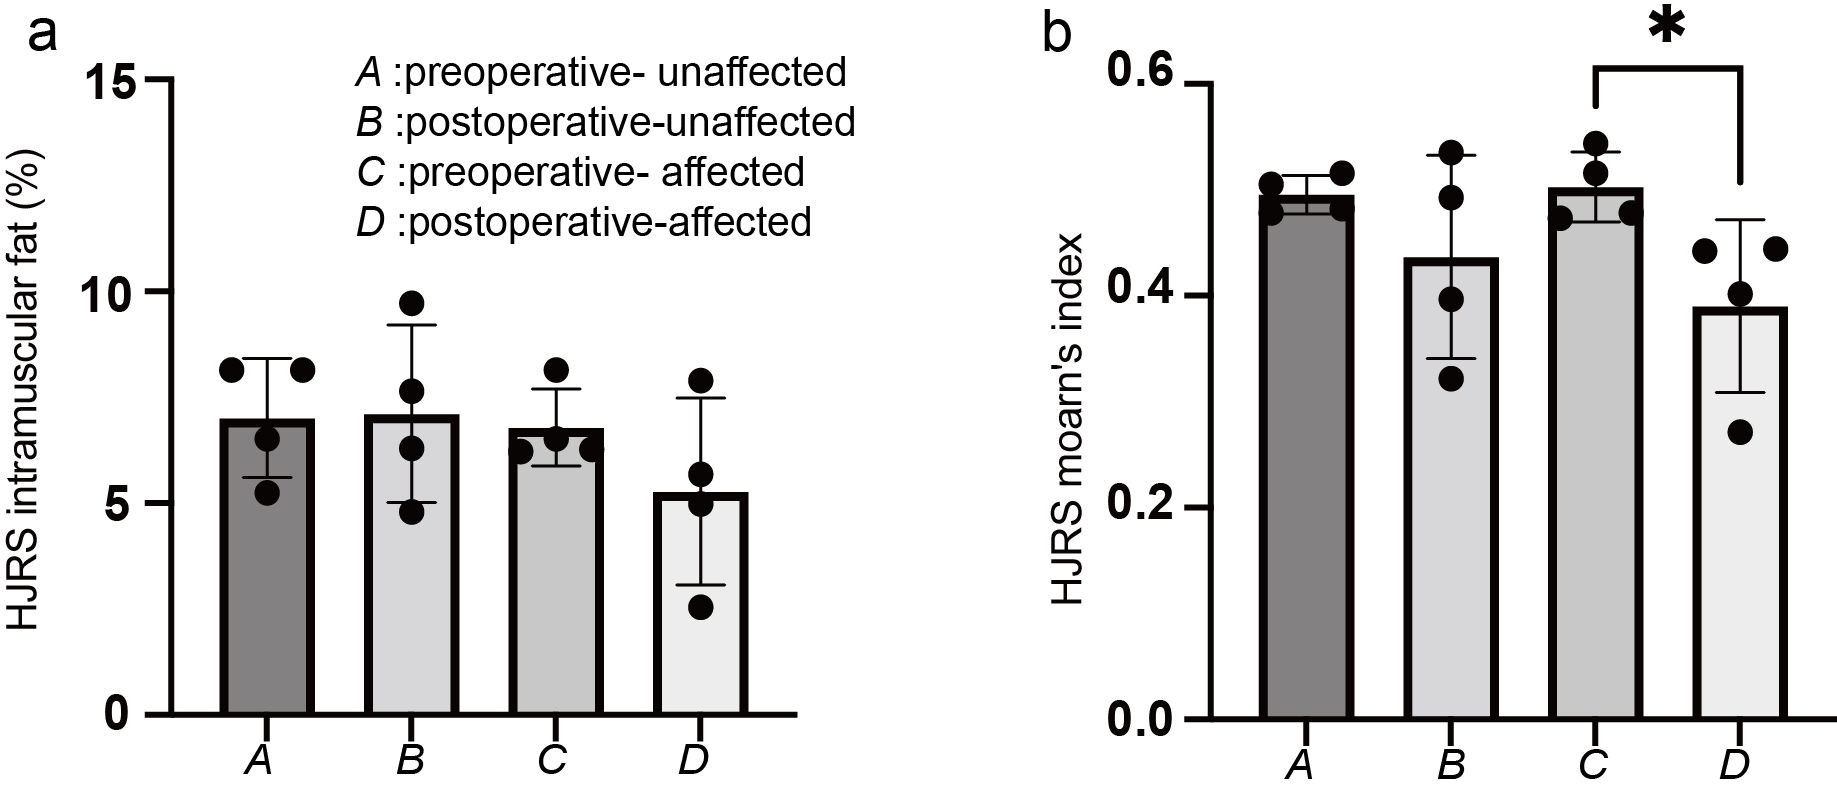
Fig. 2a. The fat content before and after HJRS.
Fig. 2b. The Moran’s index before and after HJRS.
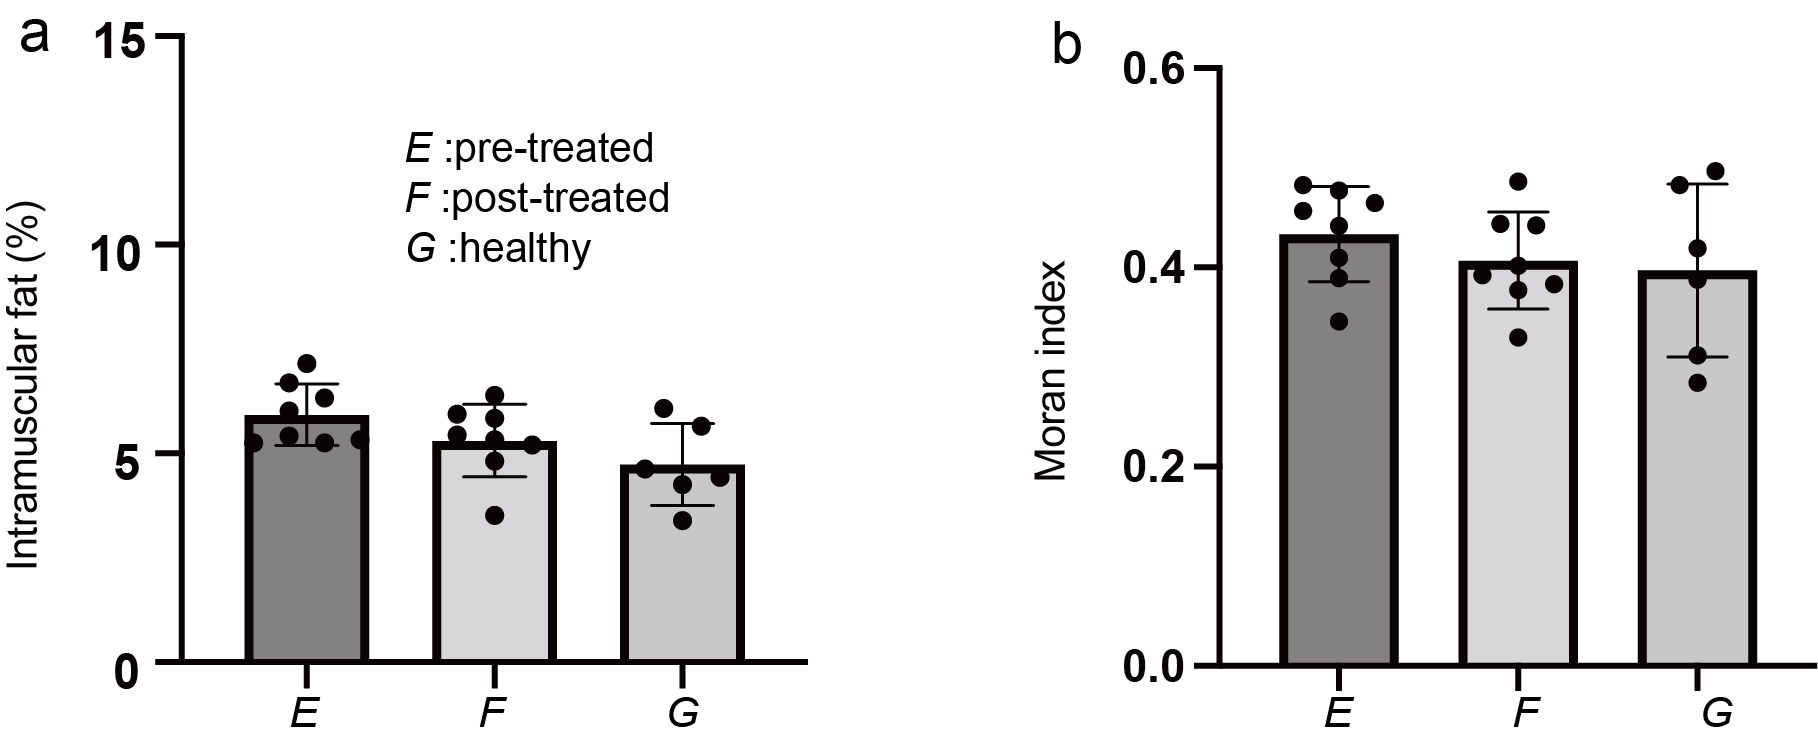
Fig. 3a. The fat content of pre-treated, post-treated AS patients and healthy controls.
Fig.3b. The Moran’s index of pre-treated, post-treated AS patients and healthy controls.