2594
MRI monitors the abnormal muscle glycogen and creatine kinase activity in Pompe disease mice1Shenzhen Institute of Advanced Technology, Chinese Academy of Sciences, Shenzhen, China, 2Medical Imaging Center, The First Affiliated Hospital of Jinan University, Guangzhou, China, 3Department of Information Science and Technology, Northwest University, Xian, China, 4F.M Kirby Research Center, Kennedy Krieger Institute, Baltimore, MD, United States, 5Department of Radiology, Johns Hopkins University School of Medicine, Baltimore, MD, United States
Synopsis
Keywords: Muscle, CEST & MT
Pompe disease (PD) is a glycogen storage disease, characterized by progressive lysosomal glycogen accumulation and changes in energy metabolite levels. There is a lack of methods to noninvasively assess PD progression and treatment response. We demonstrate that saturation transfer MRI can detect changes in glycogen, total creatine (tCr), and phosphocreatine (PCr) in a mouse model of PD and show more than doubling of muscle glycogen levels and a gradual decrease of tCr and PCr levels with age. The simultaneous mapping of these energy metabolites with MRI has potential to assess PD and other diseases involving mitochondrial or energy metabolic disorders.
Introduction
Pompe disease (PD), known as type II glycogen storage disease (GSD II)1 and a lysosomal storage disease2, is caused by gene mutations that disrupt lysosomal acid a-glucosidase (GAA), the only enzyme that hydrolyses glycogen in the lysosome of cells.3 A hallmark of PD is progressive lysosomal glycogen accumulation, leading to lysosome swelling and rupture, cell and tissue damage4, and mitochondrial and energy metabolic dysfunction5. Existing PD assessment approaches, including glycogen 13C magnetic resonance spectroscopy (MRS)6,7 and 2-deoxy-2-[18]fluoro-D-glucose positron emission tomography (18FDG PET)8, are neither specific to underly the disease mechanisms nor widely applied. We hypothesize that the enhanced detection of glycogen (via relayed nuclear Overhauser effects, glycoNOE)9, total creatine (tCr = Cr + PCr)10-12 or phosphocreatine (PCr)13 by ST MRI is a promising approach for non-invasively monitoring PD progression and treatment response. Here we report the successful use of ST MRI to monitor the pathological changes of glycogen, tCr, and PCr levels in the muscle of GAA knock-out mice (6neo)14, together with 1H MRS to monitor the tCr level.Methods
Various concentrations of rabbit liver glycogen, PCr, and Cr were dissolved in PBS(1X), pH 7.3, 37°C. The institutional animal care and use committee approved this study. Homozygous GAA knock-out mice (6neo) were obtained from Jackson Laboratory (Maine, USA), and raised in the institutional animal facility. Adult C57BL/6J mice of 3-5 months old were used as control. All MRI experiments were performed on a horizontal bore 9.4 T Bruker Biospec system. A steady-state ST pulse sequence with a radial-sampling ultrashort echo time (UTE) readout (ST-UTE)15 was used for imaging muscle. In each TR of 35 ms, a saturation pulse (B1 = 0.3, 0.5, 0.7 and 1.0 μT) of 30 ms is applied. Slice thickness = 1.5 mm. A STEAM pulse sequence was used for 1H MRS of muscle over a 3*3*3 mm3 volume (2.5*2.5*2.5 mm3 for the 2-week-old mice cohort). TR/TE = 2000/15 ms; Number of data points = 2048; Averages = 256. 1H spectra were fitted by multi-pool Lorentzian lineshapes to quantify tCr (3.0 ppm and 3.9 ppm) and taurine (Tau, 3.2 ppm and 3.4 ppm) peaks.Z-spectra were analyzed using a two-step multi-Lorentzian fitting protocol. Briefly, reversed MT asymmetry ratio analysis (MTR'asym in Figure 1A) may help to visualize the glycoNOE peak at -1 ppm, but with some contamination. Multi-pool Lorentzian lineshapes were first used to estimate the CEST effects at +1.95 ppm and +2.5 ppm as well as the low-field background spectrum (blue line, Figure 1B). Then, the corrected MTR'asym (cMTR'asym, blue circle line, up-field range) was obtained by subtracting the up-field acquired Z-spectrum from the low-field background spectrum (Figure 1C). The glycoNOE signal was extracted by fitting the cMTR'asym spectrum with multi-pool Lorentzian lineshapes.
Results
The Z-spectra for the three metabolites in vitro show a narrow glycogen peak at -1 ppm (glycoNOE)9, PCr at +1.95 ppm and +2.5 ppm16,17, Cr at around 2 ppm11, as shown in Figure 2. ST experiments were performed on healthy and PD mice (GAA knock-out mouse model 6neo) in vivo. The muscle Z-spectra for both healthy control and PD mice show a glycoNOE peak at -1 ppm, CEST peaks at +2.5 ppm (attributed to PCr) and +1.95 ppm (total creatine, tCr)17. At the age of 2 weeks, PD mice show a similar level of muscle glycoNOE signal compared to healthy control (Figure 3A, B). As the PD mice age, the glycoNOE signal almost doubles at 4 weeks and continues to increase at 8 and 16 weeks, demonstrating the age-dependent accumulation of glycogen in the PD skeletal muscle (Figure 3B-D). Meanwhile, 1H spectra and Z-spectra present a higher level of tCr at 2-weeks compared with the healthy control. The tCr level continues to decrease from 2-weeks to 16-weeks. Additionally, the +2.5 ppm peak shows the PCr level also decreased with PD mouse age. Signal maps show a relatively homogenous distribution of glycogen, tCr, and PCr over the skeletal muscle of both healthy and PD mice (Figure 3E, F). The relative signal levels of the three metabolites in PD mice at different ages were quantified and are shown in Figure 4.Discussion
Serum CK level has been widely used as diagnostic test for muscle injury and disease,18 and elevation of blood CK was reported in PD patients.19 It is therefore not surprising that altered tCr and PCr levels in the muscle of PD mice were observed, together with the accumulation of muscle glycogen. The CK activity has been suggested to be positively correlated to tCr level.20 Accordingly, the data here (Figure 4B) might suggest a reduced muscle cellular CK activity in adult PD mice, and a further validation from tissue assay is needed in future studies. Interestingly, a previous 31P MRS study7 on PD mice reported an elevated phosphomonoesters (PME)/ATP but no significant alteration of PCr/ATP ratio, which appears contradictory to the PCr data (Figure 4C). This might be due to a similar decrease of total ATP level in PD mice.Conclusion
The simultaneous mapping of the three energy metabolites may be applied into the assessment of a wide spectrum of diseases with metabolic or mitochondrial disorders, for instance, glycogen and lysosomal storage diseases, myopathies21 and heart diseases22.Acknowledgements
This study is supported by National Natural Science Foundation of China (82171904), Key Laboratory for Magnetic Resonance and Multimodality Imaging of Guangdong Province (2020B1212060051);References
1 Adeva-Andany, M. M., González-Lucán, M., Donapetry-García, C., Fernández-Fernández, C. & Ameneiros-Rodríguez, E. Glycogen metabolism in humans. BBA Clin 5, 85-100, (2016).
2 Platt, F. M., d’Azzo, A., Davidson, B. L., Neufeld, E. F. & Tifft, C. J. Lysosomal storage diseases. Nature Reviews Disease Primers 4, 27, (2018).
3 Lim, J. A., Kakhlon, O., Li, L., Myerowitz, R. & Raben, N. Pompe disease: Shared and unshared features of lysosomal storage disorders. Rare diseases (Austin, Tex.) 3, e1068978, (2015).
4 Thurberg, B. L. et al. Characterization of pre- and post-treatment pathology after enzyme replacement therapy for pompe disease. Laboratory Investigation 86, 1208-1220, (2006).
5 Schoser, B. Pompe disease: what are we missing? Annals of translational medicine 7, 292, (2019).
6 Wary, C. et al. Evaluation of muscle glycogen content by 13C NMR spectroscopy in adult-onset acid maltase deficiency. Neuromuscular Disorders 13, 545-553, (2003).
7 Baligand, C. et al. 13C/31P MRS Metabolic Biomarkers of Disease Progression and Response to AAV Delivery of hGAA in a Mouse Model of Pompe Disease. Molecular Therapy - Methods & Clinical Development 7, 42-49, (2017).
8 Plöckinger, U., Prasad, V., Ziagaki, A., Tiling, N. & Poellinger, A. 2-deoxy-2-[18]fluoro-D-glucose PET/CT (18FDG PET/CT) may not be a viable biomarker in Pompe disease. Human genomics 12, 14, (2018).
9 Zhou, Y. et al. Magnetic resonance imaging of glycogen using its magnetic coupling with water. Proceedings of the National Academy of Sciences 117, 3144-3149, (2020).
10 Sun, P. Z., Farrar, C. T. & Sorensen, A. G. Correction for artifacts induced by B0 and B1 field inhomogeneities in pH-sensitive chemical exchange saturation transfer (CEST) imaging. Magnetic Resonance in Medicine 58, 1207-1215, (2007).
11 Haris, M. et al. Exchange rates of creatine kinase metabolites: feasibility of imaging creatine by chemical exchange saturation transfer MRI. NMR in Biomedicine 25, 1305-1309, (2012).
12 Haris, M. et al. A technique for in vivo mapping of myocardial creatine kinase metabolism. Nature Medicine 20, 209-214, (2014).
13 Chen, L. et al. In vivo imaging of phosphocreatine with artificial neural networks. Nature Communications 11, 1072, (2020).
14 Raben, N. et al. Targeted disruption of the acid alpha-glucosidase gene in mice causes an illness with critical features of both infantile and adult human glycogen storage disease type II. J Biol Chem 273, 19086-19092, (1998).
15 Chen, L. et al. Protein aggregation linked to Alzheimer's disease revealed by saturation transfer MRI. NeuroImage 188, 380-390, (2019).
16 Chen, L. et al. In vivo imaging of phosphocreatine with artificial neural networks. Nat. Commun. 11, 1072, (2020).
17 Chen, L., Barker, P. B., Weiss, R. G., van Zijl, P. C. M. & Xu, J. Creatine and phosphocreatine mapping of mouse skeletal muscle by a polynomial and Lorentzian line-shape fitting CEST method. Magn Reson Med 81, 69-78, (2019).
18 Moghadam-Kia, S., Oddis, C. V. & Aggarwal, R. Approach to asymptomatic creatine kinase elevation. Cleveland Clinic journal of medicine 83, 37-42, (2016).
19 Winkel, L. P. et al. The natural course of non-classic Pompe's disease; a review of 225 published cases. Journal of neurology 252, 875-884, (2005).
20 Wyss, M. & Kaddurah-Daouk, R. Creatine and Creatinine Metabolism. Physiological Reviews 80, 1107-1213, (2000).
21 Tarnopolsky, M. A. Myopathies Related to Glycogen Metabolism Disorders. Neurotherapeutics : the journal of the American Society for Experimental NeuroTherapeutics 15, 915-927, (2018).
22 Liu, J. et al. Dynamic alteration in myocardium creatine during acute infarction using MR CEST imaging. NMR in Biomedicine 35, e4704, (2022).
Figures
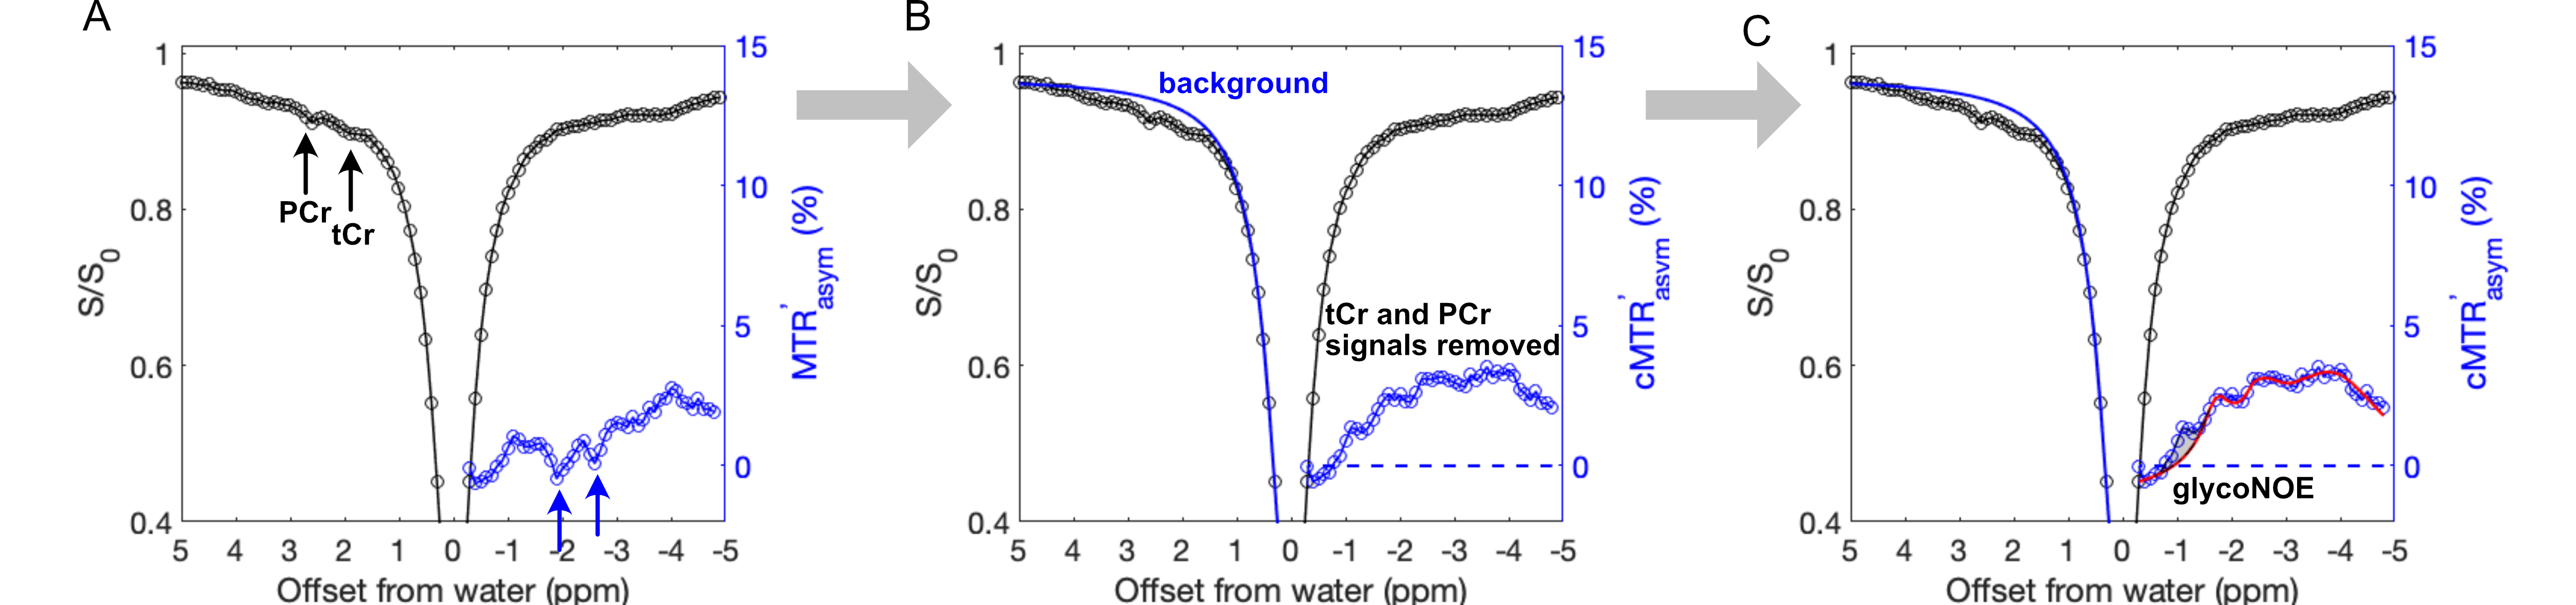
Figure 1. Illustration of glycogen signal quantification based on the reversed Z-spectrum asymmetry analysis. (A) MTR'asym shows glycogen signal (at -1 ppm) that is mixed with CEST effects. (B) Corrected MTR'asym (cMTR'asym) was constructed by subtracting negative-side Z-spectrum from the estimated background of positive-side Z-spectrum. (C) The glycoNOE peak (grey area) was extracted by fitting the cMTR'asym spectrum with multi-pool Lorentzian lineshapes. B1 = 0.5 μT.
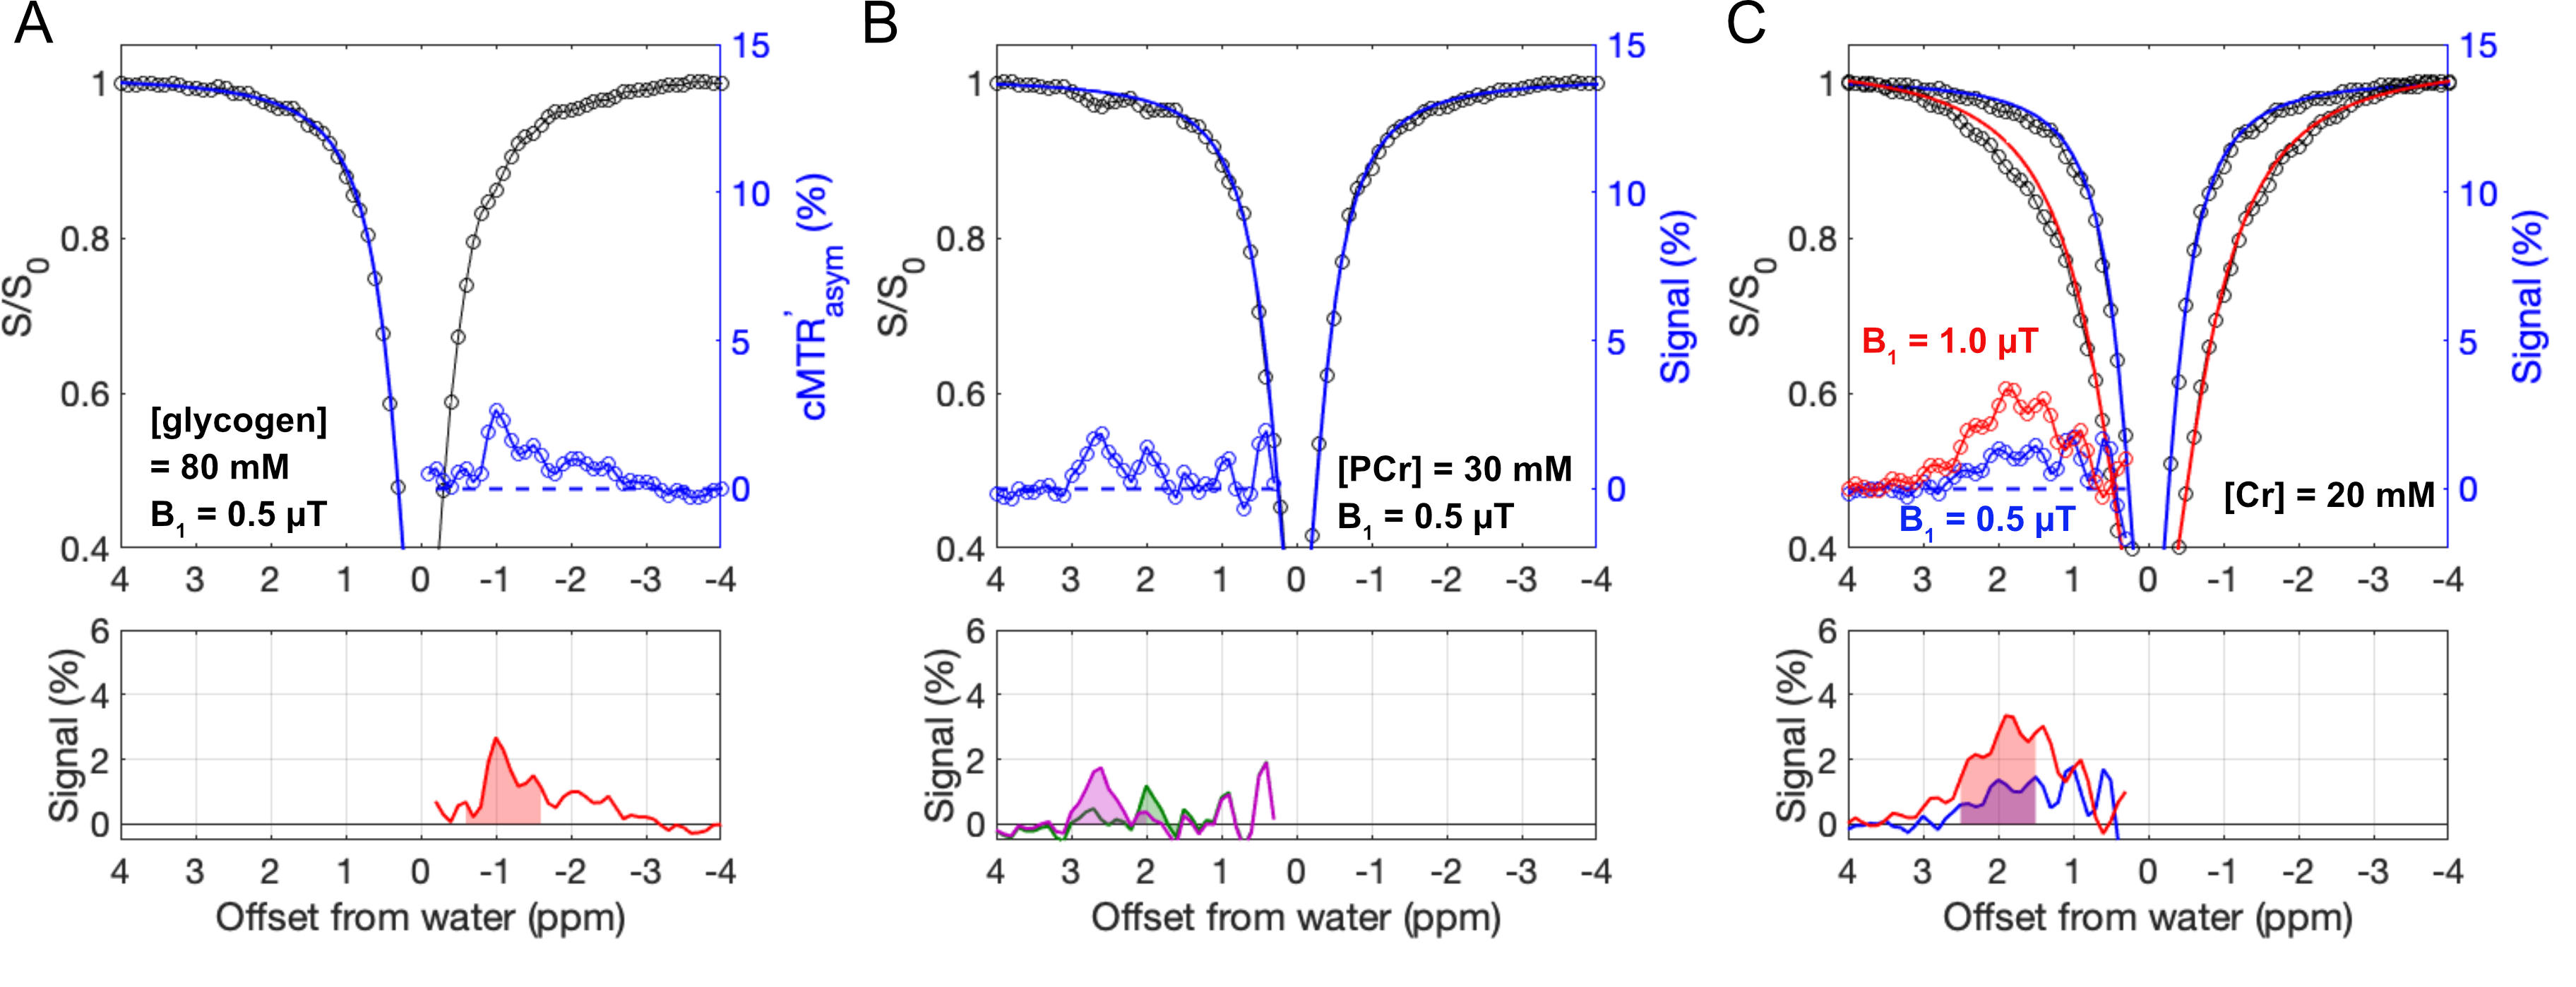
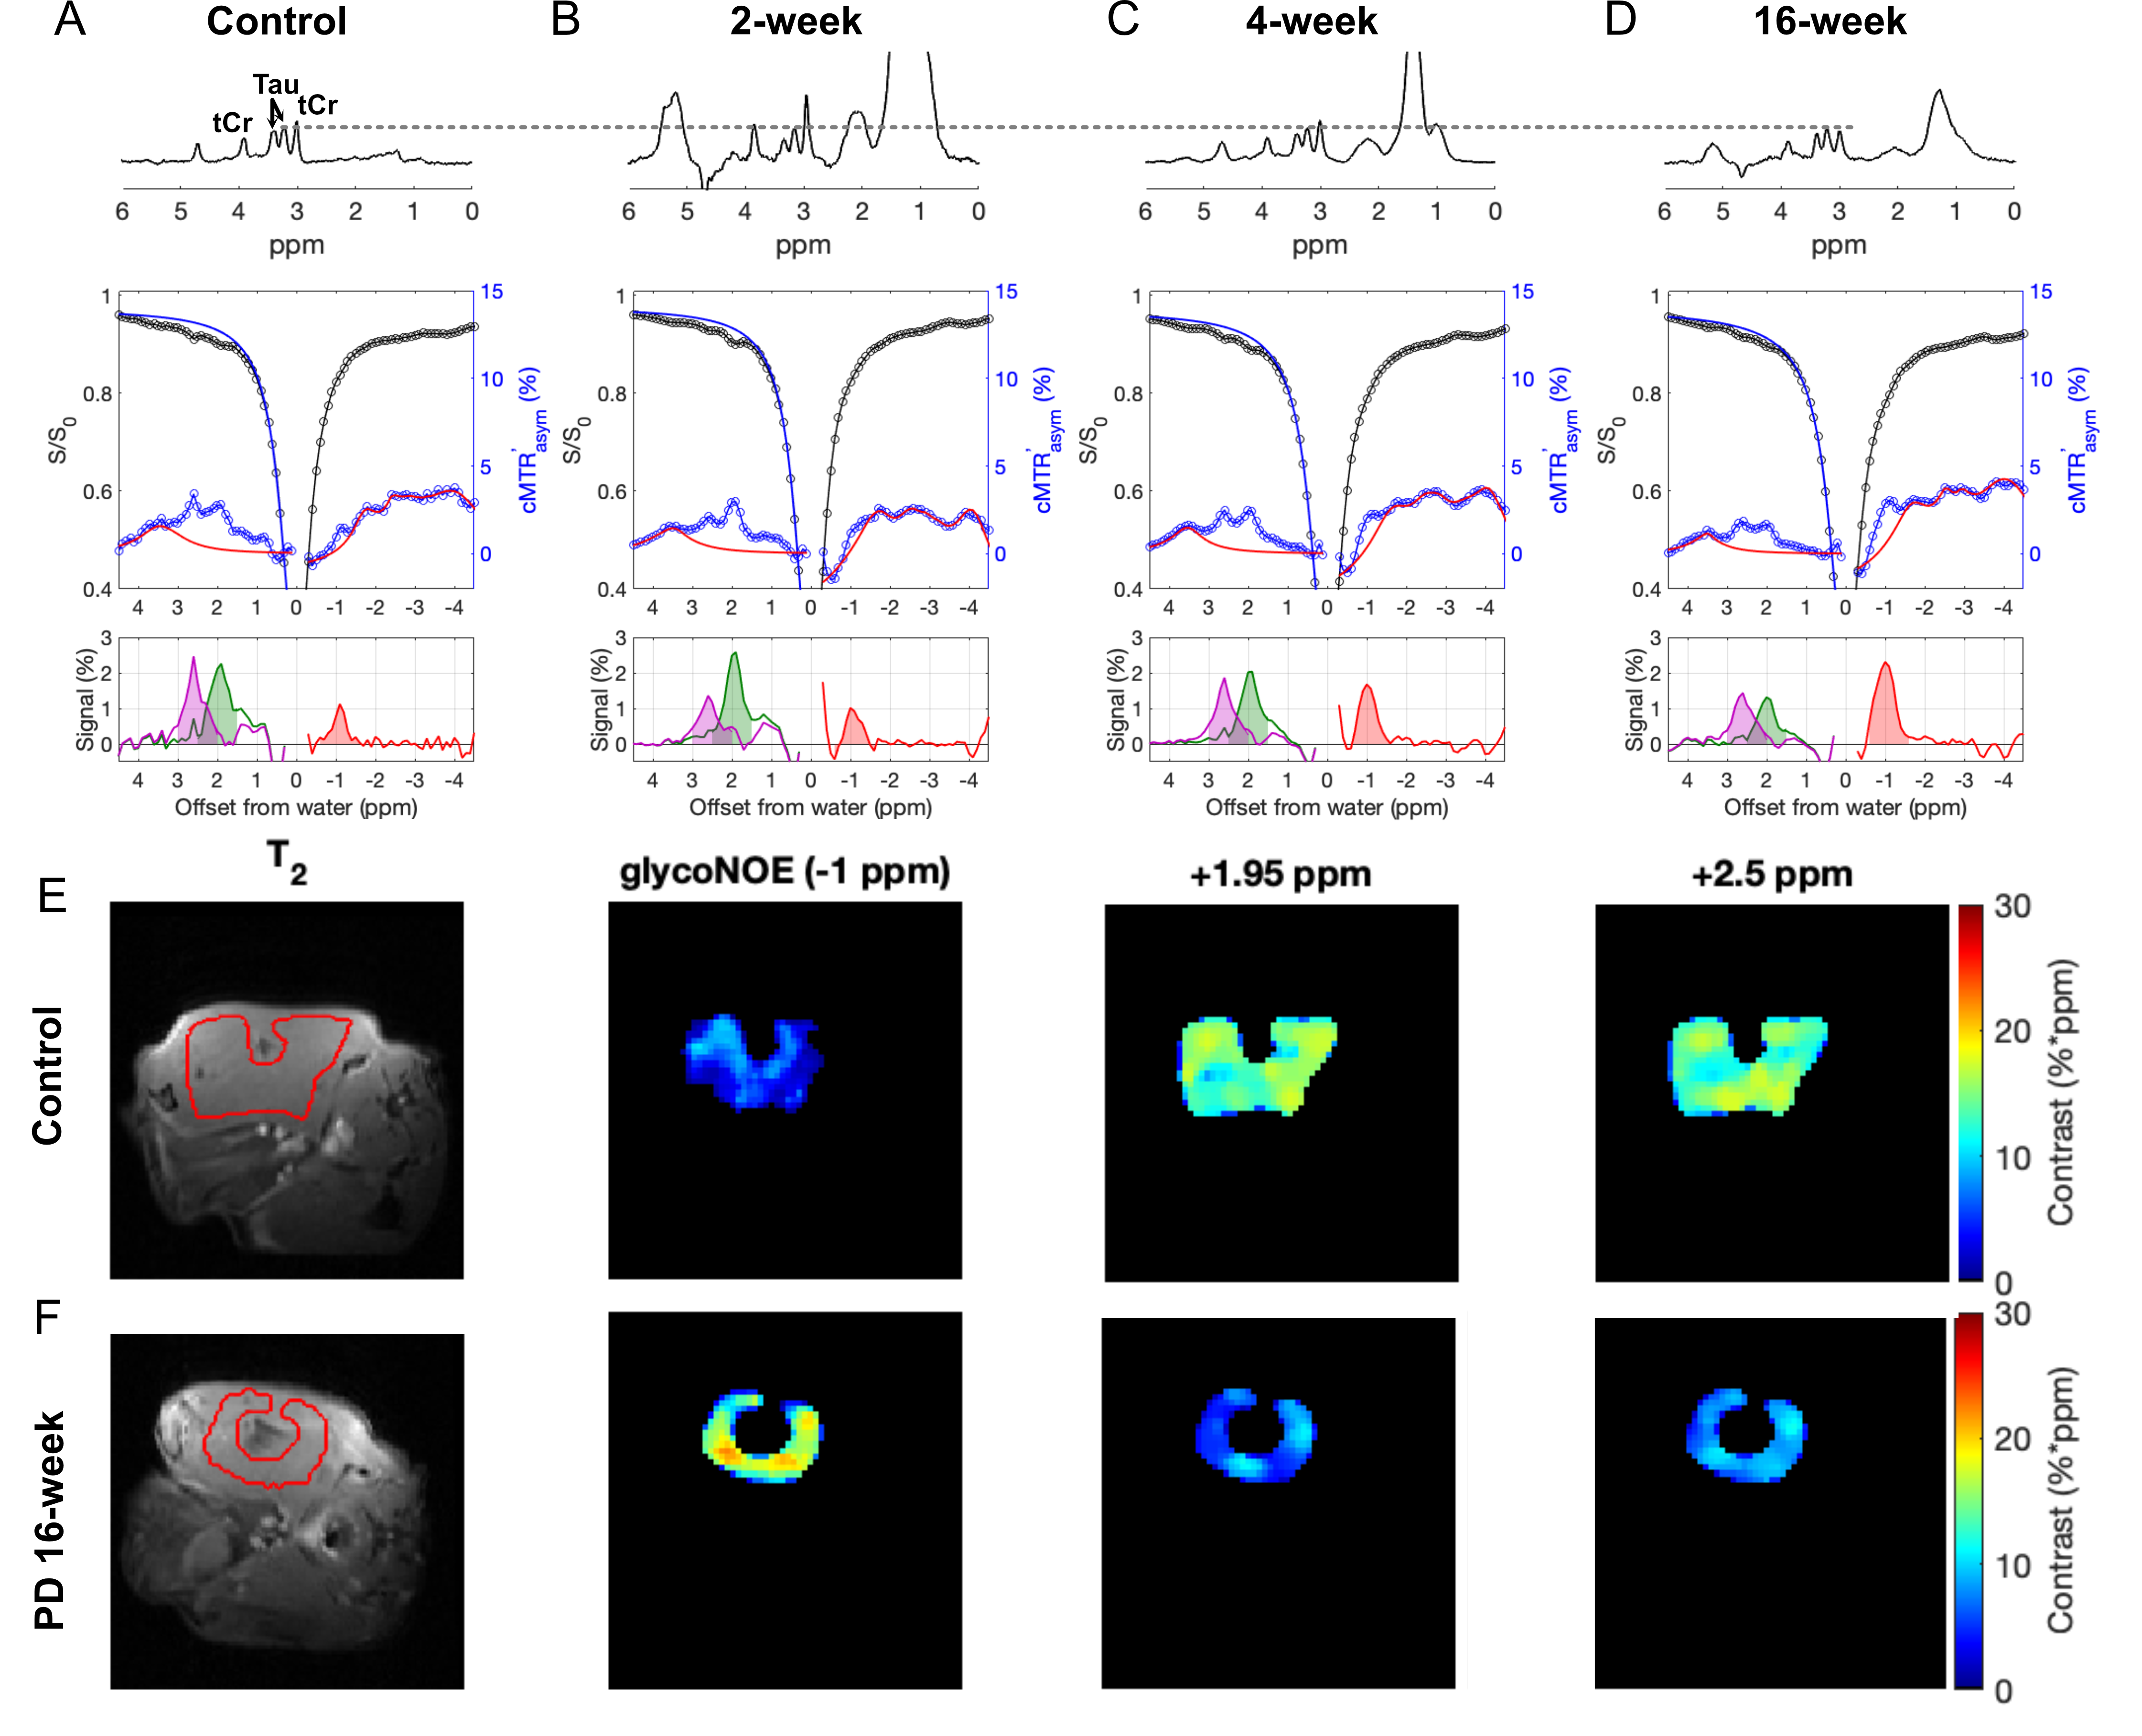
Figure 3. In vivo 1H spectra and CEST Z-spectra of the skeletal muscle from a healthy control mouse (A) and Pompe disease (PD) mice at age of 2 weeks (B), 4 weeks (C), and 16 weeks (D). 1H spectra were aligned using the taurine (Tau) peak at 3.2 ppm. The glycoNOE, +1.95 ppm, and +2.5 ppm signal was quantified from the Z-spectra (B1 = 0.5 μT) by using a two-step multiple Lorentzian fitting method and shown at the bottom of A-D. (E, F) Representative signal maps of leg muscle region in a control and a 16-week-old PD mouse.
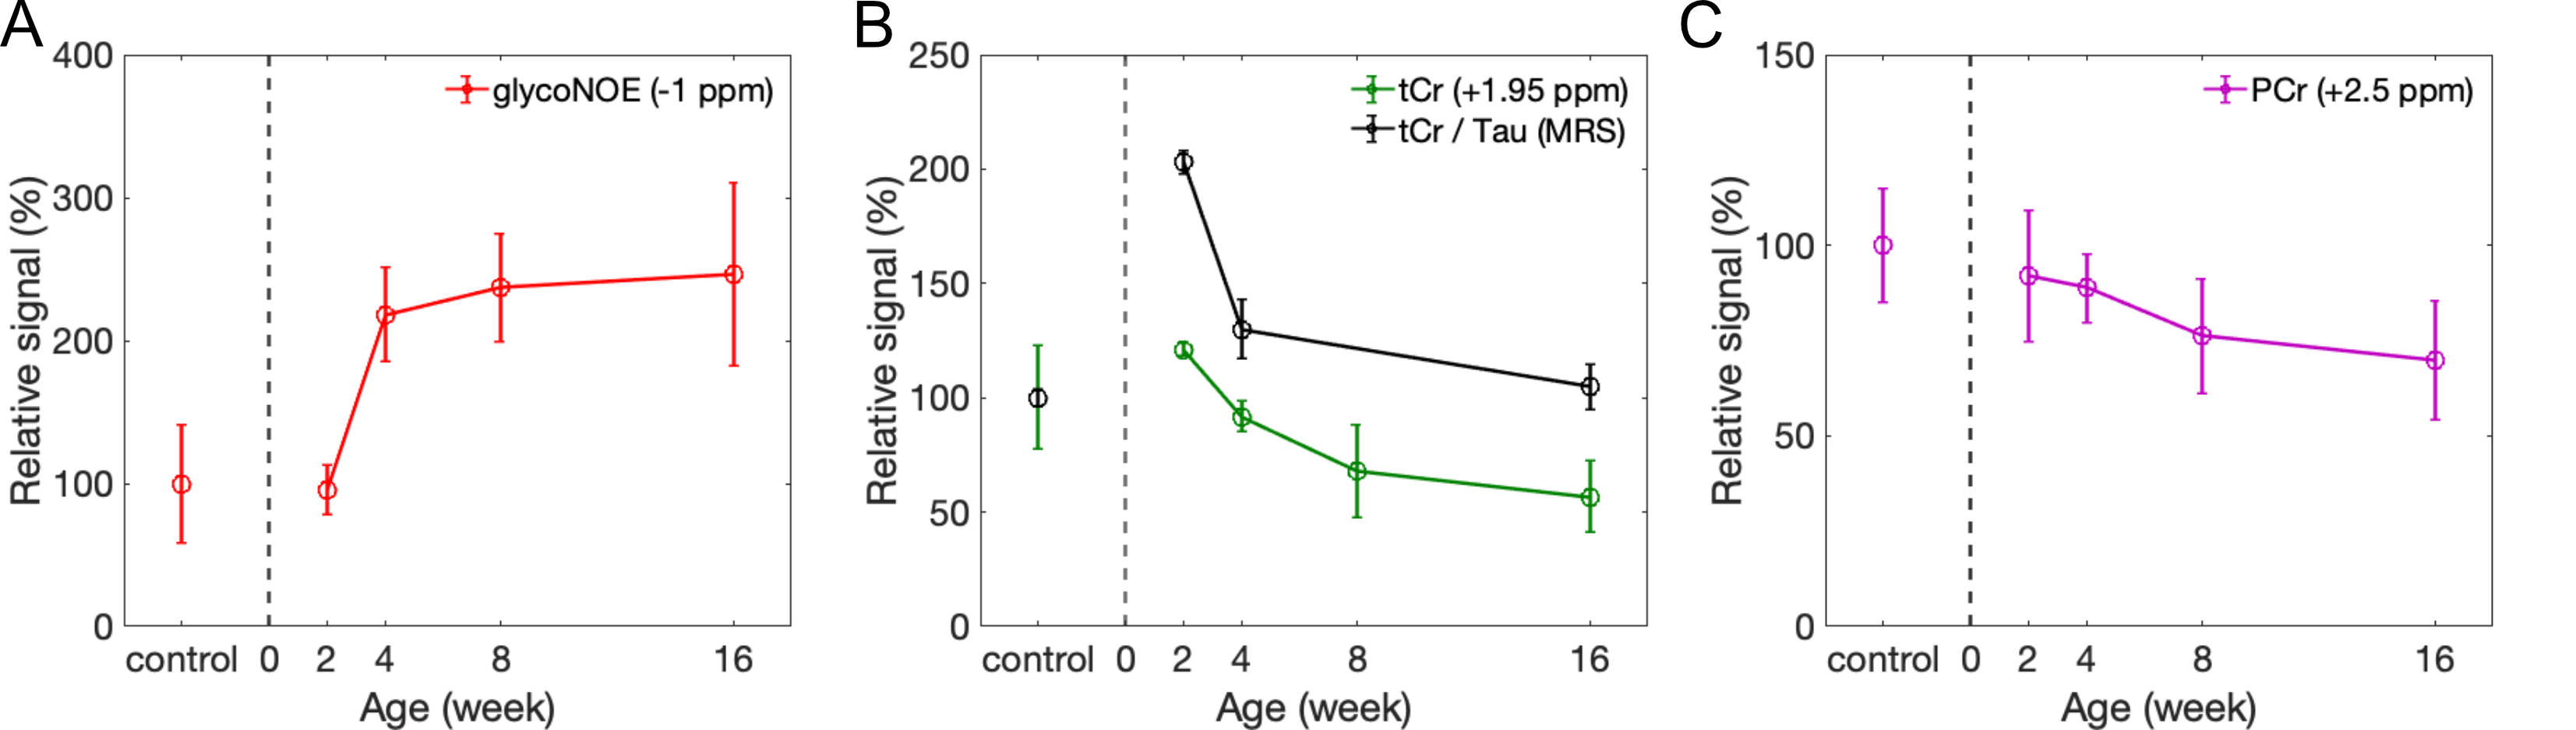
Figure 4. The relative signal levels of glycogen (A), tCr (B), and PCr (C) in PD mice at 2, 4, 8, and 16 weeks compared with healthy control (n =4, 5, 4, 9, and 7, respectively). The tCr (3.0 ppm and 3.9 ppm) and Tau (3.2 ppm and 3.4 ppm) peaks in MRS were fitted by multi-pool Lorentzian lineshapes, and quantified by the integral of the peaks. tCr/Tau was calculated as the ratio between the sum of two tCr signals and sum of two Tau signals.