2592
Multi-parametric measures of in-vivo T2* mapping with δUTE and macromolecule exchange ZAP/CEST of cartilage, tendon, and muscle tissue in foot.
Vadim Malis1, Won Bae1,2, Diana Vucevic1, Yoshimori Kassai3, and Mitsue Miyazaki1
1Radiology, UC San Diego, San Diego, CA, United States, 2VA San Diego Healthcare System, San Diego, CA, United States, 3Canon Medical, Ōtawara-shi, Japan
1Radiology, UC San Diego, San Diego, CA, United States, 2VA San Diego Healthcare System, San Diego, CA, United States, 3Canon Medical, Ōtawara-shi, Japan
Synopsis
Keywords: Tendon/Ligament, CEST & MT, UTE, Ultra-short TE
A δUTE sequence allows for collecting multiple echoes with short echo time intervals, without the restriction of in-phase TEs. This study utilizes data collected with δUTE for bi-exponential T2* mapping of cartilage, muscle and tendon tissues in a human foot. The same anatomies are also evaluated using Z-spectrum Analysis Protons (ZAP) and Chemical exchange saturation transfer (CEST). While ZAP imaging provides overall exchange proton quantification of free and restricted exchange protons in a wide range of frequencies, CEST focuses on specific hydroxy (-OH, at 1.0 ppm), amine (-NH2, at 2 ppm), and amide (-NH, at 3.5 ppm) protons.Introduction
Multi-parametric quantitative measures of macromolecule exchange protons can be characterized by Z-spectrum analysis protons (ZAP) for entire exchange protons and chemical exchange saturation transfer (CEST) for specific exchange protons. Normal multi-parametric quantitative measures may open a chance to be a differentiator like biomarkers of diseases. While tissues like muscle and cartilage are predominantly composed of long $$$T_{2}^{*}$$$ components and can be visualized using conventional MR pulse sequences, tissues with short relaxation times and low proton density such as tendons and connective tissues require ultra-short TE (UTE) imaging with TE of less than 0.1ms [1]. ZAP uses a two-compartment model to estimate fractions and apparent T2 relaxation times of restricted and relatively free exchange protons from a wide range of frequencies (-100 to 100 kHz) [2]. CEST detects specific exchange groups such as hydroxy (-OH, ~1.0ppm), amine (-NH2, ~2ppm) and amide (-NH, ~3.5ppm) which are processed to provide MTRAsym signals [3]. This study aims to establish the multi-parametric quantitative CEST and ZAP measures in cartilage, tendon, and muscle tissues and performs bi-exponential $$$T_{2}^{*}$$$ mapping of the same anatomies using the multi-echo δUTE sequence on healthy volunteers with the future goal of utilizing these metrics as biomarkers of the diseases.Methods
Three healthy volunteers (35 ± 10 years) were scanned on a clinical 3T scanner (Vantage Galan 3T, Canon Medical, Japan) after obtaining informed consent. Images were acquired with a 16-ch foot and ankle SPEEDER coil. The imaging protocol included three imaging series: (i) a multi-echo 3D UTE with six TEs=0.096/2.3/4.5/6.7/8.9/11.1ms (evenly spaced by 2.2ms), TR=14.7 ms, NEX=1, FA=4°, FOV =35×35cm in the sagittal orientation and matrix size 256×256; additional echoes were acquired with (ii) δUTE allowing for tightly spaced TEs=0.34/0.74/1.14/1.54ms (TE=0.4ms.) [4]. (iii) 2D single-shot FSE (TE=10 ms, NEX=1, FA=90°) with magnetization transfer (MT) preparation pulses at 56 off-resonance frequencies ranging from -120 to 100kHz, acquired in a centric pattern starting from 0 with the increasing alternating positive/negative offsets, FOV=35×35cm, matrix size 384×356, single 5-mm thick slice, and B1rms of about 1-2μT. The total scan time was 16 minutes. Four regions of interest corresponding to cartilage calcaneus, cartilage talus, Achilles tendon, and soleus muscle were identified and manually drawn on the image from series (iii). $$$T_{2}^{*}$$$ per voxel mapping was performed by fitting a time-dependent signal curve into the bi-exponential model described by equation [Eq. 1].$$S(t)=S_{s}(0)\cdot {\exp{(-t/\mathrm{T_{2s}^*)}}} +S_{l}(0)\cdot {\exp{(-t/\mathrm{T_{2l}^*)}}} + S' \quad \quad \quad [Eq. 1]$$
where $$$T_{2s}^{*}$$$ and $$$T_{2l}^{*}$$$ are short and long relaxation times, S’ is the term to account for noise, fractions of long and short components were calculated as follows:
$$ F_{s} = \frac{S_{s}}{S_{s}+S_{l}} \cdot 100\% \quad \quad \quad \quad \quad \quad \quad \quad \quad \quad \quad \quad \quad [Eq. 2.1] $$
$$ F_{l} = \frac{S_{l}}{S_{s}+S_{l}} \cdot 100\% \quad \quad \quad \quad \quad \quad \quad \quad \quad \quad \quad \quad \quad [Eq. 2.2] $$
The two-compartment model Z-spectrum fitting yielded several metrics such as apparent relaxation times $$$(T_{2,f}^{ex}$$$ and $$$T_{2,r}^{ex})$$$ in free and restricted proton pools, respectively, and their fractions $$$(F_{f}$$$ and $$$F_{r})$$$. The images corresponding to the narrower offset range [-900Hz, 900Hz] were used to obtain CEST-spectrum and calculate MTRAsym. For each region, a B0 correction was performed prior to the analysis [5].
Results
Bi-exponential model fit colormaps for one of the volunteers are shown in Figure 1. The short $$$(T_{2s}^{*})$$$ and long $$$(T_{2l}^{*})$$$ relaxation time maps are shown in Figures 1a and 1b, respectively. Figures 1c and 1d show short $$$(F_{s})$$$ and long $$$(F_{l})$$$ components fractions, respectively. The average values for the fits are summarized in Table 1. Z-spectrum fits for one of the participants are given in Figure 2b-e and the MTRAsym plots are presented in Figure 2f-i. Free and restricted exchange protons fractions colormaps are demonstrated in Figures 4a and 4b, respectively, while the apparent $$$T_{2,f}^{ex}$$$ and $$$T_{2,r}^{ex}$$$ are shown in Figures 3c and 3d, respectively. Table 2 provides the average values of Z-spectrum analysis and summarizes MTRAsym observations for all the anatomies.Discussion
The results of the bi-exponential fit analysis were in good agreement with the results previously reported in the study conducted on ex-vivo specimens [6]. As anticipated the fraction of the short component, $$$F_{s}$$$, was highest in the tendon and the smallest in the soleus muscle. Both cartilage regions showed very similar $$$T_{2}^{*}$$$ results. ZAP results varied for different anatomies. The smallest fraction of restricted exchange protons Fr was found in the soleus muscle (~6%) and the largest in the Achilles tendon (~24%). The results of both cartilage regions were again similar with restricted exchange proton fraction (~14%), yet the apparent $$$T_{2,f}^{ex}$$$ was higher in the calcaneus cartilage (1975μs) than in the talus (1444μs). Distinguishable CEST peaks were found at ~1ppm (–OH group) in both cartilages, tendon, and muscle with an additional ~2ppm (–NH2 group) peak identified in tendon and soleus muscle.Conclusion
In this study, we successfully utilized δUTE imaging sequence to obtain bi-exponential fits for several tissues in a human foot in-vivo and established their quantitative CEST and ZAP measures.Acknowledgements
This work was supported by Canon Medical Systems, Japan (grant 35938).References
[1] Chang EY., et al., J Magn Reson Imaging. 41(4), 870-83. (2015).[2] Miyazaki M., et al., PLOS ONE. 10(3), (2015).
[3] van Zijl PC., et al., Magn Reson Med. 65(4), 927-48. (2011).
[4] Malis V., et al., submitted in ISMRM. (2023).
[5] Kanazawa Y., et al., MRMS. 17(1), 86-94. (2018).
[6] Biswas R., et al., Bone. 50(3), 749-55. (2012).
Figures
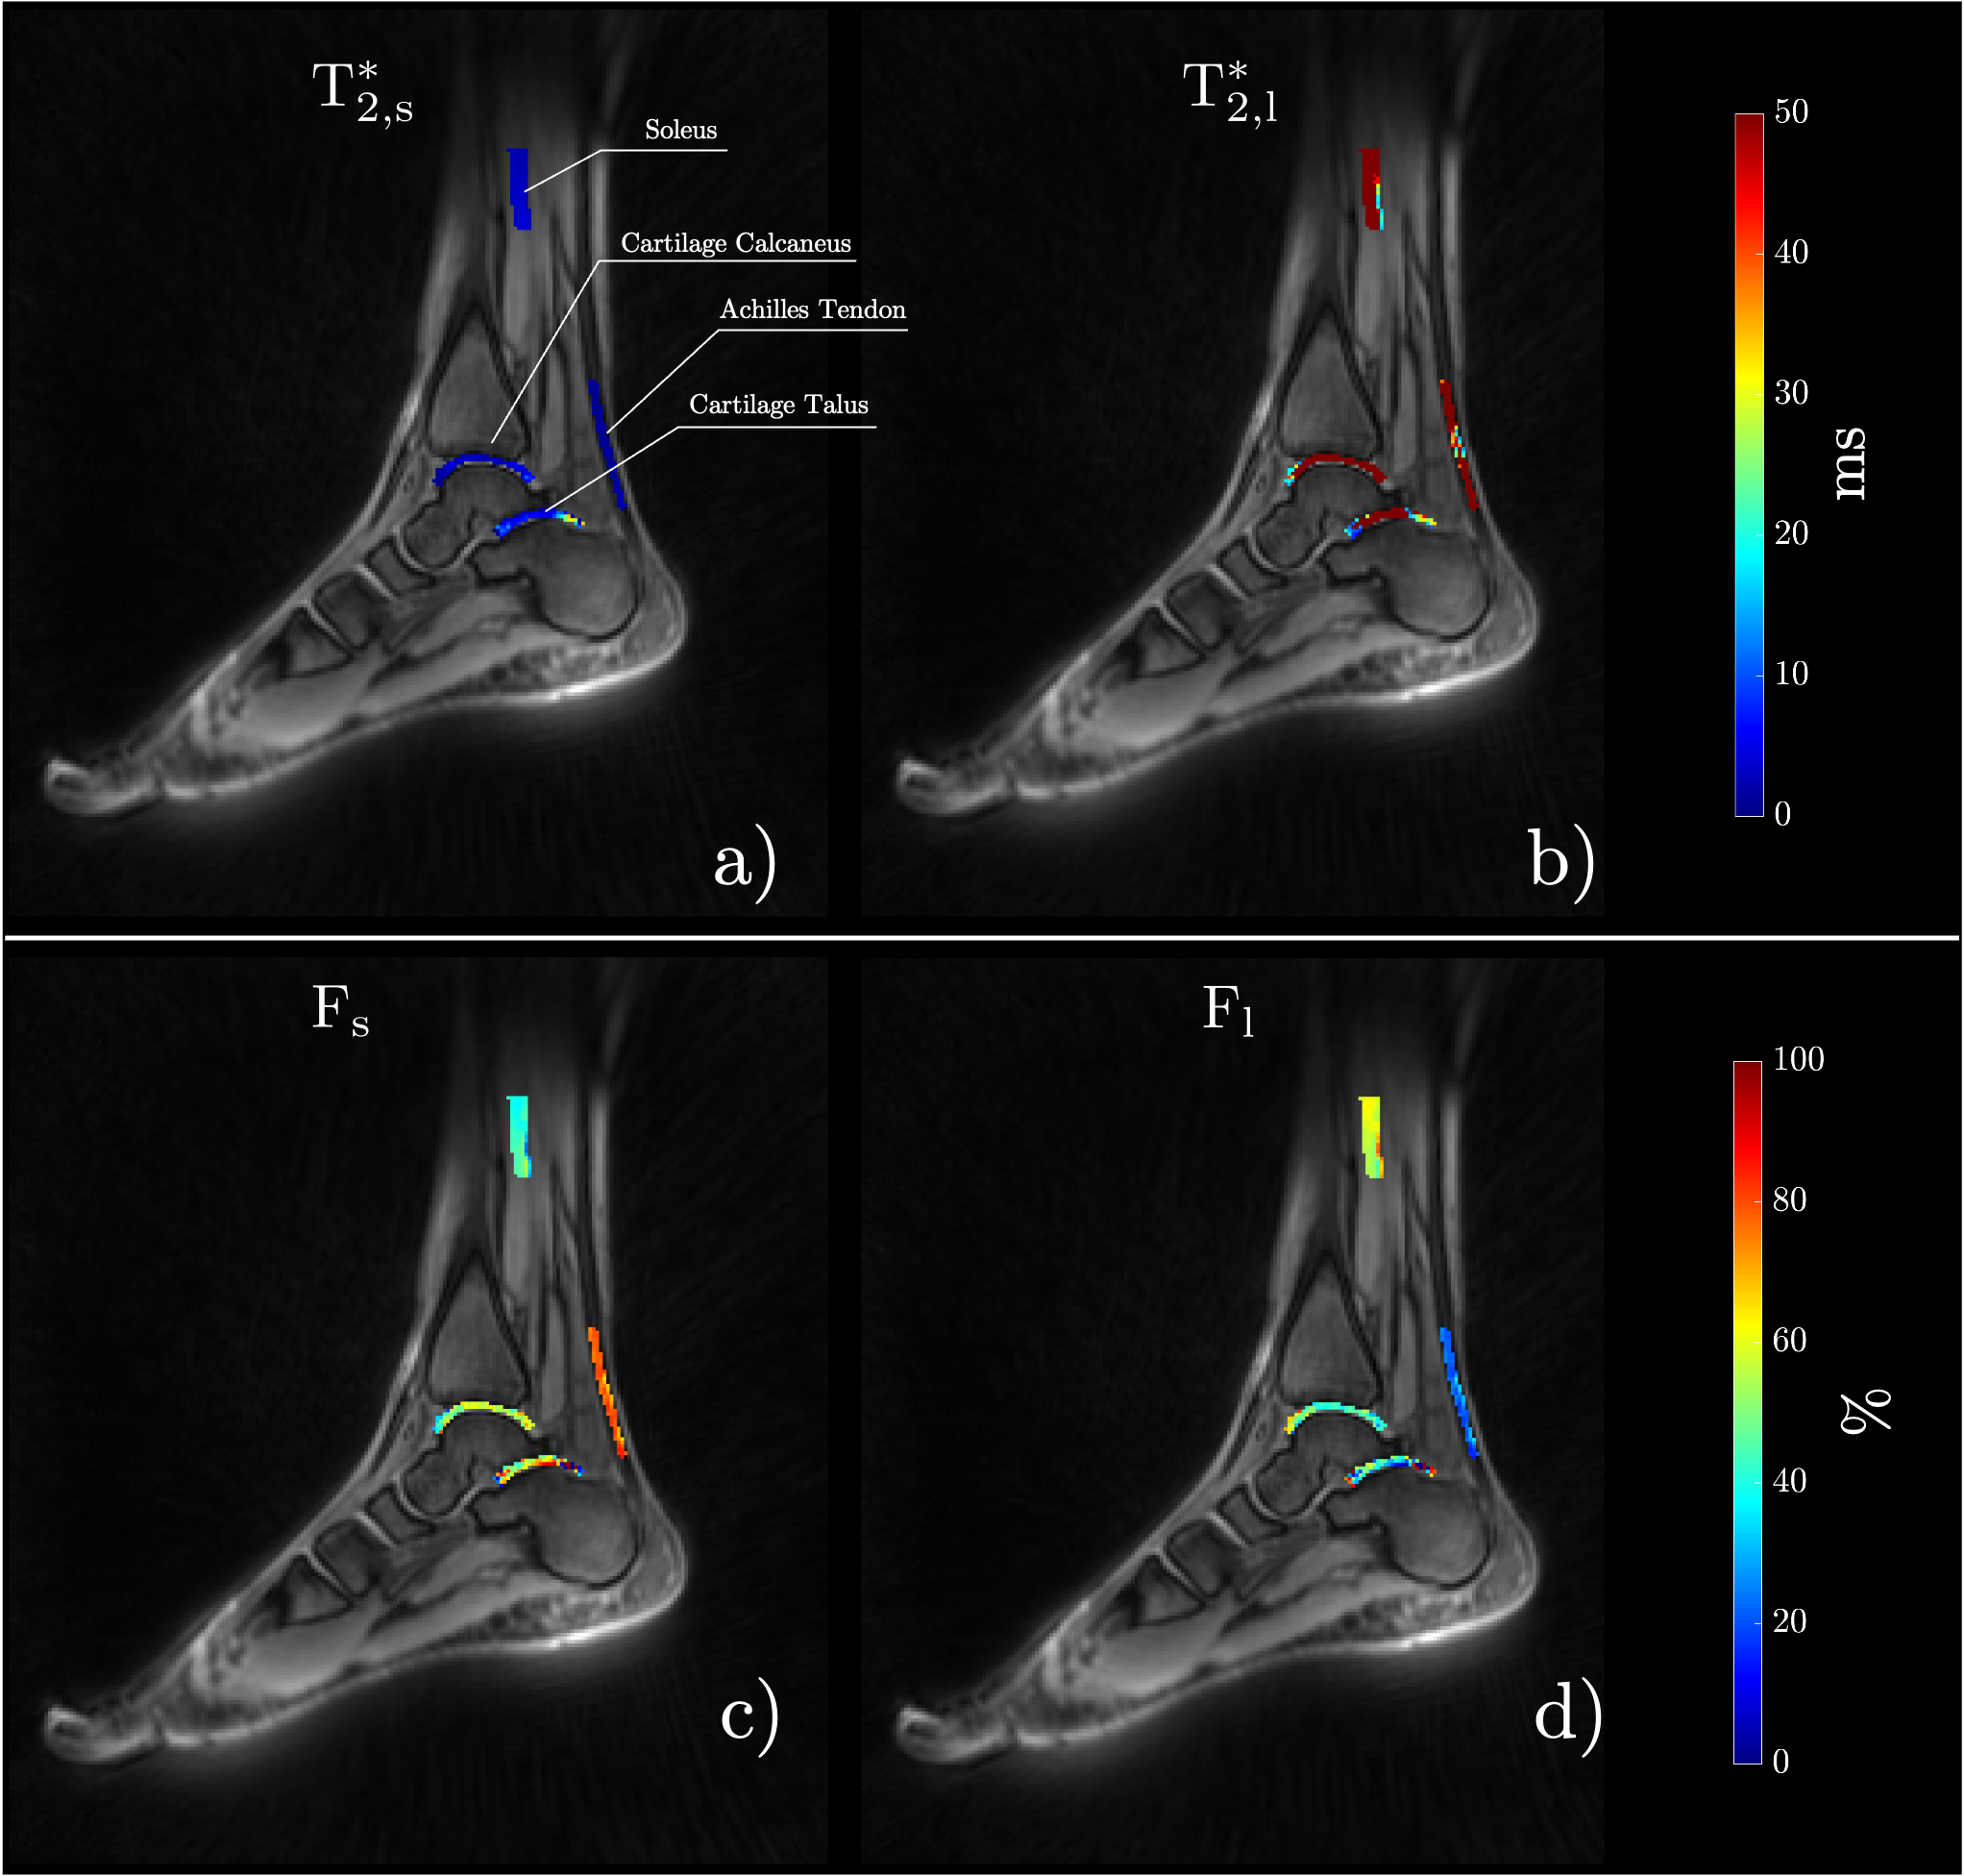
Figure 1: Colormaps of the short $$$T_{2,s}^*$$$ (a) and long $$$T_{2,l}^*$$$ (b) relaxation times and their corresponding fractions $$$F_{s}$$$ (c) and $$$F_{l}$$$ (d) in four regions of interest: soleus, cartilage calcaneus, Achilles tendon and cartilage talus.
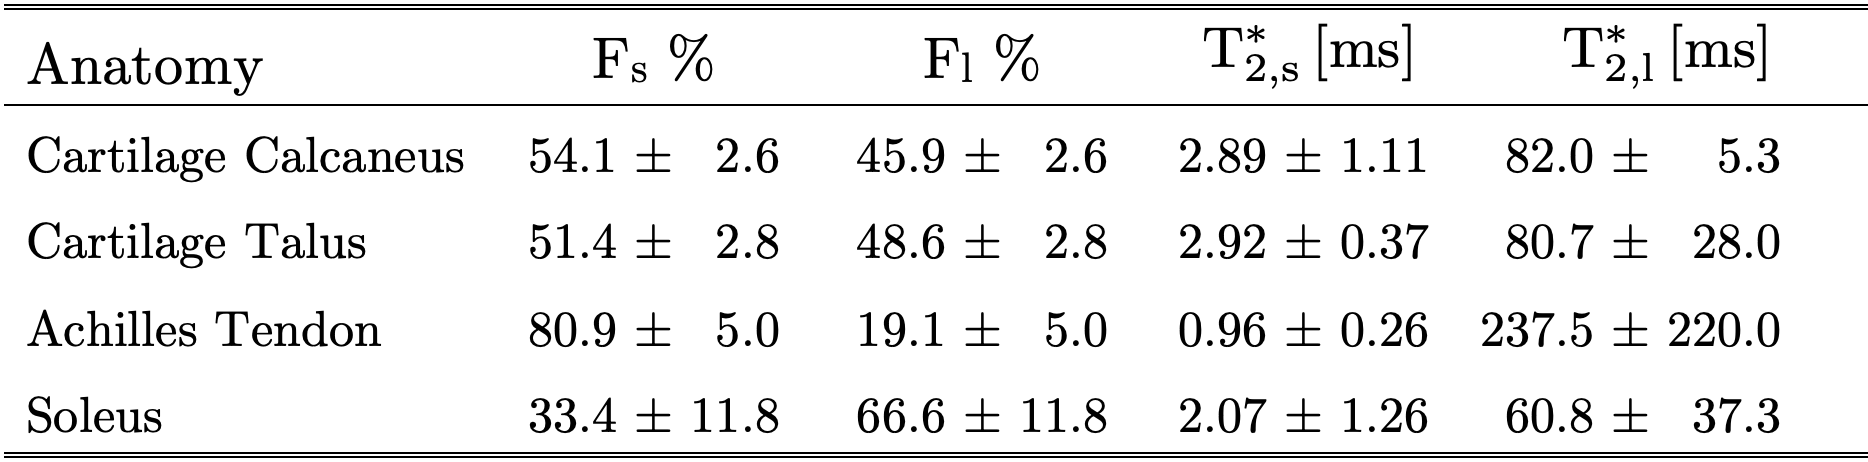
Table 1: Averaged values from bi-exponential $$$T_{2}^{*}$$$ fits.
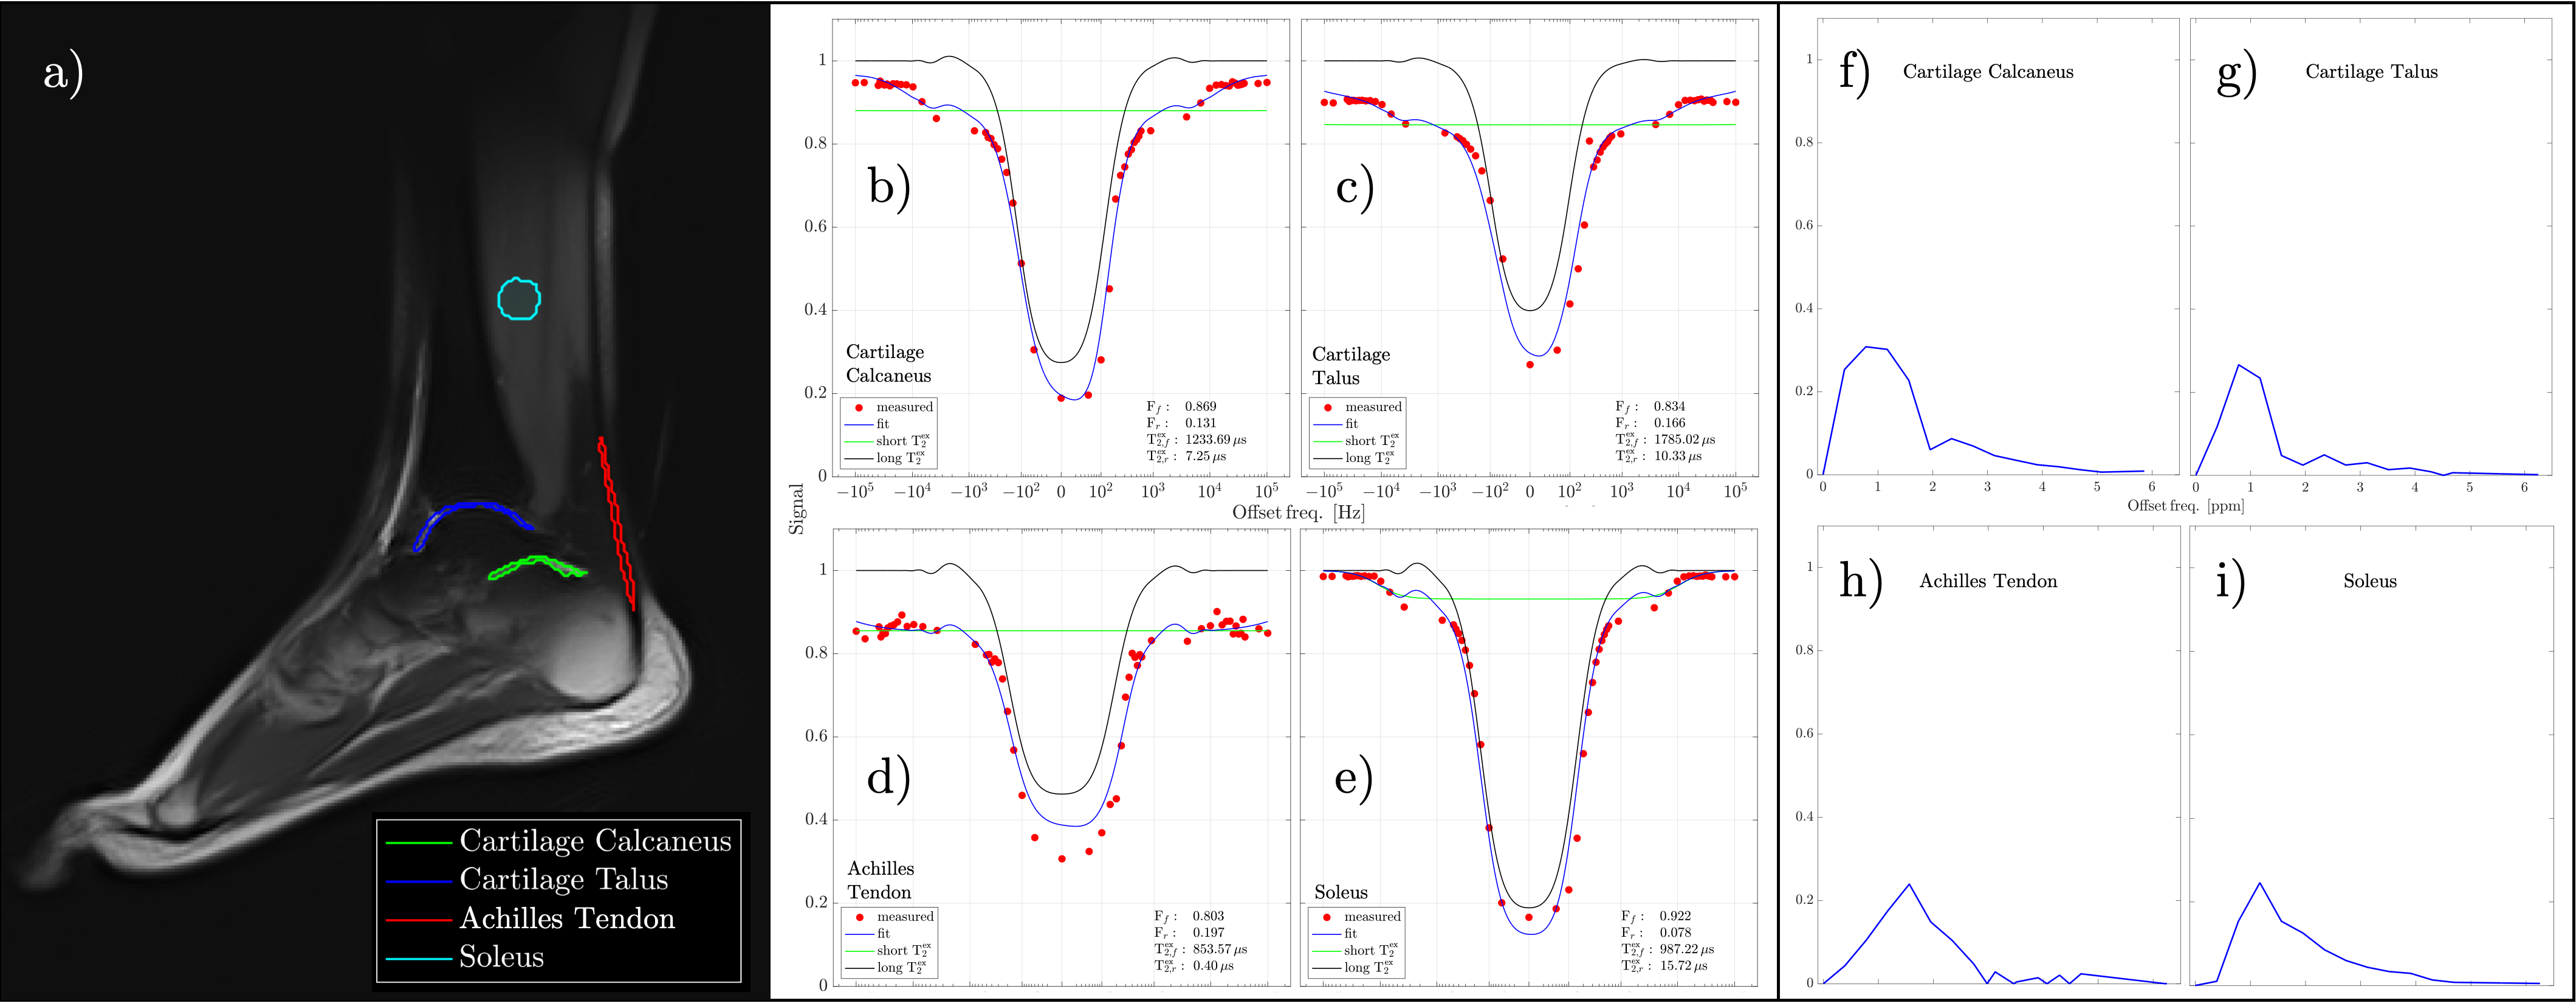
Figure 2: Regions of interest identified on the 2D FSE image (a). Z-spectrum fits for the regions of interest shown in (a); (b) cartilage calcaneus, (c) cartilage talus, (d) Achilles tendon, (e) soleus. Corresponding MTRAsym plots are given in (f-i).
Figure 3: Colormaps derived from the ZAP analysis. Free (a) and restricted (b) exchange protons fractions colormaps and their corresponding apparent relaxation time $$$T^{ex}_{2,f,r} $$$ in (c and d).
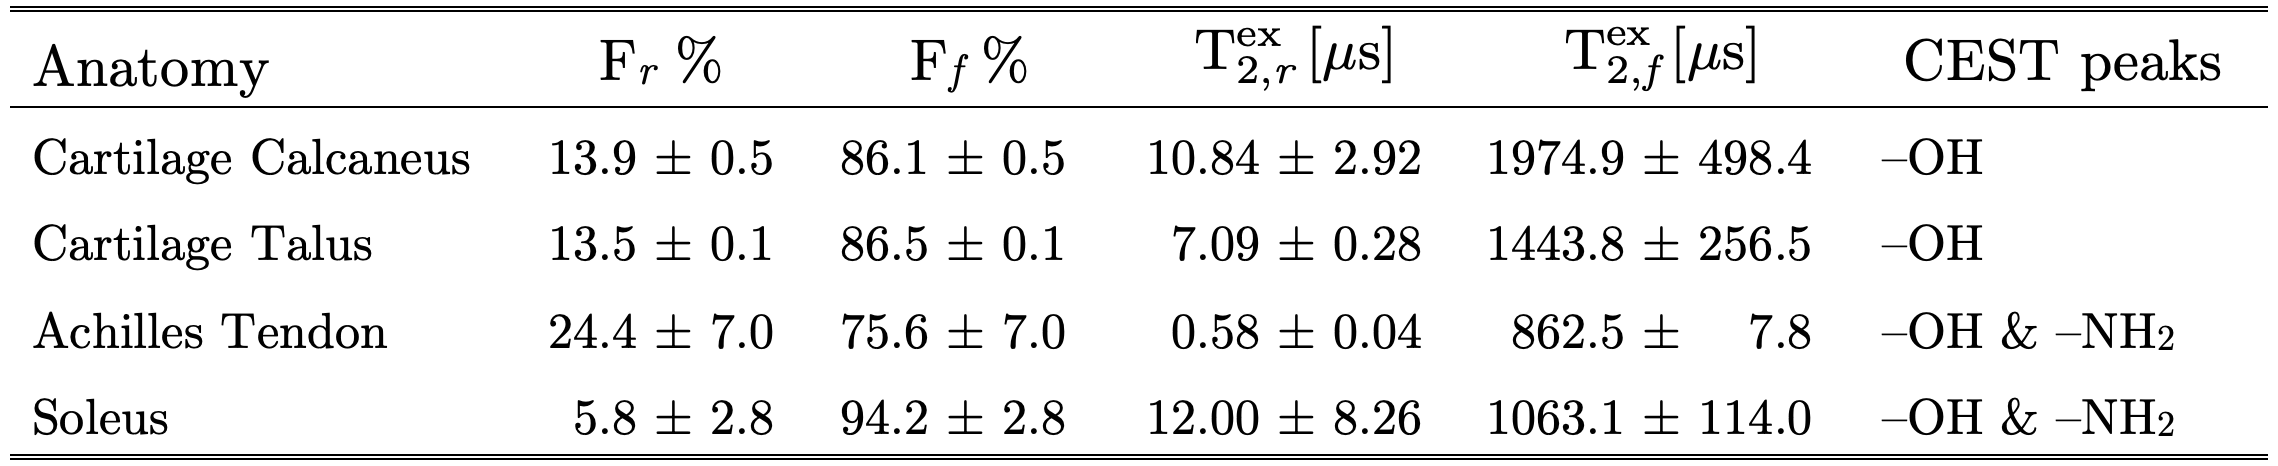
Table 2: ZAP and CEST results.
DOI: https://doi.org/10.58530/2023/2592