2590
A novel registration strategy to transform skeletal muscle architecture during passive shortening1Institute of Imaging Sciences, Vanderbilt University, Nashville, TN, United States, 2Carle Health, Stephens Family Clinical Research Institute, Urbana, IL, United States, 3Radiology and Nuclear Medicine, University of Amsterdam, Amsterdam Movement Sciences, Amsterdam UMC, Amsterdam, Netherlands, 4Biomedical Engineering, Vanderbilt University, Nashville, TN, United States
Synopsis
Keywords: Muscle, Diffusion Tensor Imaging, Muscle architecture
In this study we explored if displacement fields, derived from registration of high-resolution anatomical images in different foot positions, could be used to transform muscle fiber architecture from plantar-flexed to dorsi-flexed foot position (passive shortening). Our data revealed that muscle fiber architecture from one foot position can be transformed in the other foot position and that the original and transformed fibers demonstrate similar architectural characteristics, i.e. fiber lengths, pennation angle, curvature, and physiological cross-sectional area.Introduction
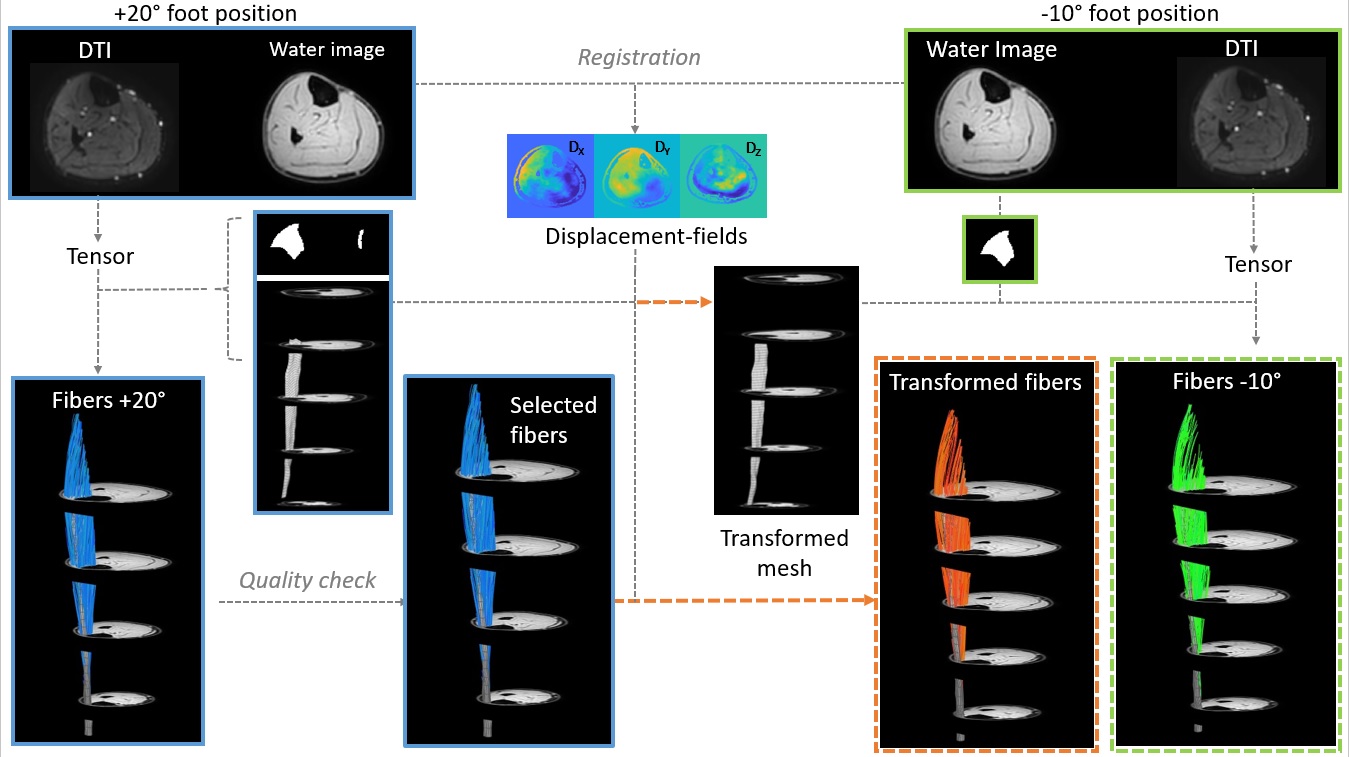
Skeletal muscle architecture is a key determinant of muscle function and can be non-invasively characterized using Diffusion Tensor Imaging (DTI) (1-2). DTI, in combination with other quantitative MRI techniques, can characterize architectural changes in healthy muscle due to training and in diseased muscle (3-8). However, there are open questions about how these architectural changes directly impact muscle function. To answer these questions, DTI data would ideally be acquired during a muscle contraction; but this is not feasible due to long scan times required for whole-muscle DTI (9-10). Therefore, the aim of this study was to explore if displacement fields, derived from registration of high-resolution anatomical images in different foot positions, could be used to transform muscle fiber architecture from an extended to a flexed position. For this purpose, we first optimized the registration parameters of the anatomical images; thereafter used interpolation to transform fibers to a dorsi-flexed foot position; and finally, compared the architectural features of the original fibers and of the transformed fibers.Methods
MR datasets were acquired in the right lower leg of seven healthy subjects (5 men; Age: 25.1±2.7yrs. Range: 23-31yrs.) on a 3T MR system (Elition, Philips, Best, The Netherlands) using a 16-channel surface coil and 8-channel table top coils. Image acquisition included a 3D high resolution Dixon scans (3D; 6 echoes; TR/TE/ΔTE 6.7/1.01/0.96ms; FOV 192x192x308; slice thickness 3.5mm) and a DTI sequence (SE-EPI; 24 directions; b=450mm2/s; TR/TE 5300/53ms; NSA 4; voxel size 2x2x7; fat suppression using SPAIR, slice selective gradient reversal and olefinic signal saturation (11)). Subjects were positioned supine with a fully extended knee and their right foot fixed in +20° plantarflexion position for one scan and -10° dorsiflexion position for the second scan.Data-analysis
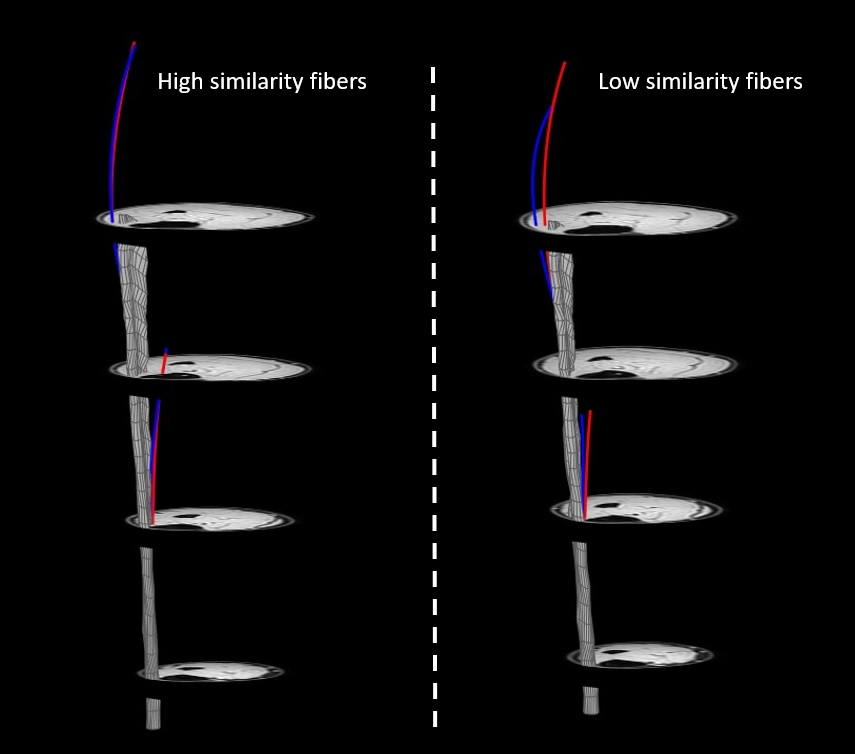
All data-analysis was performed in Matlab using the MuscleDTI_Toolbox (12) and additional custom-written scripts. Diffusion data were registered and denoised using an anisotropic smoothing method (13), after which the tensor was calculated. Masks of the Tibialis Anterior (TA) boundaries and aponeurosis were manually drawn in ITK-snap (14) on the high resolution Dixon water image for the two foot positions. The aponeurosis masks were converted to a seedpoint mesh (size: 30x20). Fiber tracking was initiated from the aponeurosis mesh and propagated using fourth-order Runge-Kutta integration. For the original fibers, in the -10° foot position, the transformed mesh (+20° plantarflexion position) was used to start fiber tracking to ensure direct comparison between datasets. The two high resolution anatomical scans were 3D registered using MATLAB’s imregdemons function with 2000 iterations, 4 pyramid levels, AccumulatedFieldSmoothing of 1.0. A variety of registration inputs have been explored including, various contrasts (2), slice thickness (3) and masking options (2). The quality of the registration options was assessed by calculating the Dice Similarity Coefficient (DSC), Hausdorff distance (Hd) and Euclidean distance (Ed) for the aponeurosis mesh, muscle mask and aponeurosis mask. The registration strategy with the best result was determined with ordinal grading and used to transform (by interpolation) the mesh and fibers from +20° plantarflexion to the -10° degree position. Paired t-tests were used to evaluate the difference in architectural parameters (pennation angle, fiber lengths, fiber curvature and Physiological Cross-sectional Area (PCSA)) between the original and transformed fibers in the deep compartment, superficial compartment, and full TA muscle.Results
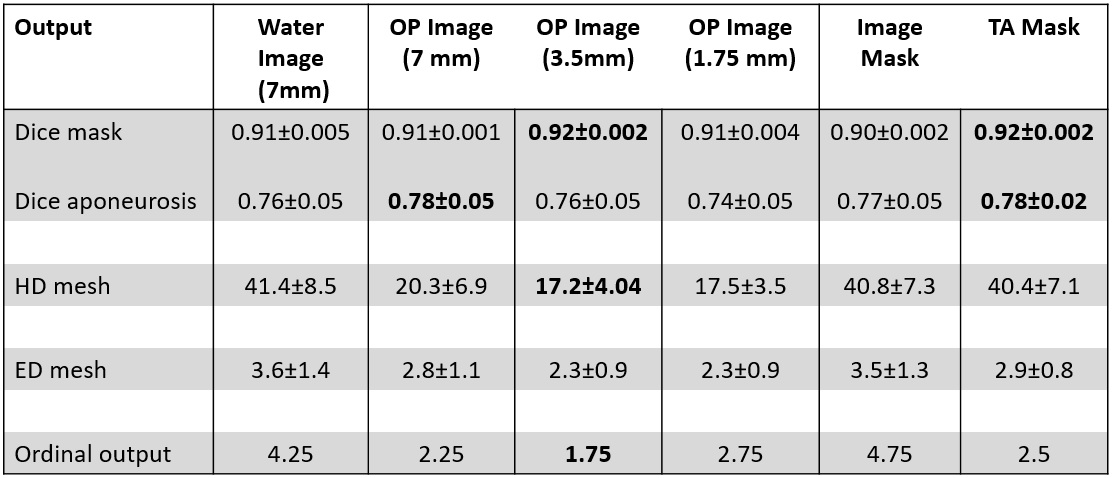
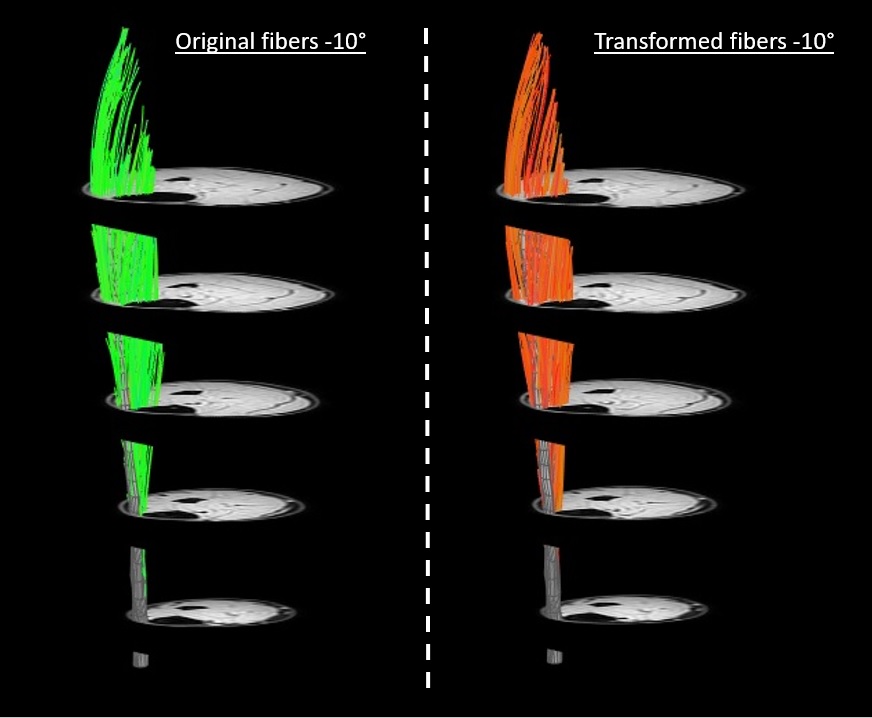
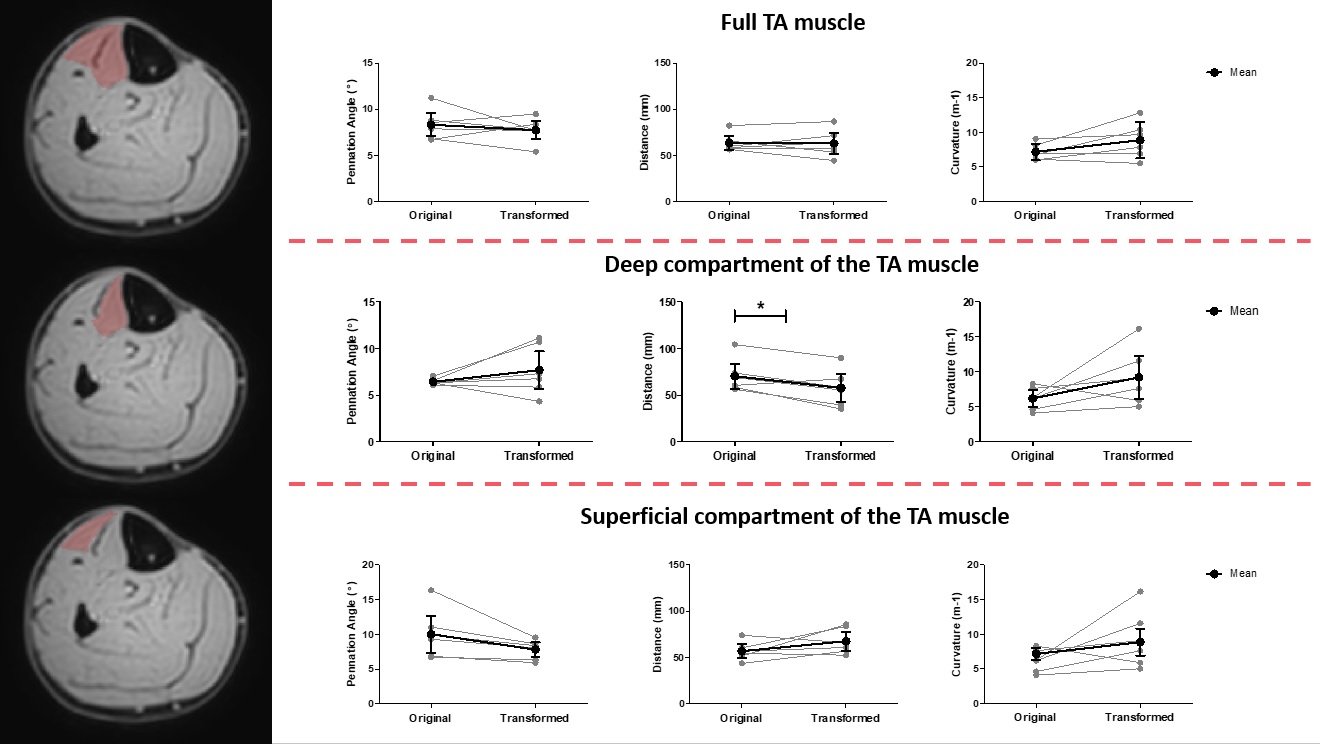
The DSC, Hd and Ed for the muscle mask, aponeurosis mask and aponeurosis mesh using the different registration approaches are shown in Figure 2. Overall, the out-of-phase (TE=NN ms) images with a slice thickness of 3.5mm resulted in the lowest ordinal scale and were selected to transform the fibers. A representative dataset is shown in Figure 3. No differences were detected between the original and transformed fibers for pennation angle and curvature in the deep compartment, superficial compartment and full TA muscle (Figure 4-5). Fascicle lengths of the transformed fibers were significantly shorter (p=0.03) in comparison to the original fibers for the deep compartment of the TA muscle but not for the superficial compartment or full TA muscle (Figure 4). No differences were detected in PCSA between the original and transformed fibers in the full TA muscle.Discussion and conclusion
We showed that 1) muscle fiber tracts from a plantarflexed position can be transformed to the dorsiflexed position using registration of high resolution anatomical images and 2) the original and transformed fibers demonstrate similar architectural characteristics, i.e. fiber tract lengths, pennation angle, curvature, and PCSA. These architectural characteristics are also in the same range as values previously reported in the TA muscle (15-16). Besides non-invasively reflecting anatomy, fiber architecture assessed with DTI is also used to predict function. Specifically, PCSA (17) is considered a key predictor. Not finding changes in PCSA between the transformed and original fibers is therefore very relevant with respect to predictive modelling. How well fibers can be transformed depends highly on the quality of the registration. Consequently, innovations in registration strategies or approaches could improve the outcomes further. In conclusion, this approach to transform muscle architecture is very promising, and our next step will be to evaluate if muscle architecture can be reconstructed in a contracted state using a similar approach.Acknowledgements
This work is supported by a grant from the National Institutes of Health, National Institute of Arthritis and Musculoskeletal and Skin Diseases, R01 AR073831References
[1] Lieber RL. Skeletal muscle adaptability. I: Review of basic properties.Dev Med Child Neurol.1986;28:390-397.
[2] Heemskerk AM, Damon BM. Diffusion Tensor MRI Assessment of Skeletal Muscle Architecture. Curr Med Imaging Rev. 2007; 3(3):152-160.
[3] Froeling M, Oudeman J, Strijkers GJ. et al. Muscle changes detected with diffusion-tensor imaging after long-distance running. Radiology. 2015 Feb;274(2):548-62 doi: 10.1148/radiol.14140702
[4] Hooijmans MT, Niks EH, Burakiewicz J et al. Elevated phosphodiester and T2 levels can be measured in the absence of fat infiltration in Duchenne Muscular Dystrophy. NMR Biomed. 2017 Jan; 30(1). Doi: 10.1002/nbm.3667
[5] Zaraiskaya T, Kumbhare D, Noseworthy MD. Diffusion tensor imaging in evaluation of human skeletal muscle injury. J magn Reson Imaging. 2006 Aug;24(2):402-8 doi:10.1002/jmri.20651
[6] Bolsterlee B, Finni T, D’Souza A et al. Three-dimensional architecture of the whole human soleus muscle in-vivo. PeerJ. 2018 apr 18;6:e4610. doi: 10.7717/peerj.4610.
[7] Otto LAM, van der Pol, Schlaffke L et al. Quantitative MRI of skeletal muscle in a cross-sectional cohort of patients with spinal muscular atrophy types 2 and 3. NMR in Biomed 2020 Oct:33(10):e4357. Doi 10.1002/nbm.4357
[8] Guttsches AK, Rehmann R, Schreiner A et al. Quantitative Muscle MRI correlates with histopathology in Skeletal muscle. J Neuromuscul Dis. 2021;8(4):669-678. Doi:10.3233/JND-210641 [9] Damon BM, Froeling M, Buck AKW, et al. Skeletal muscle diffusion tensor-MRI fiber tracking: rationale, data acquisition and analysis methods, applications and future directions: Skeletal Muscle Dt-Mri Fiber Tracking. NMR Biomed. 2017;30(3):e3563. doi:10.1002/nbm.3563
[10] Mazzoli V, Moulin K Kogan F et al. Diffusion tensor Imaging of skeletal muscle contraction using oscillating gradient spin echo. Front Neurol. 2021 Feb 15;12:608549. Doi: 10.3389/fneur.2021.608549
[11] Williams SE, Heemskerk AM, Welch EB et al. Quantitative effects of inclusion of fat on muscle diffusion tensor MRI measurements. J Magn Reson Imaging. 2013 Nov;38(5);1292-7 doi: 10.1002/jmri.24045
[12] Damon BM, Ding Z, Hooijmans MT et al. A matlab toolbox for muscle diffusion tensor MRI tractography. J Biomech. 2021 Jul 19;124:110540. Doi: 10.1016/j.jbiomech.2021.110540 [13] Thirion JP. Image matching as a diffusion process: an analogy with Maxwell’s Demons. Medical Image Analysis. 1998, Sep;2(3):243-60.
[13] Buck AK, Ding Z, Elder CP, et al. Anisotropic Smoothing Improves DT-MRI-Based Muscle Fiber Tractography. Plos One. 2015. May 26;10(5).
[14] Yucesoy CA, Koopman BH, Baan GC, Grootenboer HJ, Huijing PA. Extramuscular myofascial force transmission: experiments and finite element modelling. Arch Physiol Biochen. 2003
[15] Bolsterlee B, D’Souza A, Herbert RD. Reliability and robustness of muscle architecture measurements obtained using diffusion tensor imaging with anatomically constrained tractography. J Biomech. 2019 Mar 27;86:71-78. Doi: 10.1016/j.jbiomech.2019.01.043
[16] Charles JP, Suntaxi F, Anderst WJ. In vivo human lower limb muscle architecture dataset obtained using diffusion tensor imaging. PloS One. 2019;14(10):e0223531. doi:10.1371/journal.pone.0223531
[17] Powell PL, Roy RR, Kanim P et al. Predictability of skeletal muscle tension from architectural determinations in guinea pig hindlimbs. J appl Physiol. 1984; 57:1715-1721
Figures