2589
High temporal resolution dynamic 23Na-MRI in skeletal muscle following exercise1Newcastle Magnetic Resonance Centre, Newcastle University, Newcastle upon Tyne, United Kingdom, 2Translational and Clinical Research Institute, Newcastle University, Newcastle upon Tyne, United Kingdom
Synopsis
Keywords: Muscle, Non-Proton, 23Na, Sodium
Atypical Na+ regulation following exercise can be indicative of skeletal muscle dysfunction. Dynamic 23Na-MRI of signal recovery following exercise therefore holds potential to provide a sensitive, quantitative, and non-invasive tool for physiological monitoring of disease progression or response to interventions. 23Na-MRI sequences with temporal resolutions ranging from 2-8 minutes were acquired in the lower leg before and repeatedly after strenuous isometric dorsiflexion. Our data characterised sodium dynamics during recovery from exercise, and demonstrated an initial increase in 23Na signal intensity from baseline levels after exercise ceased. These findings may provide additional metrics for monitoring skeletal muscle dysfunction.
Introduction
Sodium regulation is fundamental to healthy muscle function: Na+ is essential for cellular homeostasis, maintaining a concentration gradient between the intercellular (10-30mM/L) and extracellular (145mM/L) spaces via Na+/K+-ATPase, and for generating action potentials which initiate muscle contraction.1 Atypical intra- and extracellular sodium concentrations and transmembrane flux following exercise can therefore be indicative of disorders which provoke aberrant cellular function, reduce membrane integrity, or modify tissue microvasculature.123Na-MRI of exercise-induced Na+ signal fluctuation has been proposed as a non-invasive indicator of skeletal muscle dysfunction; elevated skeletal muscle 23Na signal intensity (SI) immediately following exercise has been observed in healthy subjects2-5 and patients with myopathies, type II diabetes, and osteoarthritis.3,6 Serial monitoring of 23Na SI return to baseline following exercise generated contrasting measures of monoexponential half-lives in healthy participants, ranging from 12-30 minutes2-3, with a prolonged 23Na SI half-life noted in a small patient cohort.3 Though the precision of these measurements were bound by coarse temporal resolutions, they effectively demonstrate the potential utility of the 23Na SI time course as a novel indicator for monitoring disease progression and response to therapies.
The purpose of this preliminary work was to assess relative 23Na SI changes in the tibialis anterior (TA) of healthy participants serially after exercise, to better characterise the time course of SI recovery.
Methods
9 healthy participants (5M, 4F; aged 19-31) provided written informed consent. MR imaging was performed on a Philips Achieva 3.0 T system (Philips Healthcare, UK), in conjunction with a 23Na quadrature birdcage knee coil (Rapid Biomedical, GmbH, Germany). The broadest part of the lower non-dominant leg was positioned centrally within the coil, with the foot strapped to a static footplate (built in-house) in a neutral position, Figure 1.An anatomical 1H T1-weighted axial multi-slice gradient echo sequence was acquired on the scanner’s body coil for muscle delineation. One of three 23Na acquisitions was performed pre- and post-exercise: Five participants underwent a 2D 23Na spoiled gradient echo (SPGR) acquisition, acquisition time (tA)=8mins 19s. An equivalent sequence with reduced signal averaging (tA=1min 59s) was performed on one further participant. Finally, a 3D 23Na stack-of-stars radial acquisition, permitting a reduced echo time (TE=0.28ms), was acquired in three participants (tA=3mins 51s). Sequence parameters are detailed in Table 1. 23Na acquisitions were performed once immediately prior to exercise, and consecutively for 40-50 minutes following exercise for dynamic assessment of 23Na signal evolution from baseline.
The exercise protocol comprised six 30-second isometric ankle dorsiflexion manoeuvres against the footplate straps at maximum effort, with a 5-second rest period between each repetition.
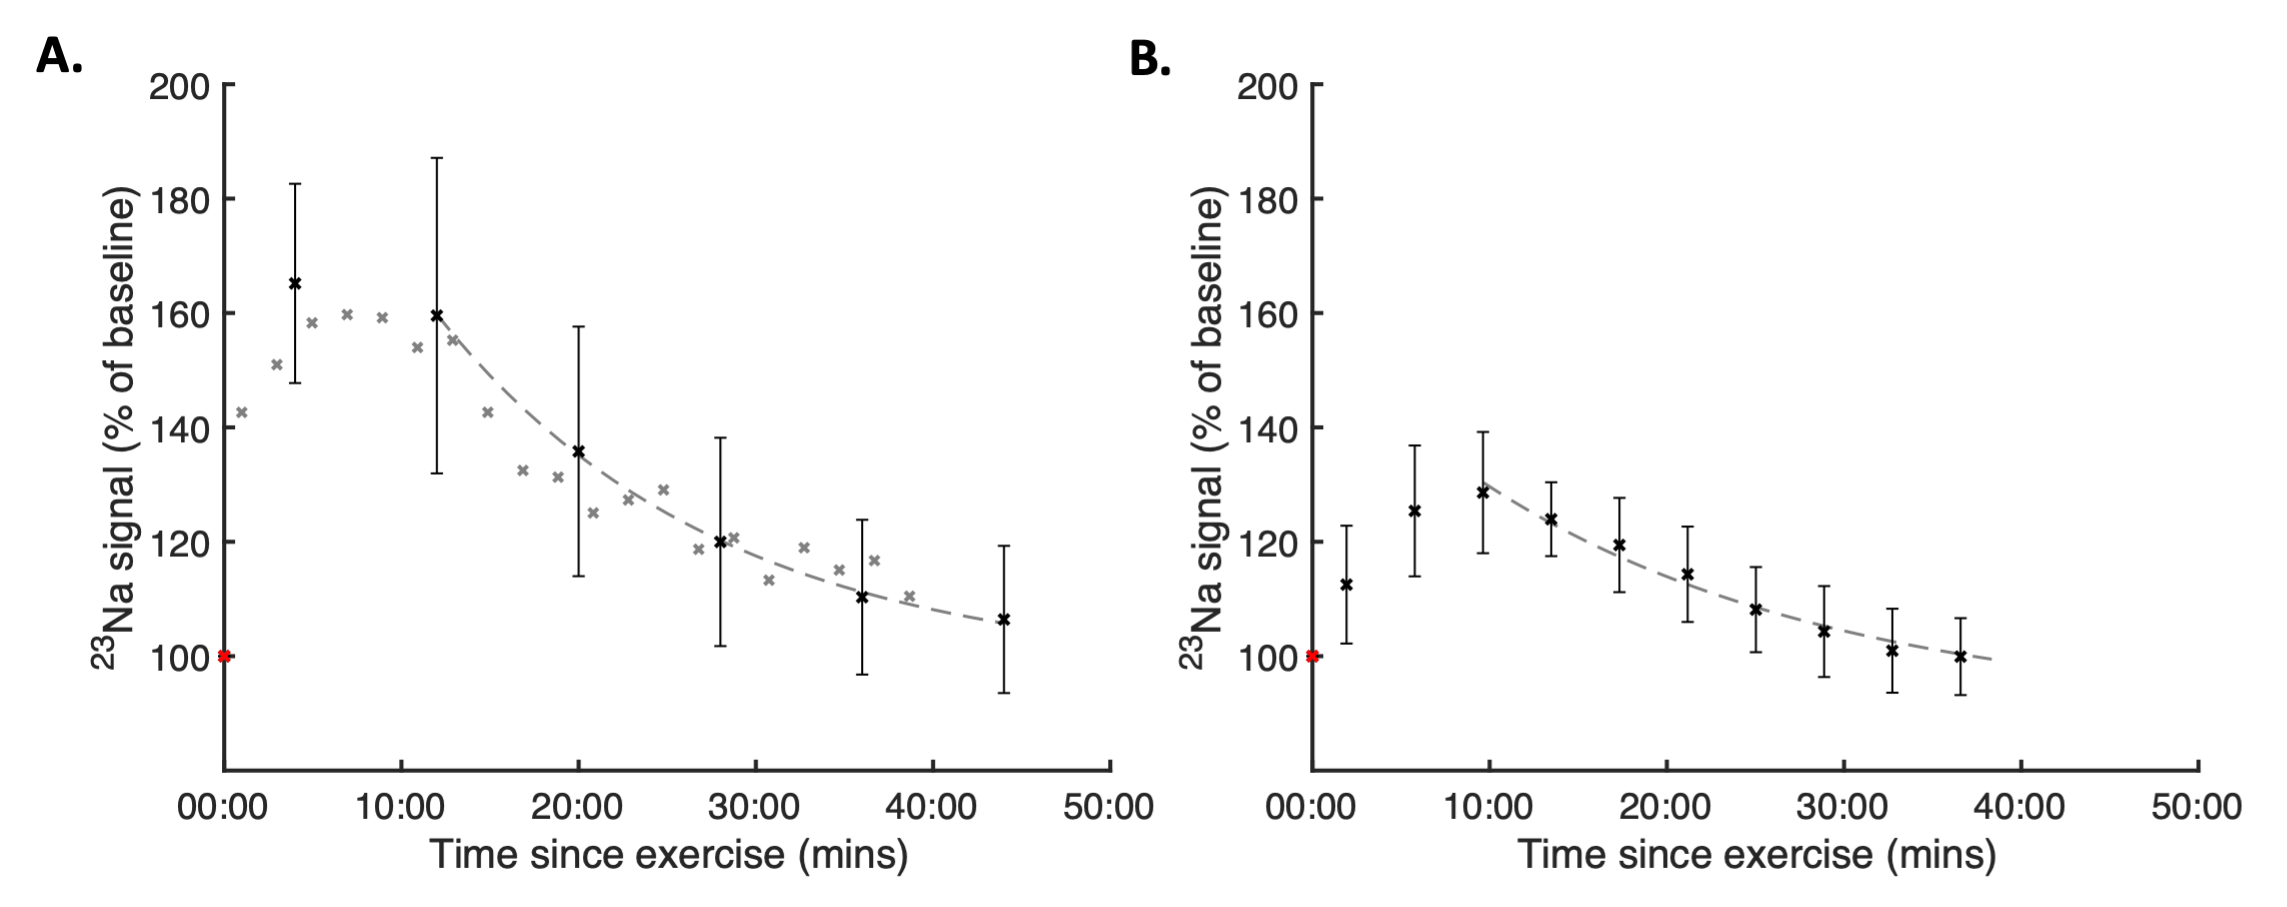
Pre- and post-exercise 23Na signal intensity was measured using a 20x20mm2 region of interest drawn centrally in the TA, then normalised to the baseline (pre-exercise) value. Percentage change in SI was calculated: $$$ Percent\:change = \frac{peak\:SI - baseline\:SI}{baseline\:SI}\times 100$$$. Monoexponential decay curves were fitted to the normalised sequential signal intensity, beginning at the time-point associated with peak SI, from which 23Na half-life was calculated.
Results
Representative 23Na-MRI images are depicted in Figure 2, demonstrating a visible change in SI in the TA over the acquisition time course. The percent change in SI from baseline was measured as 67% (SD=18%, n=6) and 29% (SD=8%, n=3) for the SPGR and radial acquisitions, respectively. 23Na SI recovery post-exercise was qualitatively observed to deviate notably from the previously assumed monoexponential decay curve immediately post-exercise in all datasets, Figure 3. Mean recovery half-lives of (min:sec) 11:06 (SD=2:23) and 12:56 (SD=4:07) were measured in the SPGR and radial datasets, respectively, subsequent to a 10-14 minute delay offset from the culmination of exercise.Discussion
This study aimed to characterise skeletal muscle 23Na SI recovery following exercise in healthy participants. Measures in previous studies were constrained by coarse temporal resolution (7-15 minutes) and a protracted time between the culmination of exercise and the commencement of 23Na-MRI acquisitions, resulting in insensitivity to short-timescale changes in 23Na SI.2,3 The three relatively fast (2-8 minute) 23Na-MRI acquisition sequences used were guided by sequences utilised in the literature for assessment of total sodium concentration.4,7,8 Near-immediate post-exercise imaging was achieved by implementation of an exercise protocol which could be performed in situ. These developments enabled detection of a distinct SI growth phase prior to the exponential decay which differs from literature reports that assumed the 23Na increase occurred during exercise.2-4 This short-timescale multi-component SI time course may proffer additional metrics for disease monitoring and more accurate determination of recovery half-life. The substantial differences in percent SI change between the radial and cartesian sequences reflect the relative sensitivity of each sequence to the two components of the biexponential 23Na T2*, which exist in different ratios in the intra- and extracellular compartments. High temporal resolution measurements using advanced pulse sequences weighted to intracellular 23Na signal1 will supplement these findings and further enhance our comprehension of how MRI signal change represents physiological processes.Conclusion
We have performed the first study to characterise exercise-induced 23Na-MRI SI changes with fast SPGR and radial 23Na acquisition sequences. The SI recovery timecourse may be sensitive to pathophysiological processes, providing a non-invasive metric for physiological monitoring of disease progression or response to interventions. Studies to assess the 23Na SI time course following exercise in patients with dysferlinopathy are underway.Acknowledgements
The authors thank the NMRC Radiographers for their assistance with this study.References
1) Madelin G, Regatte RR. Biomedical applications of sodium MRI in vivo. J Magn Reson Imaging. 2013;38(3):511-529.
2) Bansal N, Szczepaniak L, Ternullo D, et al. Effect of exercise on 23Na MRI and relaxation characteristics of the human calf muscle. J Magn Reson Imaging. 2000;11(5):532-538.
3) Chang, G, Wang, L, Schweitzer, ME et al. 3D 23Na MRI of human skeletal muscle at 7 Tesla: initial experience. Eur Radiol. 2010;20:2039–2046.
4) Hammon M, Grossmann S, Linz P, et al. 3 Tesla 23Na magnetic resonance imaging during aerobic and anaerobic exercise. Acad Radiol. 2015;22(9):1181-1190. https://doi.org/10.1016/j.acra.2015.06.005
5) Yanagisawa O, Niitsu M, Yoshioka H, et al. The use of magnetic resonance imaging to evaluate the effects of cooling on skeletal muscle after strenuous exercise. Eur J Appl Physiol. 2003;89(1):53–62.
6) Constantinides CD, Gillen JS, Boada FE, et al. Human Skeletal Muscle: Sodium MR Imaging and Quantification—Potential Applications in Exercise and Disease. Radiology. 2000;216(2):559-568.
7) Utzschneider M, Müller M, Gast LV, et al. Towards accelerated quantitative sodium MRI at 7 T in the skeletal muscle: Comparison of anisotropic acquisition- and compressed sensing techniques. Mag Res Imag. 2021;75:72-88.
8) Konstandin S, Nagel AM, Heiler PM, et al. Two-dimensional radial acquisition technique with density adaption in sodium MRI. Magn. Reson. Med., 2011;65:1090-1096.
Figures
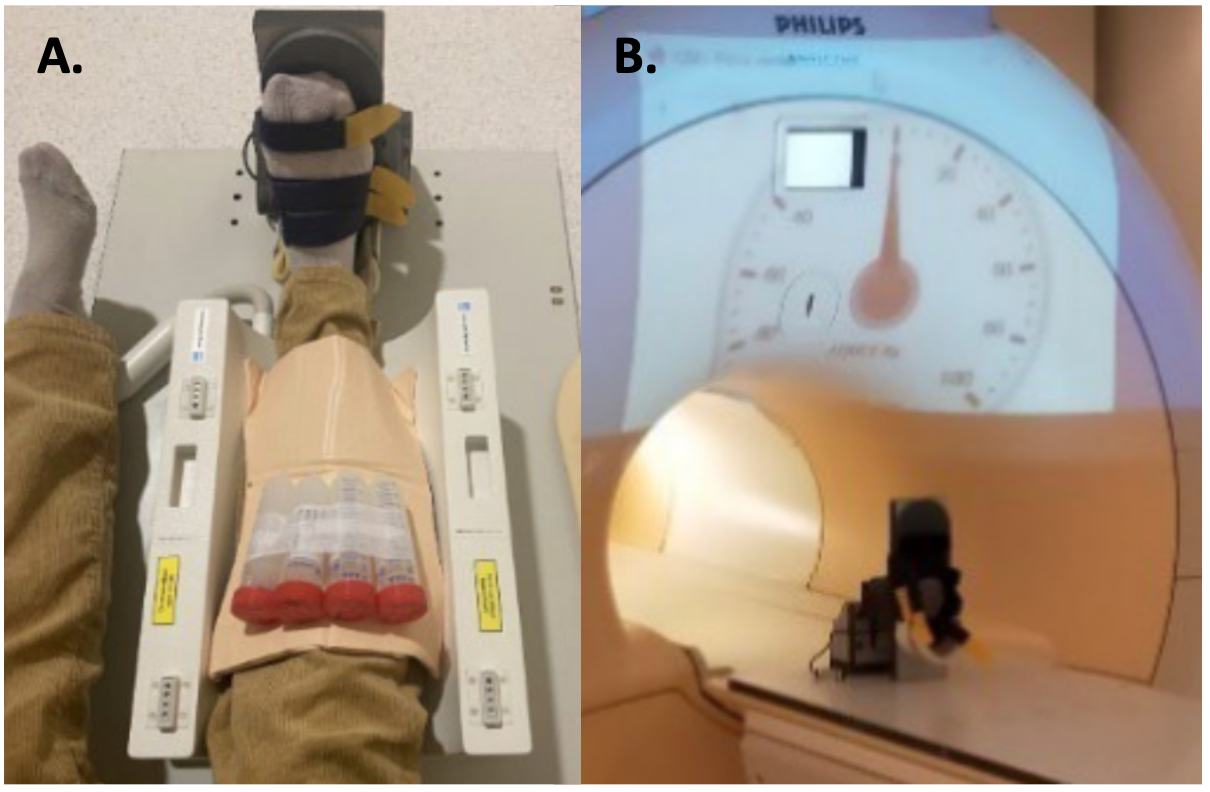
Figure 1A: Leg positioning in the static foot plate and the lower section of the 23Na birdcage coil. Foam padding was used to immobilise the leg within the coil and under the knee to generate a slight knee flexion to minimise upper limb muscle recruitment during exercise. Nb. Agar calibration phantoms placed superior to the leg were not utilised in this analysis due to the use of relative SI values throughout. 1B: Live measurements from a force meter, accommodated within the foot plate, were projected into the scanner room during the exercise as a visual aid.
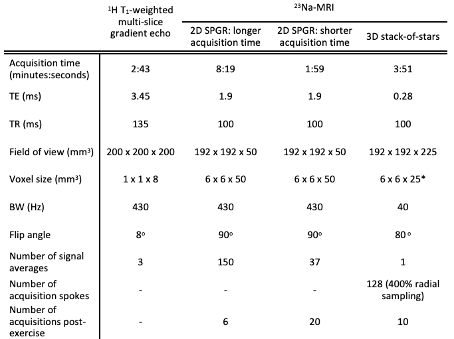
Table 1: Acquisition sequence parameters. 23Na acquisitions were performed once prior to exercise, and consecutively for 40-50 minutes following exercise (totalling 6-20 serial acquisitions, sequence dependent) for dynamic assessment of 23Na signal evolution from baseline.
*The central two slices of the stack-of-stars datasets were summed to provide an equivalent (50mm) slice thickness to the SPGR images for subsequent image analysis.
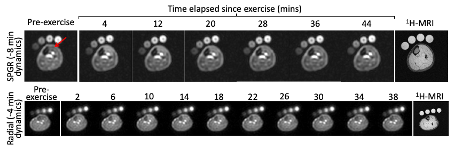
Figure 2: Representative image sets depicting axial 50mm slices though the lower leg. TA signal intensity (red arrow), representative of intra- and extracellular-averaged sodium concentration, is observed to peak ~10-14 minutes after the culmination of exercise in the radial image sets. The respective 1H anatomical images, used for muscle delineation, are also presented.