2588
Phase contrast motor unit MRI (PC-MUMRI) to investigate changes to muscle twitch dynamics in a healthy ageing cohort1Translational and Clinical Research Institute, Newcastle University, Newcastle upon Tyne, United Kingdom, 2NIHR Biomedical Research Centre, NIHR Biomedical Research Centre, Newcastle upon Tyne, United Kingdom, 3Northern Medical Physics and Clinical Engineering, Newcastle upon Tyne NHS Foundation Trust, Newcastle upon Tyne, United Kingdom, 4Department of Neuroradiology, Newcastle upon Tyne NHS Foundation Trust, Newcastle upon Tyne, United Kingdom
Synopsis
Keywords: Muscle, Aging
Functional changes to the muscle’s contractile and relaxation properties occur with age. Current techniques which measure twitch dynamics provide limited information about individual muscles. We used phase contrast motor unit MRI (PC-MUMRI) to non-invasively measure the contraction and relaxation times of lower leg muscles in a healthy ageing cohort, relating this to isometric maximum voluntary contraction (MVC). Contraction and relaxation times increased with ageing and were negatively correlated with MVC. PC-MUMRI offers a sensitive method to measure muscle twitch dynamics and could be combined with other MR techniques to characterise functional changes to muscle with ageing.Introduction
Reductions in maximal force production and changes to muscle twitch characteristics with ageing have been well documented, with older subjects producing less force and having longer muscle contraction and relaxation times1. Measurements of muscle group contraction and relaxation times are currently performed using surface or needle electrical stimulation in conjunction with a force transducer. This does not provide information about individual muscle twitch dynamics2.Here, we used PC-MUMRI3 as a non-invasive method to measure whole group and single muscle twitch profiles in a cohort of healthy ageing volunteers. We investigated how contraction and relaxation times change with healthy ageing and how they relate to isometric maximum voluntary contraction (MVC).
Methods
Subjects: We included 47 participants (24 male), mean age: 53 ± 16 years (range 26 – 82 years).MRI Data Acquisition: Participants were scanned with their left foot strapped into an MR compatible force plate, with stimulating electrodes placed over the left common peroneal nerve (figure 1). To capture the temporal shape of the twitch of the whole anterior compartment (inclusive of tibialis anterior (TA), extensor digitorium longus (EDL) and peroneus longus (PL) muscles) a PC sequence with an echo planar readout was used with the following parameters: field of view (FOV)=160 x 160, in-plane resolution=1.5x1.5 mm, slice thickness=8 mm, number of slices=2, TR=500 ms, TE=8.7 ms, flip angle=25°, velocity encoding=15 cm/s, 100 dynamic acquisitions, acquisition time=3 min 21s. During each dynamic scan a single pulsed electrical stimulus which activated the whole anterior compartment was given. Images were acquired with the stimulus onset gated between 450 ms before to 50 ms after the 90° radiofrequency pulse (in steps of 5 ms; figure 2).
MRI Data Analysis: Images were registered to the first image in the time series using a non-rigid registration in Matlab. The anterior compartment and individual muscles within it were delineated on the magnitude image of the PC sequence, using a manual segmentation in ITKSnap. The regions of interest ROIs were applied to the phase image and the average velocity for each image in the time series was extracted for each ROI. Average velocity curves were analysed with manual identification of the start of the increase in the velocity signal (PCstart), the point at which the velocity signal crossed through zero on the x-axis (PCzerocross) and the end of the velocity signal (PCend) (where the signal visually returned to baseline) (see red markers in figure 3). Contraction and relaxation times for each participant were calculated as:
$$PCcontraction = PCzerocross-PCstart$$
$$PCrelaxation = PCend - PCzerocross$$
Maximum Voluntary Contraction: Isometric MVC of the anterior compartment muscles was measured by using the MR compatible force plate, as the maximum of three maximum dorsiflexion attempts.
Statistics: The relationships between age and whole anterior compartment and individual muscle contraction and relaxation times were assessed with a Pearson correlation. Contraction and relaxation times were related to MVC using a Pearson correlation. Participants were split into three age groups representing young (25-45 years; n=18), middle (45-64 years; n=15) and older (65-85 years; n=14). Group differences in contraction and relaxation times were assessed with a one-way ANOVA.
Results
Contraction and relaxation times of the anterior compartment averaged across all participants were 83 ± 9 ms (range: 67-103 ms) and 196 ± 36 ms (132-287 ms) respectively. Contraction and relaxation times correlated with age (pcontraction=0.037 and prelaxation=0.004; figure 4A). Contraction and relaxation times of individual muscles were all positively correlated with age, apart from relaxation time of the EDL muscle (TA: pcontraction = 0.061, prelaxation = 0.004; EDL: pcontraction = 0.186, prelaxation = 0.792, PL: pcontraction = 0.168, prelaxation = 0.0005) (figure 4B). Isometric MVC of the anterior compartment muscles was negatively correlated with whole anterior compartment contraction and relaxation times (pcontraction = 0.020, prelaxation = 0.014) (figure 5A).ANOVA showed a significant difference in contraction and relaxation times between the three age groups (pcontraction = 0.03, prelaxation = 0.02). Contraction and relaxation times were longer in the middle-aged group compared to the younger group (pcontraction=0.03, prelaxation=0.03). Contraction and relaxation times tended to be longer in the oldest group than the youngest (pcontraction=0.10, prelaxation=0.07). No difference between the middle and oldest age groups was observed (pcontraction=0.90, prelaxation=0.95) (figure 5B).
Conclusion
Contraction and relaxation times of the whole muscle compartment and individual muscles correlate with age. Individual muscle data suggest that ageing has a stronger effect on the relaxation times of muscles, and these changes are driven by the TA and PL muscles. This may be due to the reduction in the number of type II fast twitch muscle fibres with age4, and the reduction in the ability of the sarcoplasmic reticulum to efficiently release & uptake of calcium1. Isometric MVC was related to contraction and relaxation time, this could also be related to the shift towards more type II slow twitch fibres with age.PC-MUMRI offers the ability to measure contractile properties of muscle in 2 dimensions. In the future, we aim to extend the technique to study twitch dynamics of single human motor units and combine it with other MR imaging (e.g. motor unit MRI5, 6 and Dixon) to provide a better picture of functional changes to muscle with age.
Acknowledgements
The authors would like to acknowledge the participants who took part in the study and the radiographers: Tim Hodgson, Dorothy Wallace and Louise Ward for scanning the participants.
The NIHR Newcastle Biomedical Research Centre (BRC) is a partnership between Newcastle Hospitals NHS Foundation Trust and Newcastle University, funded by the National Institute for Health Research (NIHR). This abstract presents independent research funded and supported by the NIHR Newcastle BRC. The views expressed are those of the author(s) and not necessarily those of the NIHR or Department of Health and Social Care.
References
1) Pääsuke, M. Ereline, J. Gapeyeva, H. Sirkel, S. Sander, P. Age related differences in twitch contractile properties of plantarflexor muscles in women. Acta Physiologica Scandinavica. 2000; 171(1):51-57.
2) Leitch, M. Macefield, VG. Comparison of contractile responses of single human motor units in the toe extensors during unloaded and loaded isotonic and isometric conditions. Journal of Neurophysiology. 2015; 114(2):1083-1089.
3) Heskamp, L. Birkbeck, MG. Whittaker, RG. Schofield, IS. Blamire, AM. The muscle twitch profile assessed with motor unit magnetic resonance imaging. NMR in Biomedicine. 2021; 34(3):e4466.
4) St-Jean-Pelletier, F. Pion, CH. et al. The impact of ageing, physical activity, and pre-frailty on skeletal muscle phenotype, mitochondrial content, and intramyocellular lipids in men. Journal of Cachexia, Sarcopenia and Muscle 2017; 8(2):213-228
5) Birkbeck, MG. Heskamp, L. Schofield, IS. Blamire, AM. Whittaker, RG. Non-invasive imaging of single human motor units. Clinical Neurophysiology. 2020; 131:1399-1406.
6) Whittaker, RG. Porcari, P. Braz, L. Williams, TL. Schofield, IS. Blamire, AM. Functional magnetic resonance imaging of human motor unit fasciculation in Amyotrophic Lateral Sclerosis. 2019; 9999: 1-5.
Figures
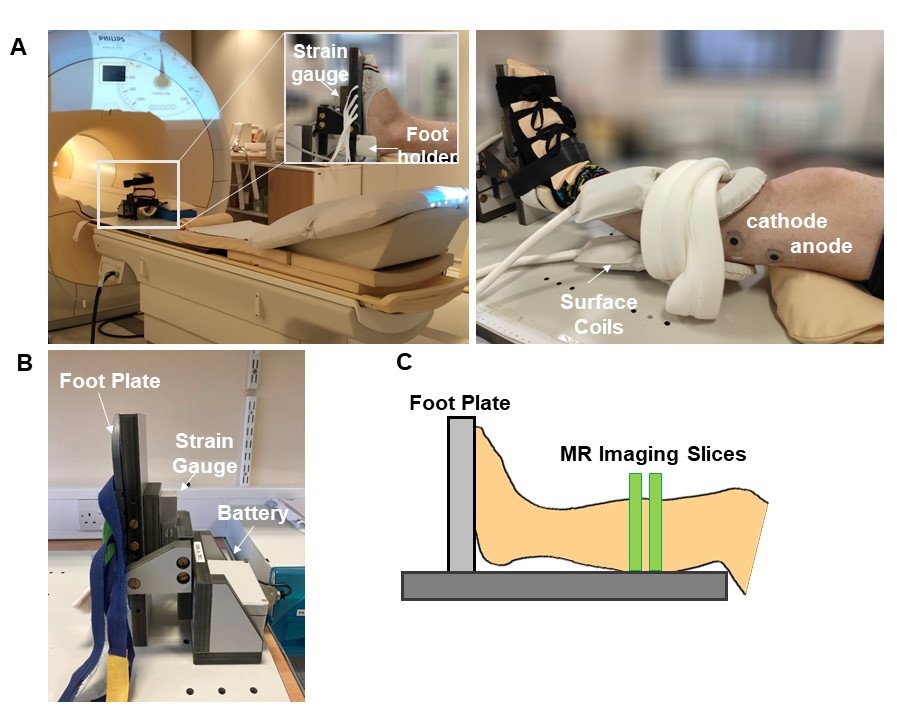
Figure 1: A) Left – set-up for a PC-MUMRI experiment showing the MR compatible force transducer on the scanner bed. The inset image shows the foot position. Right – The elliptical surface coils are placed around the left calf. The stimulating electrodes (cathode and anode) are positioned on top of the peroneal nerve. B) Left – zoomed in image of the force transducer showing foot plate, strain gauge and battery. Right – representation of the MR imaging slices (green rectangles) at the centre of the calf.
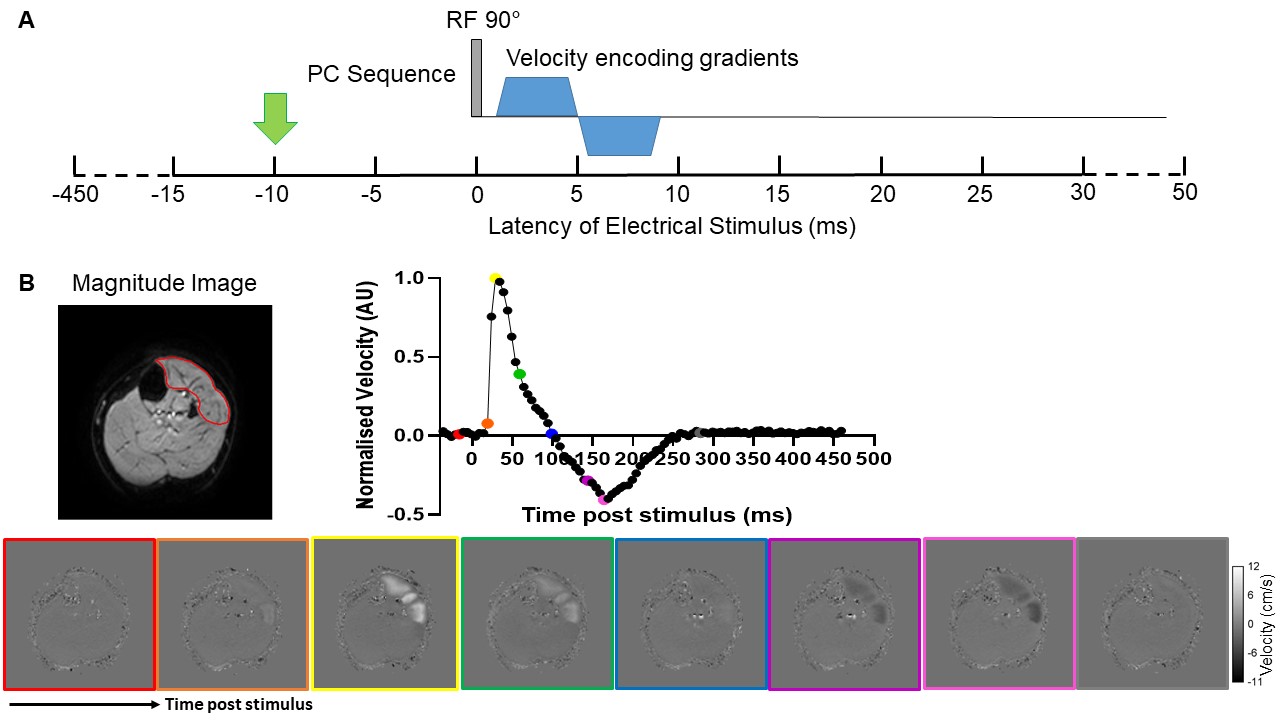
Figure 2: A) Phase contrast (PC) imaging sequence diagram showing 90° RF pulse and bipolar velocity encoding gradients. Bar below demonstrates timing of the electrical stimulus with respect to the 90° RF pulse, an example stimulus at -10 ms is indicated by the green arrow. B) Magnitude image showing the ROI subsequently applied to the phase image. The graph shows normalised velocity plotted against time post stimulus. The coloured points correspond to the phase image below with the same coloured border.
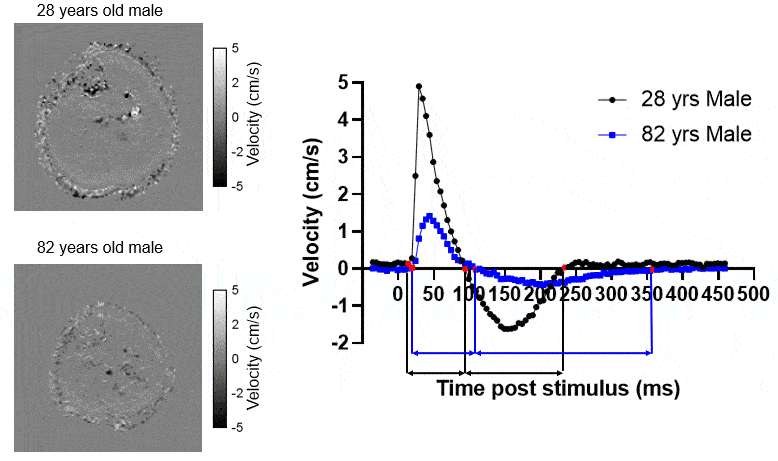
Figure 3: Left – two example videos from a 28 year old male volunteer (top) and 82 year old male volunteer (bottom) volunteer. Right –velocity curves from the two volunteers. The points corresponding to PCstart, PCzerocross and PCend are shown by the red points, the contraction and relaxation times are indicated by the black solid lines and solid arrows for the 28 yr. old and the blue solid lines and dashed arrows for the 82 yr. old. The videos show the acquired images between the PCstart and PCend points for both volunteers.
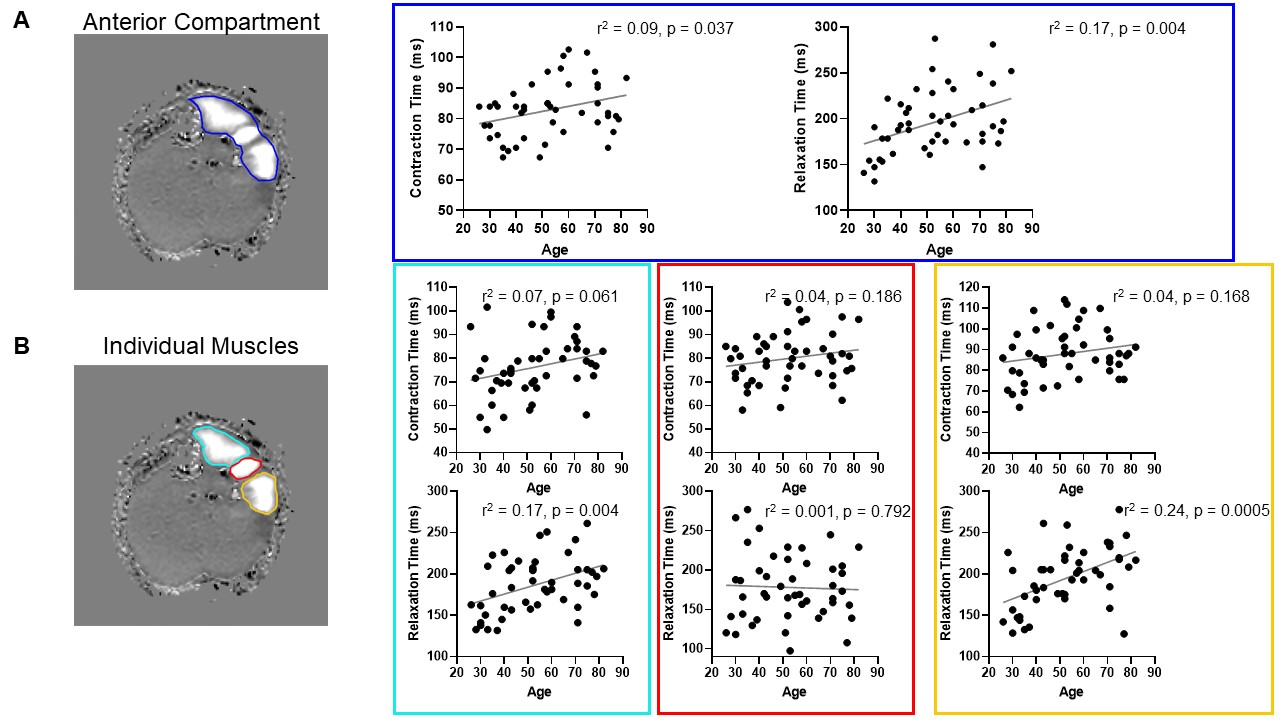
Figure 4: A) Left - example phase image showing anterior compartment delineated by the dark blue ROI. Right - correlation plots of contraction time and relaxation time from the whole anterior compartment. B) Left – example phase image showing individual muscles, tibialis anterior – cyan ROI, extensor digitorum longus – red ROI and peroneus longus – orange ROI. Right – correlation plots of contraction and relaxation times for each individual muscle, the border corresponds to the ROI colour.
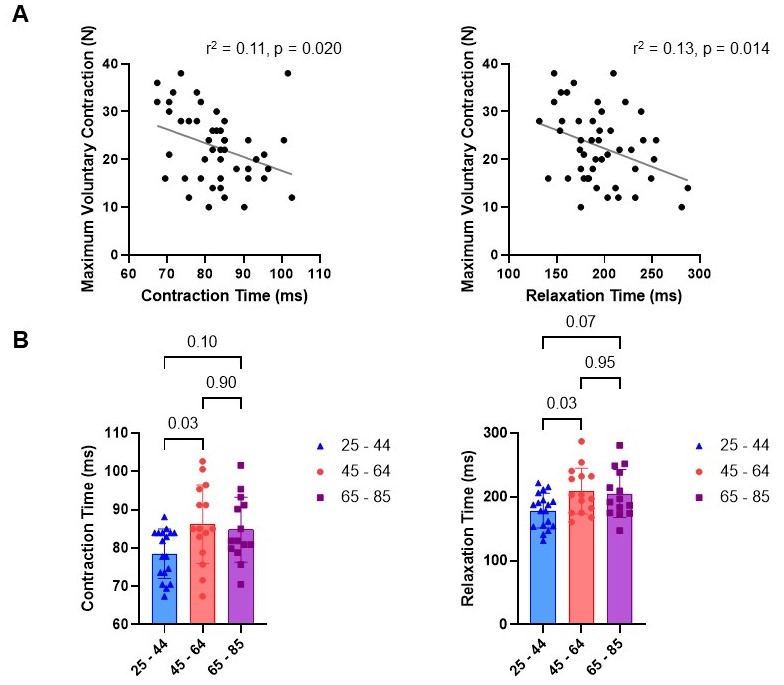
Figure 5: A) Isometric maximum voluntary contraction as a function of muscle contraction and relaxation times, showing two variables are significantly negatively correlated (pcontraction=0.020, prelaxation=0.014). B) Contraction and relaxation times from volunteers split into three different age groups, showing significant differences between contraction and relaxation times between the youngest and middle age groups.