2586
Microvascular specificity in velocity-selective arterial spin labeling: Effects of the post-labeling delay1Center for fMRI, University of California San Diego, La Jolla, CA, United States, 2Department of Electrical and Computer Engineering, UC San Diego, La Jolla, CA, United States, 3Department of Radiology, UC San Diego, La Jolla, CA, United States, 4Department of Psychiatry, UC San Diego, La Jolla, CA, United States, 5Department of Bioengineering, UC San Diego, La Jolla, CA, United States
Synopsis
Keywords: Arterial spin labelling, Arterial spin labelling, Velocity-selective ASL, CBF
Velocity-selective ASL labels arterial blood spins close to the microvasculature if a sufficiently low velocity cutoff (Vcut) is used. Lowering Vcut, however, introduces diffusion and eddy current effects that confound the CBF measurement. A Vcut of 2 cm/s is typical to minimize these effects, but labels blood slightly upstream from the microvasculature; in this scenario, a non-zero post-labeling delay (PLD) allows time for additional microvascular delivery. We evaluate microvascular specificity (using the spatial coefficient of variation of CBF) as a function of PLD. We find that macrovascular specificity increases with PLD up to around 500ms for a typical ASL resolution.Introduction
Velocity-selective ASL (VSASL) labels arterial blood spins based on velocity rather than spatial location. Under certain conditions, this allows immediate label delivery to the microvasculature, thereby avoiding transit delays that result in macrovascular contamination and diminished CBF accuracy1.To achieve transit delay insensitivity, the VSASL velocity cutoff (Vcut) must be sufficiently low to create the label at the transition from macrovasculature to microvasculature2. Lowering the Vcut, however, is limited by increasing eddy current and CSF/tissue diffusion effects that confound the CBF measurement. A tradeoff has been to choose Vcut = 2 cm/s2; this results in minimal diffusion contamination and maintains label generation close to – though slightly upstream from – the microvasculature.
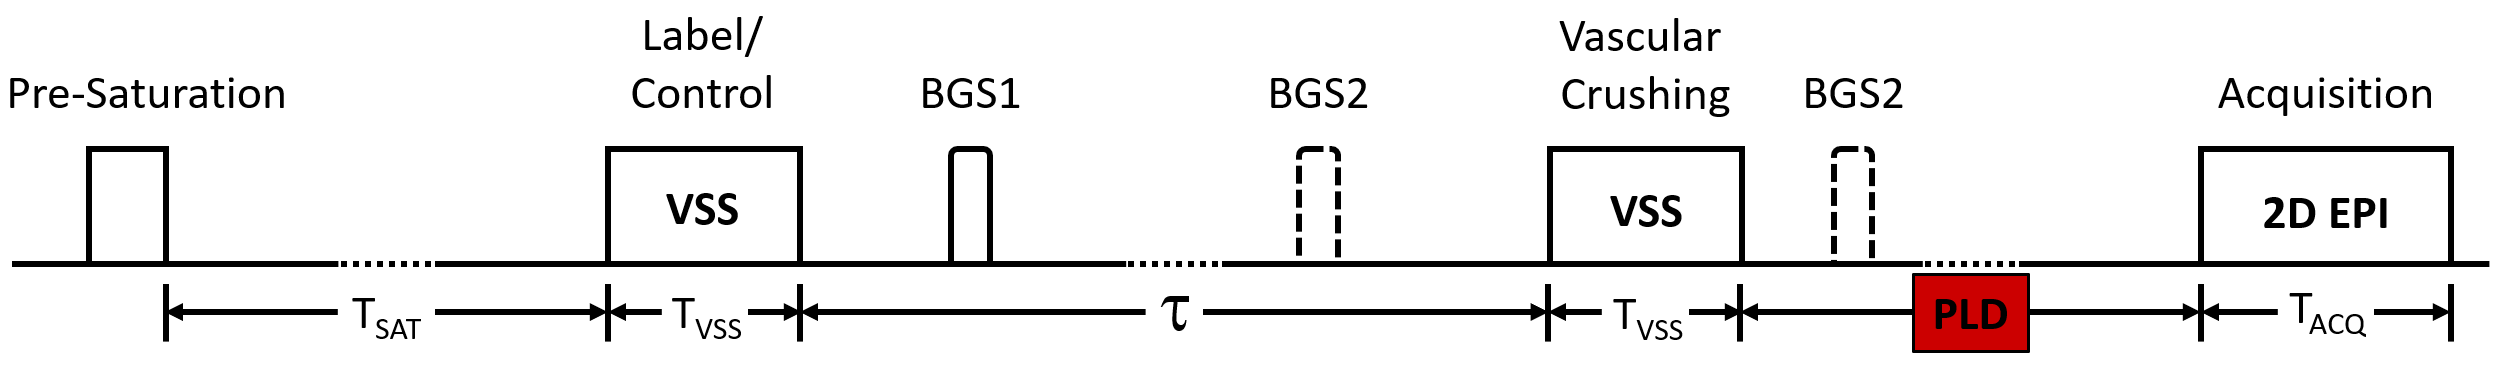
We hypothesize a Vcut of 2 cm/s necessitates a non-zero post-labeling delay (PLD) (Figure 1) to allow the VSASL bolus to transit down the vascular tree, complete microvascular delivery, and attain CBF accuracy at the microvascular scale. This has not typically been done for prior VSASL implementations3.
To test this hypothesis, we evaluate VSASL microvascular specificity as a function of PLD, using the spatial coefficient of variation (sCoV) of CBF as a surrogate for microvascular specificity. sCoV has been previously used to evaluate for intra-arterial contribution to ASL CBF maps4,5; lower values are indicative of an increased proportion of microvascular to macrovascular spins. We also measure tSNR for each PLD, as there is a slight penalty as PLD increases.
Methods
Four subjects were scanned (4M, 23 – 45 yo) on a Siemens Prisma 3T (Siemens Healthineers), with IRB approval. Six VSASL experiments were performed per subject with PLD = 20, 100, 200, 300, 400, and 600 ms. Twenty milliseconds was the shortest PLD possible due to other sequence components (e.g., fat saturation). Additional VSASL-specific parameters include Vcut = 2 cm/s, τ = 1400 ms, and Tsat = 2000 ms, z-directed BIR-8 velocity encoding, with two background suppression pulses. An EPI readout with matrix=64x64, bandwidth=2520 Hz/pixel, TE=12 ms was employed. Six slices were acquired with voxel size = 3.5 x 3.5 x 7 mm3. Scan time ranged from 4m30s to 5m30s for 60 measurements (preliminary experiments found that sCoV sufficiently stabilizes by 60 measurements for all PLDs examined). An M0 calibration scan with a TR of 5 seconds was acquired for absolute quantification and gray matter (GM) segmentation.VSASL CBF maps were calculated using the VSASL signal model in (3). GM masks were created using FSL FAST6. Microvascular specificity was estimated by calculating the (sCoV) within the GM mask, with lower values indicative of greater specificity4. A repeated-measures ANOVA was used to assess for a significant effect of PLD on sCoV. tSNR maps were generated by dividing the mean of the perfusion time series by the standard deviation.
Results
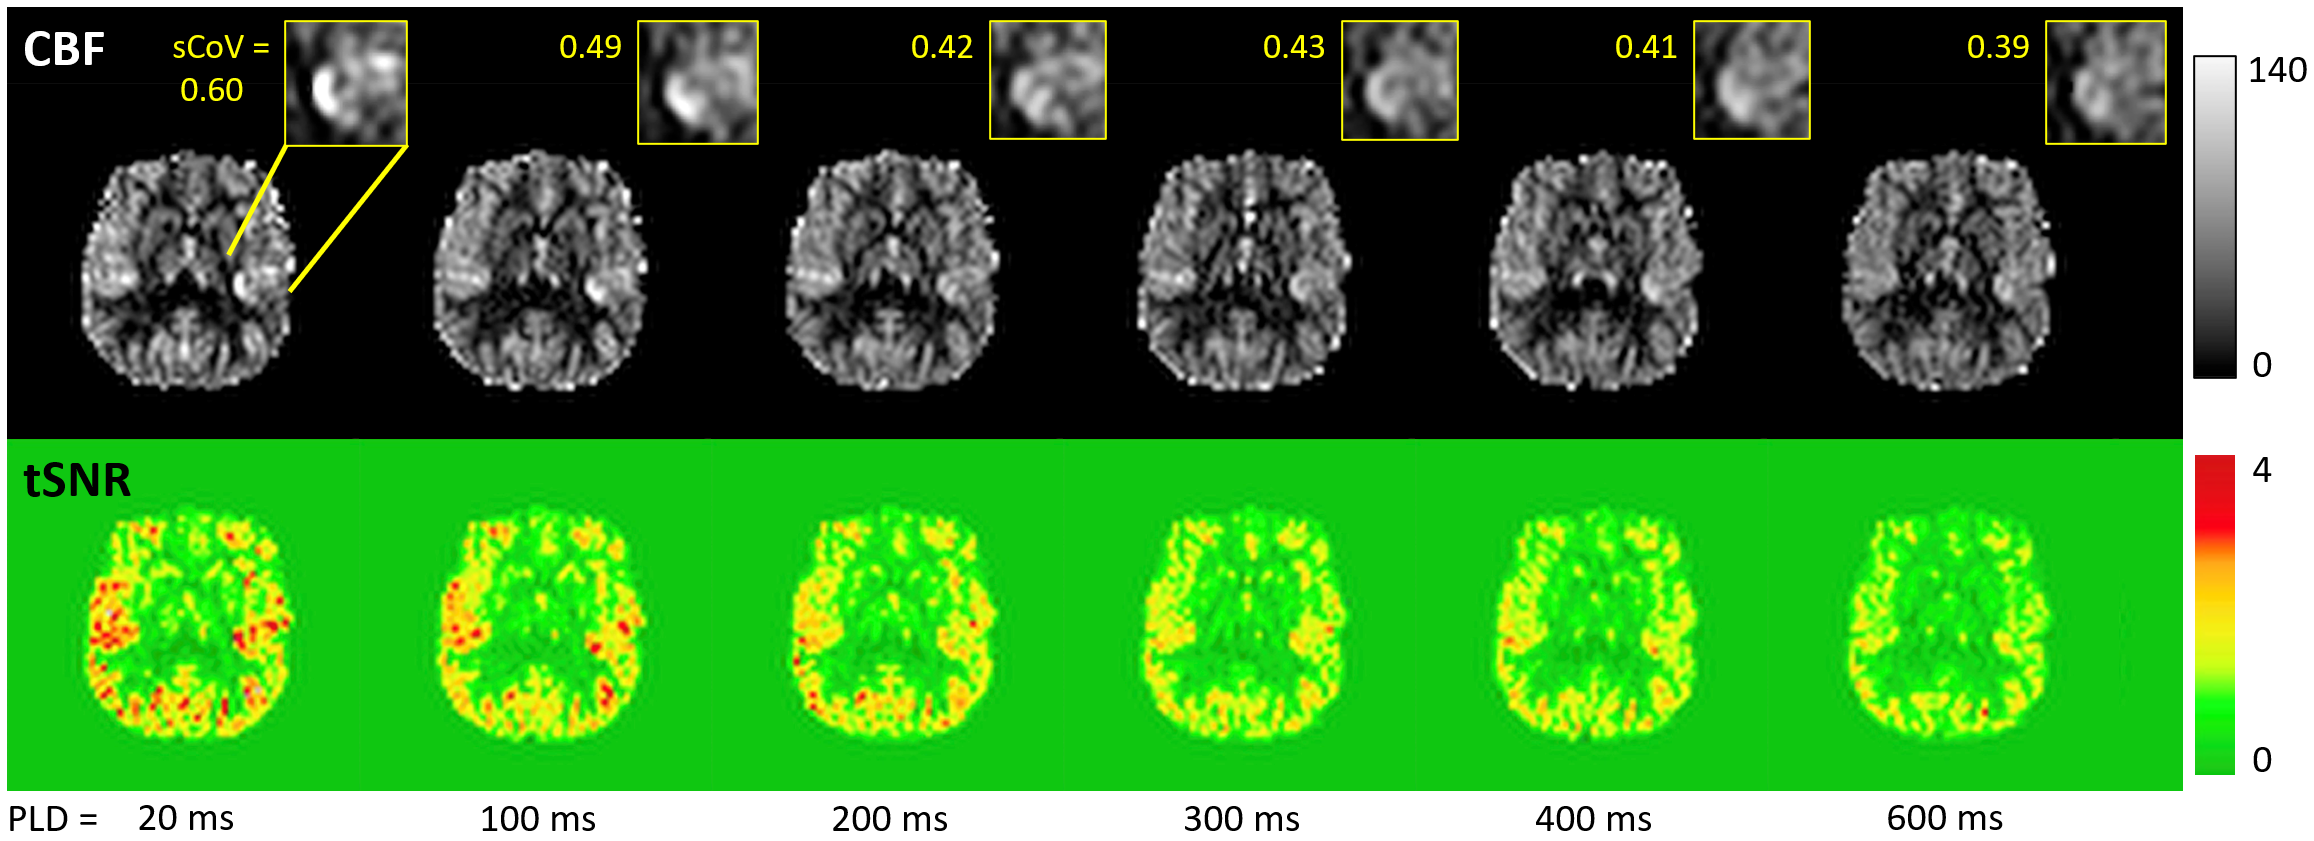
Figure 1 shows the VSASL pulse sequence including PLD parameter.Figure 2 shows representative CBF and tSNR maps from subject 1 for the six PLD VSASL scans at different PLDs. As PLD increases, macrovascular components decrease, and GM CBF becomes progressively more homogeneous. As expected, tSNR decreases with increasing PLD.
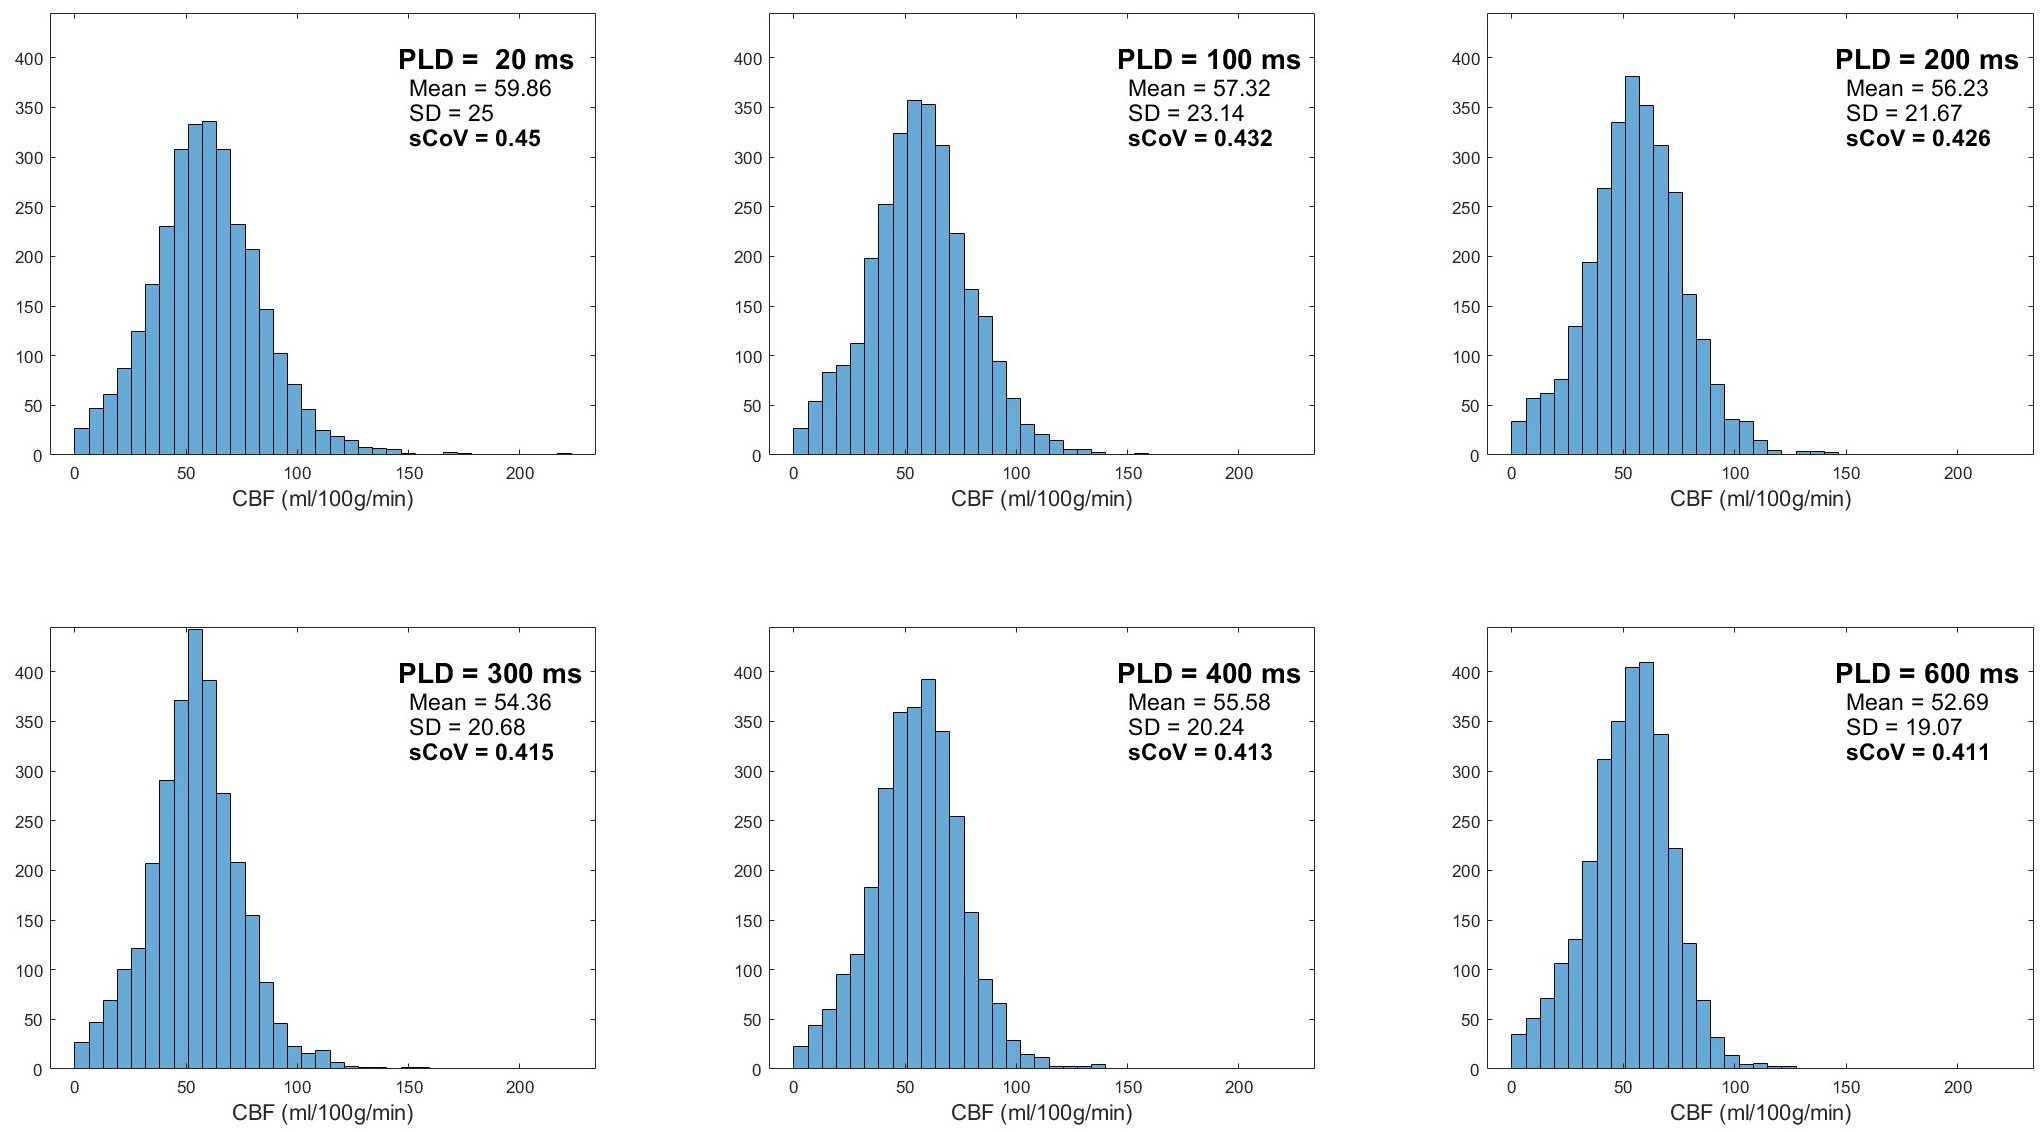
Figure 3 shows the histograms of CBF within GM voxels for subject 1, with associated mean, standard deviation, and sCoV across all GM voxels. A generally decreasing trend is seen in all three parameters as PLD increases.
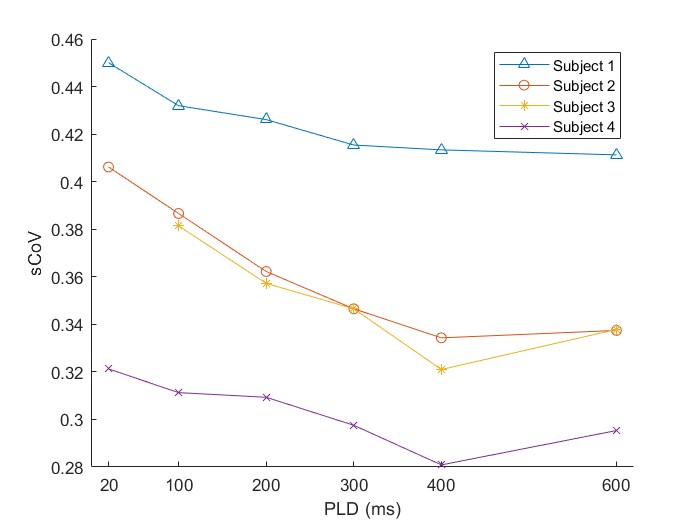
Figure 4 plots GM sCoV as a function of PLD for all three subjects; a clear decrease in sCoV is seen. A minimum sCoV is seen at PLD = 600 ms for subject 1 and 400 ms for subjects 2-4. Repeated measures ANOVA identifies a significant effect of PLD on sCoV at p < 0.0001.
Discussion
Our findings suggest that the PLD significantly affects microvascular specificity of the VSASL CBF measurement. Reductions in sCoV were most pronounced at the lower PLDs and less pronounced at higher values. Our results in Figure 4 suggest that beyond a certain PLD, the trailing edge of the VSASL bolus will have sufficiently cleared the macrovasculature, and increasing the PLD further will only result in unnecessary signal loss. Sufficient macrovasculature clearance will subsequently allow accurate CBF measurement by properly including microvascular spins destined for the voxel-of-interest and excluding arterial spins destined for other voxels.It is important to note that both Vcut and voxel size will determine the optimal PLD needed for delivery to the target voxel. As Vcut increases, the trailing edge of the bolus shifts upstream, and the optimal PLD increases. As resolution increases, spins must travel further down the vascular tree to ultimately reside within their destination voxel, also requiring a longer PLD. Longer PLDs, on the other hand, will reduce tSNR and a compromise may be required. Exploration of the effects of varying Vcut and voxel size on PLD optimization, sCoV, and tSNR will be performed in future studies.
Conclusion
Implementing a non-zero PLD in VSASL experiments improves microvascular specificity by allowing further transit of the VSASL bolus into the microvasculature.Acknowledgements
No acknowledgement found.References
1. Wong EC, et al. Velocity-Selective Arterial Spin Labeling. Magn. Reson. Med. 55(6):1334–1341, 2006.
2. Wu W, et al. Intravascular effect in velocity-selective arterial spin labeling: The choice of inflow time and cutoff velocity. NeuroImage 32(1):122–128, 2006.
3. Qin Q, et al. Velocity-selective arterial spin labeling perfusion MRI: A review of the state of the art and recommendations for clinical implementation. Magn. Reson. Med. 88(4):1528–1547, 2022.
4. Mutsaerts HJ, Petr J, Václavů L, et al. The spatial coefficient of variation in arterial spin labeling cerebral blood flow images. Journal of Cerebral Blood Flow & Metabolism. 37(9):3184–3192, 2017.
5. Mutsaerts HJ, Petr J, Bokkers RPH, et al. Spatial coefficient of variation of arterial spin labeling MRI as a cerebrovascular correlate of carotid occlusive disease. PLoS One. 15(2):e0229444, 2020.
6. Zhang Y, Brady M, and Smith S. Segmentation of brain MR images through a hidden Markov random field model and the expectation-maximization algorithm. IEEE Trans. Med. Imag. 20(1):45–57, 2001.
Figures