2584
Evaluation of 3D Stack-of-Spiral Turbo FLASH Acquisitions for PCASL- and VSASL-Derived Brain Perfusion Mapping
Dan Zhu1,2, Feng Xu1,2, Dapeng Liu1,2, Doris Lin2, Peter van Zijl1,2, and Qin Qin1,2
1F.M. Kirby Research Center for Functional Brain Imaging, Kennedy Krieger Institute, Baltimore, MD, United States, 2The Russell H. Morgan Department of Radiology and Radiological Science, Johns Hopkins School of Medicine, Baltimore, MD, United States
1F.M. Kirby Research Center for Functional Brain Imaging, Kennedy Krieger Institute, Baltimore, MD, United States, 2The Russell H. Morgan Department of Radiology and Radiological Science, Johns Hopkins School of Medicine, Baltimore, MD, United States
Synopsis
Keywords: Arterial spin labelling, Arterial spin labelling
The most-used 3D acquisition for ASL at 3T is GRASE or stack-of-spiral (SOS) based FSE, which requires multiple shots to cover the full k-space. Alternatively, turbo FLASH (TFL) acquisition allows longer echo trains with slower T1 (than T2) relaxation, and 3D SOS-TFL has the potential to reduce the number of shots to even single-shot, thus improving the temporal resolution for ASL. Here we demonstrated comparable performance of 3D SOS-TFL with 3D GRASE on PCASL- and VSASL-derived CBF mapping and VSASL-derived CBV mapping at 3T on 12 healthy subjects, and the utility of 3D SOS-TFL on a stroke patient.Introduction
The most-used 3D acquisition for ASL-derived brain perfusion mapping at 3T is EPI-based GRASE or stack-of-spiral (SOS)-based FSE1–3. Because fast T2 decay during the long echo train leads to through-slice blurring, conventional GRASE or SOS-FSE requires multiple shots to cover the whole brain. An alternative method, turbo FLASH (TFL) acquisition, allows longer echo trains (due to the slower T1 relaxation4) and 3D SOS-TFL has the potential to reduce the number of shots to as low as single-shot, thus improving the temporal resolution for ASL5,6. In this work, we compared the performance of 3D SOS-TFL with 3D GRASE on PCASL7- and VSASL8,9-derived cerebral blood flow (CBF) mapping as well as VSASL-derived cerebral blood volume (CBV) mapping10,11 at 3T, and tested the utility of 3D SOS-TFL on a stroke patient.Methods
Experiments were conducted on 3T Philips using a 32-channel head-only receive coil. 12 healthy subjects (age 41.6±13.6, 6F) and one stroke patient three-months post-onset were enrolled with written informed consent.The labeling preparations for PCASL- and VSASL-derived CBF mapping and VSASL-derived CBV mapping used the following parameters. PCASL-CBF7: labeling duration=1800ms, PLD=2000ms, 4 background suppression (BS) pulses. VSASL-CBF2,9: global pre-saturation with a 2s delay, Fourier-transform based (FT-) VS inversion Vcut=2cm/s (duration=64ms), bolus duration=1400ms, 3 BS pulses. For CBF mapping, both PCASL and VSASL applied vascular crushing modules with Vcut=2cm/s. VSASL-CBV11: global pre-saturation with a 2s delay, FT-VS saturation Vcut=0.5cm/s (duration=96ms) right before acquisition. All VS gradients were in FH direction.
The axial acquisition of 3D SOS-TFL and 3D GRASE both had FOV=220×220×120mm3 and resolution=3.4×3.4×5mm3 (AP×RL×FH). SOS-TFL: turbo factor=24 in the slice direction, centric ordering, TR/TE=18/2.6ms, readout time=11ms, echo-train duration=432ms, 3-shot per image, label/control pairs=8, shot interval=4.3/3.9/2.6s and scan time=3.4/3.1/2.2min (PCASL-CBF/VSASL-CBF/VSASL-CBV). No acceleration was applied for SOS-TFL. SPIR and selective water excitation (WE) fat suppression methods were compared on 3 subjects. FA=[5°,15°, 25°] were compared on one subject and FA=[9°,12°,15°,18°] were compared on 3 subjects. WE and FA=15° were by default when not specified. GRASE: turbo factor=12, echo spacing=13ms, EPI factor=15, SENSE factor=2, readout time=9ms, echo-train duration=156ms, 4-shot per image, 6 label/control pairs, TR=4.1/3.6/2.3s and scan time=3.7/3.3/2.1min (PCASL-CBF/VSASL-CBF/VSASL-CBV).
For each acquisition, a proton-density weighted image (SIPD, TR=10s), a double inversion recovery (DIR, visualize gray matter, TR/TI1/TI2 = 10/3.58/0.48s), and an image acquired immediately after global saturation (TFL only, for T1-induced bias correction4,12) were acquired.
The images using the fully-sampled 3D SOS-TFL (including deblurring) and the 3D GRASE with a SNESE factor of 2 were reconstructed automatically by the vendor. CBF and CBV perfusion maps were quantified from the perfusion-weighted signal (PWS=(control-label)/SIPD) with formula in publications1,8,11. We also evaluated the temporal signal-to-noise-ratio (tSNR) efficiency as tSNR divided by the square root of the time per label/control pair13,14. Gray matter (GM) ROIs were generated from DIR images with threshold=(max intensity+min intensity)/2. Whole-brain GM perfusion and tSNR efficiency were averaged within the GM ROIs.
Results
Fig.1 displays the control and PWS images of SOS-TFL scans with SPIR and WE fat suppression of two subjects. Fat-induced artifacts were visible in SPIR-based scans, but not in WE scans, because fast-recovering fat signals are suppressed in each water excitation repeatedly but only before the first excitation in SPIR. Artifacts were less visible on the PWS of VSASL-CBV, possibly due to higher CBV-weighted PWS than CBF-weighted PWS.Fig.2 arrays the DIR, PWS and tSNR efficiency of SOS-TFL with different FAs. Larger FAs resulted in higher tSNR efficiency but more image blurring.
Fig.3a demonstrates that SOS-TFL-based CBF and CBV maps and tSNR efficiency images are comparable to GRASE. Note that SOS-TFL-based VSASL-CBF reduces CSF artifacts compared to GRASE (purple arrow). A possible reason is that the T1-weighted TFL has lower CSF signals. The correlations of the whole-brain GM perfusion between SOS-TFL and GRASE for 12 subjects were plotted in Fig.3b, all showing high correlation coefficients (r≥0.95).
Table 1 summarizes the average and SD of perfusion and tSNR efficiency from whole-brain GM ROIs of 12 subjects. Compared to GRASE, SOS-TFL showed no significant difference in GM perfusions for PCASL-CBF (P=0.48), was 7.1% lower for VSASL-CBF (P<0.05) and 15.7% higher for VSASL-CBV (P<0.05). A possible explanation for lower VSASL-CBF is that the T1-weighting reduced CSF partial volume effects. For tSNR efficiency, SOS-TFL was 29.2% lower for PCASL-CBF (P<0.05), comparable for VSASL-CBF (P=0.75), and 14.2% higher for VSASL-CBV (P<0.05).
Perfusion images of a patient 3-months following a hemorrhagic stroke involving the right dorsal insula and deep GM are shown in Fig.4. Decreased CBF, increased CBV, and prolonged mean transient time (MTT=CBV/CBF) were observed in the right parietal lobe region distal to the site of hemorrhage (purple circles).
Discussion and Conclusion
We evaluated different SOS-TFL acquisitions for PCASL and VSASL sequences for brain perfusion mapping. Water excitation is necessary to eliminate fat-induced artifacts. The choice of flip angle needs to consider balancing image blurring and tSNR efficiency. SOS-TFL reduced CSF artifacts for VSASL-CBF and increased tSNR for VSASL-CBV. For PCASL- and VSASL-based CBF and CBV mapping, compared to the employed 4-shot 3D GRASE with an acceleration factor of 2, the fully-sampled 3D SOS-TFL delivered comparable performance (with a similar scan time) using 3 shots, which can potentially be undersampled with SENSE or compressed sensing to further achieve single-shot acquisition.Acknowledgements
No acknowledgement found.References
- Alsop DC, Detre JA, Golay X, et al. Recommended implementation of arterial spin-labeled perfusion MRI for clinical applications: A consensus of the ISMRM perfusion study group and the European consortium for ASL in dementia. Magn Reson Med. 2015;73(1):102-116.
- Qin Q, Alsop DC, Bolar DS, et al. Velocity‐selective arterial spin labeling perfusion MRI: A review of the state of the art and recommendations for clinical implementation. Magnetic Resonance in Med. 2022;88(4):1528-1547.
- Hernandez‐Garcia L, Aramendía‐Vidaurreta V, Bolar DS, et al. Recent Technical Developments in ASL: A Review of the State of the Art. Magnetic Resonance in Med. 2022;88(5):2021-2042.
- Zhu D, Qin Q. A revisit of the k-space filtering effects of magnetization-prepared 3D FLASH and balanced SSFP acquisitions: Analytical characterization of the point spread functions. Magnetic Resonance Imaging. 2022;88:76-88.
- Nielsen JF, Hernandez-Garcia L. Functional perfusion imaging using pseudocontinuous arterial spin labeling with low-flip-angle segmented 3D spiral readouts. Magn Reson Med. 2013;69(2):382-390.
- Hernandez‐Garcia L, Nielsen J, Noll DC. Improved sensitivity and temporal resolution in perfusion FMRI using velocity selective inversion ASL. Magn Reson Med. 2019;81(2):1004-1015.
- Dai W, Garcia D, de Bazelaire C, Alsop DC. Continuous flow-driven inversion for arterial spin labeling using pulsed radio frequency and gradient fields: Pulsed Continuous Arterial Spin Labeling. Magn Reson Med. 2008;60(6):1488-1497.
- Qin Q, van Zijl PCM. Velocity-selective-inversion prepared arterial spin labeling. Magn Reson Med. 2016;76(4):1136-1148.
- Liu D, Xu F, Li W, Zijl PC, Lin DD, Qin Q. Improved velocity‐selective‐inversion arterial spin labeling for cerebral blood flow mapping with 3D acquisition. Magn Reson Med. 2020;84(5):2512-2522.
- Qin Q, Qu Y, Li W, et al. Cerebral blood volume mapping using Fourier-transform-based velocity-selective saturation pulse trains. Magn Reson Med. 2019;81(6):3544-3554.
- Li W, Liu D, Zijl PCM, Qin Q. Three‐dimensional whole‐brain mapping of cerebral blood volume and venous cerebral blood volume using Fourier transform–based velocity‐selective pulse trains. Magnetic Resonance in Med. 2021;86(3):1420-1433.
- Zhu D, Schär M, Qin Q. Ultrafast B1 mapping with RF‐prepared 3D FLASH acquisition: Correcting the bias due to T1‐induced k‐space filtering effect. Magnetic Resonance in Med. Published online April 5, 2022:mrm.29247.
- Guo J, Wong EC. Increased SNR efficiency in velocity selective arterial spin labeling using multiple velocity selective saturation modules (mm-VSASL). Magn Reson Med. 2015;74(3):694-705.
- Meixner CR, Eisen CK, Schmitter S, et al. Hybrid‐shimming and gradient adaptions for improved pseudo‐continuous arterial spin labeling at 7 Tesla. Magnetic Resonance in Med. 2022;87(1):207-219.
Figures
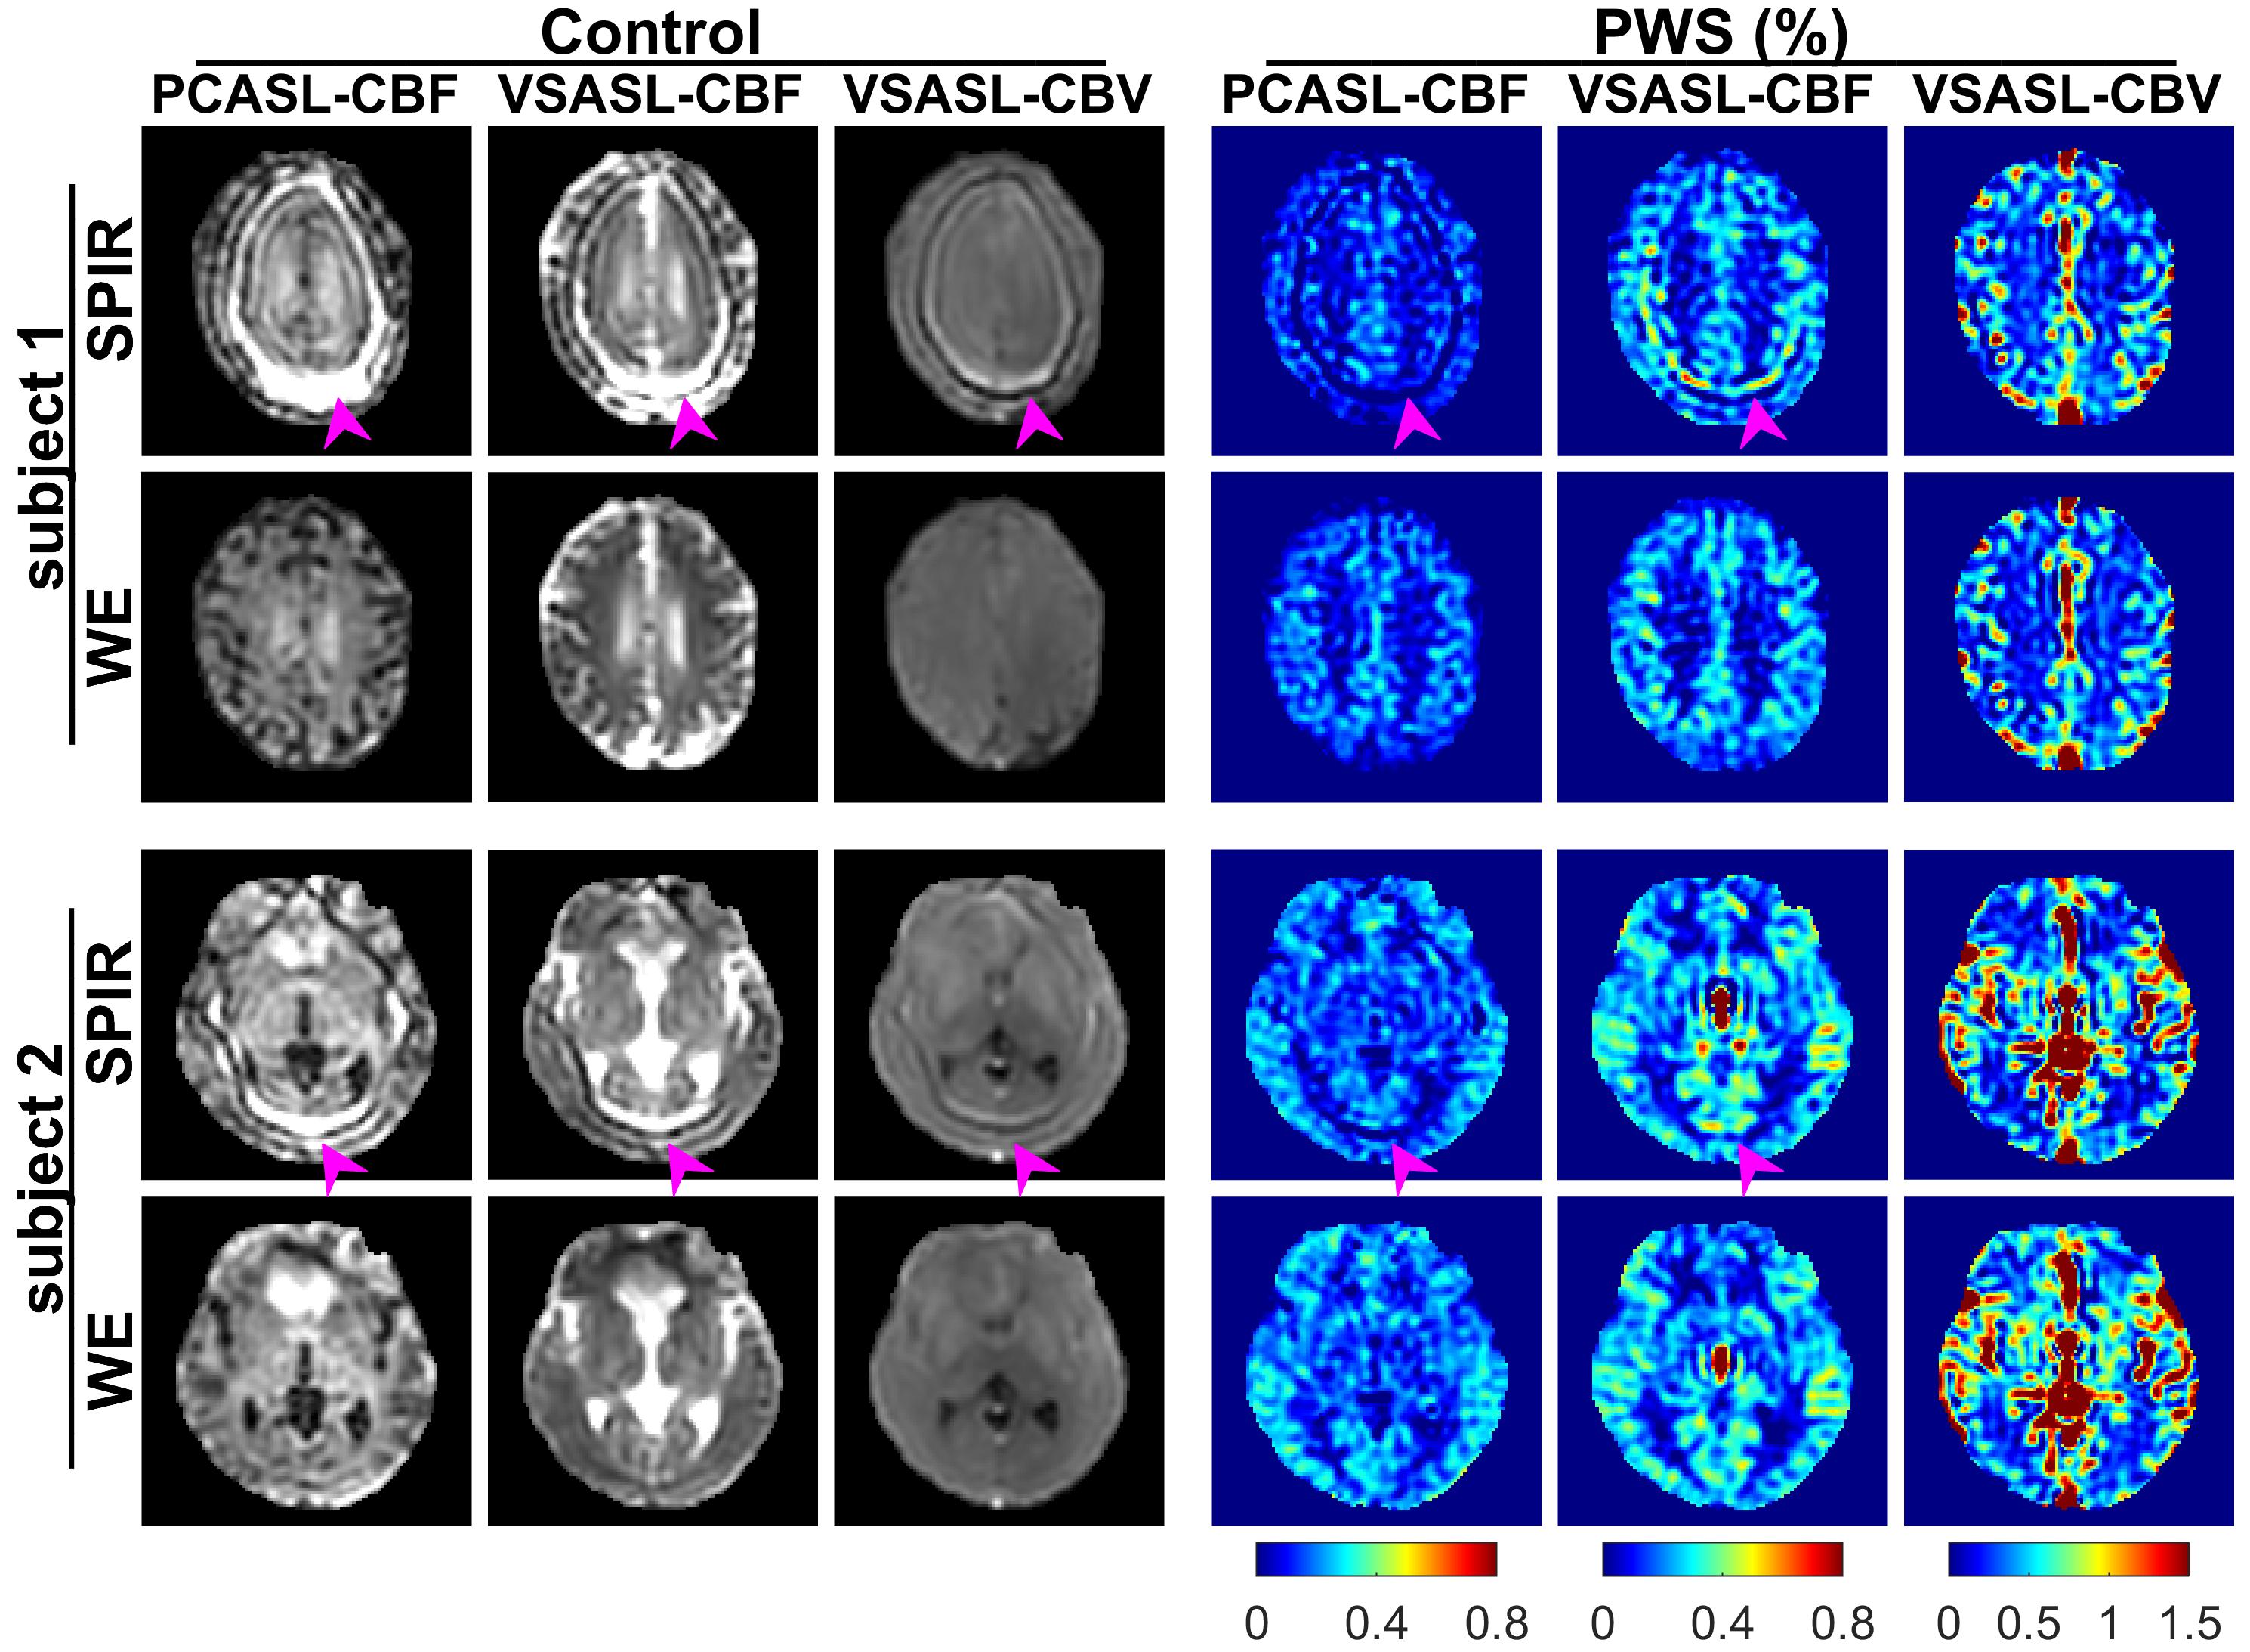
Figures 1:
Control and perfusion-weighted signal (PWS) images of stack-of-spiral turbo
FLASH (SOS-TFL) scans with SPIR and water-excitation (WE) fat suppression on
two subjects. SPIR scans show severe fat-related artifacts on all control
images, PWS images of both subjects for PCASL-CBF, PWS image of subject 1 for VSASL-CBF,
and small artifacts on PWS images of subject 2 for VSASL-CBF. Artifacts were
not visible on PWS images of both subjects for VSASL-CBV, possibly due to the
higher CBV-weighted PWS than CBF-weighted PWS. No artifacts were observed on
any WE scans.
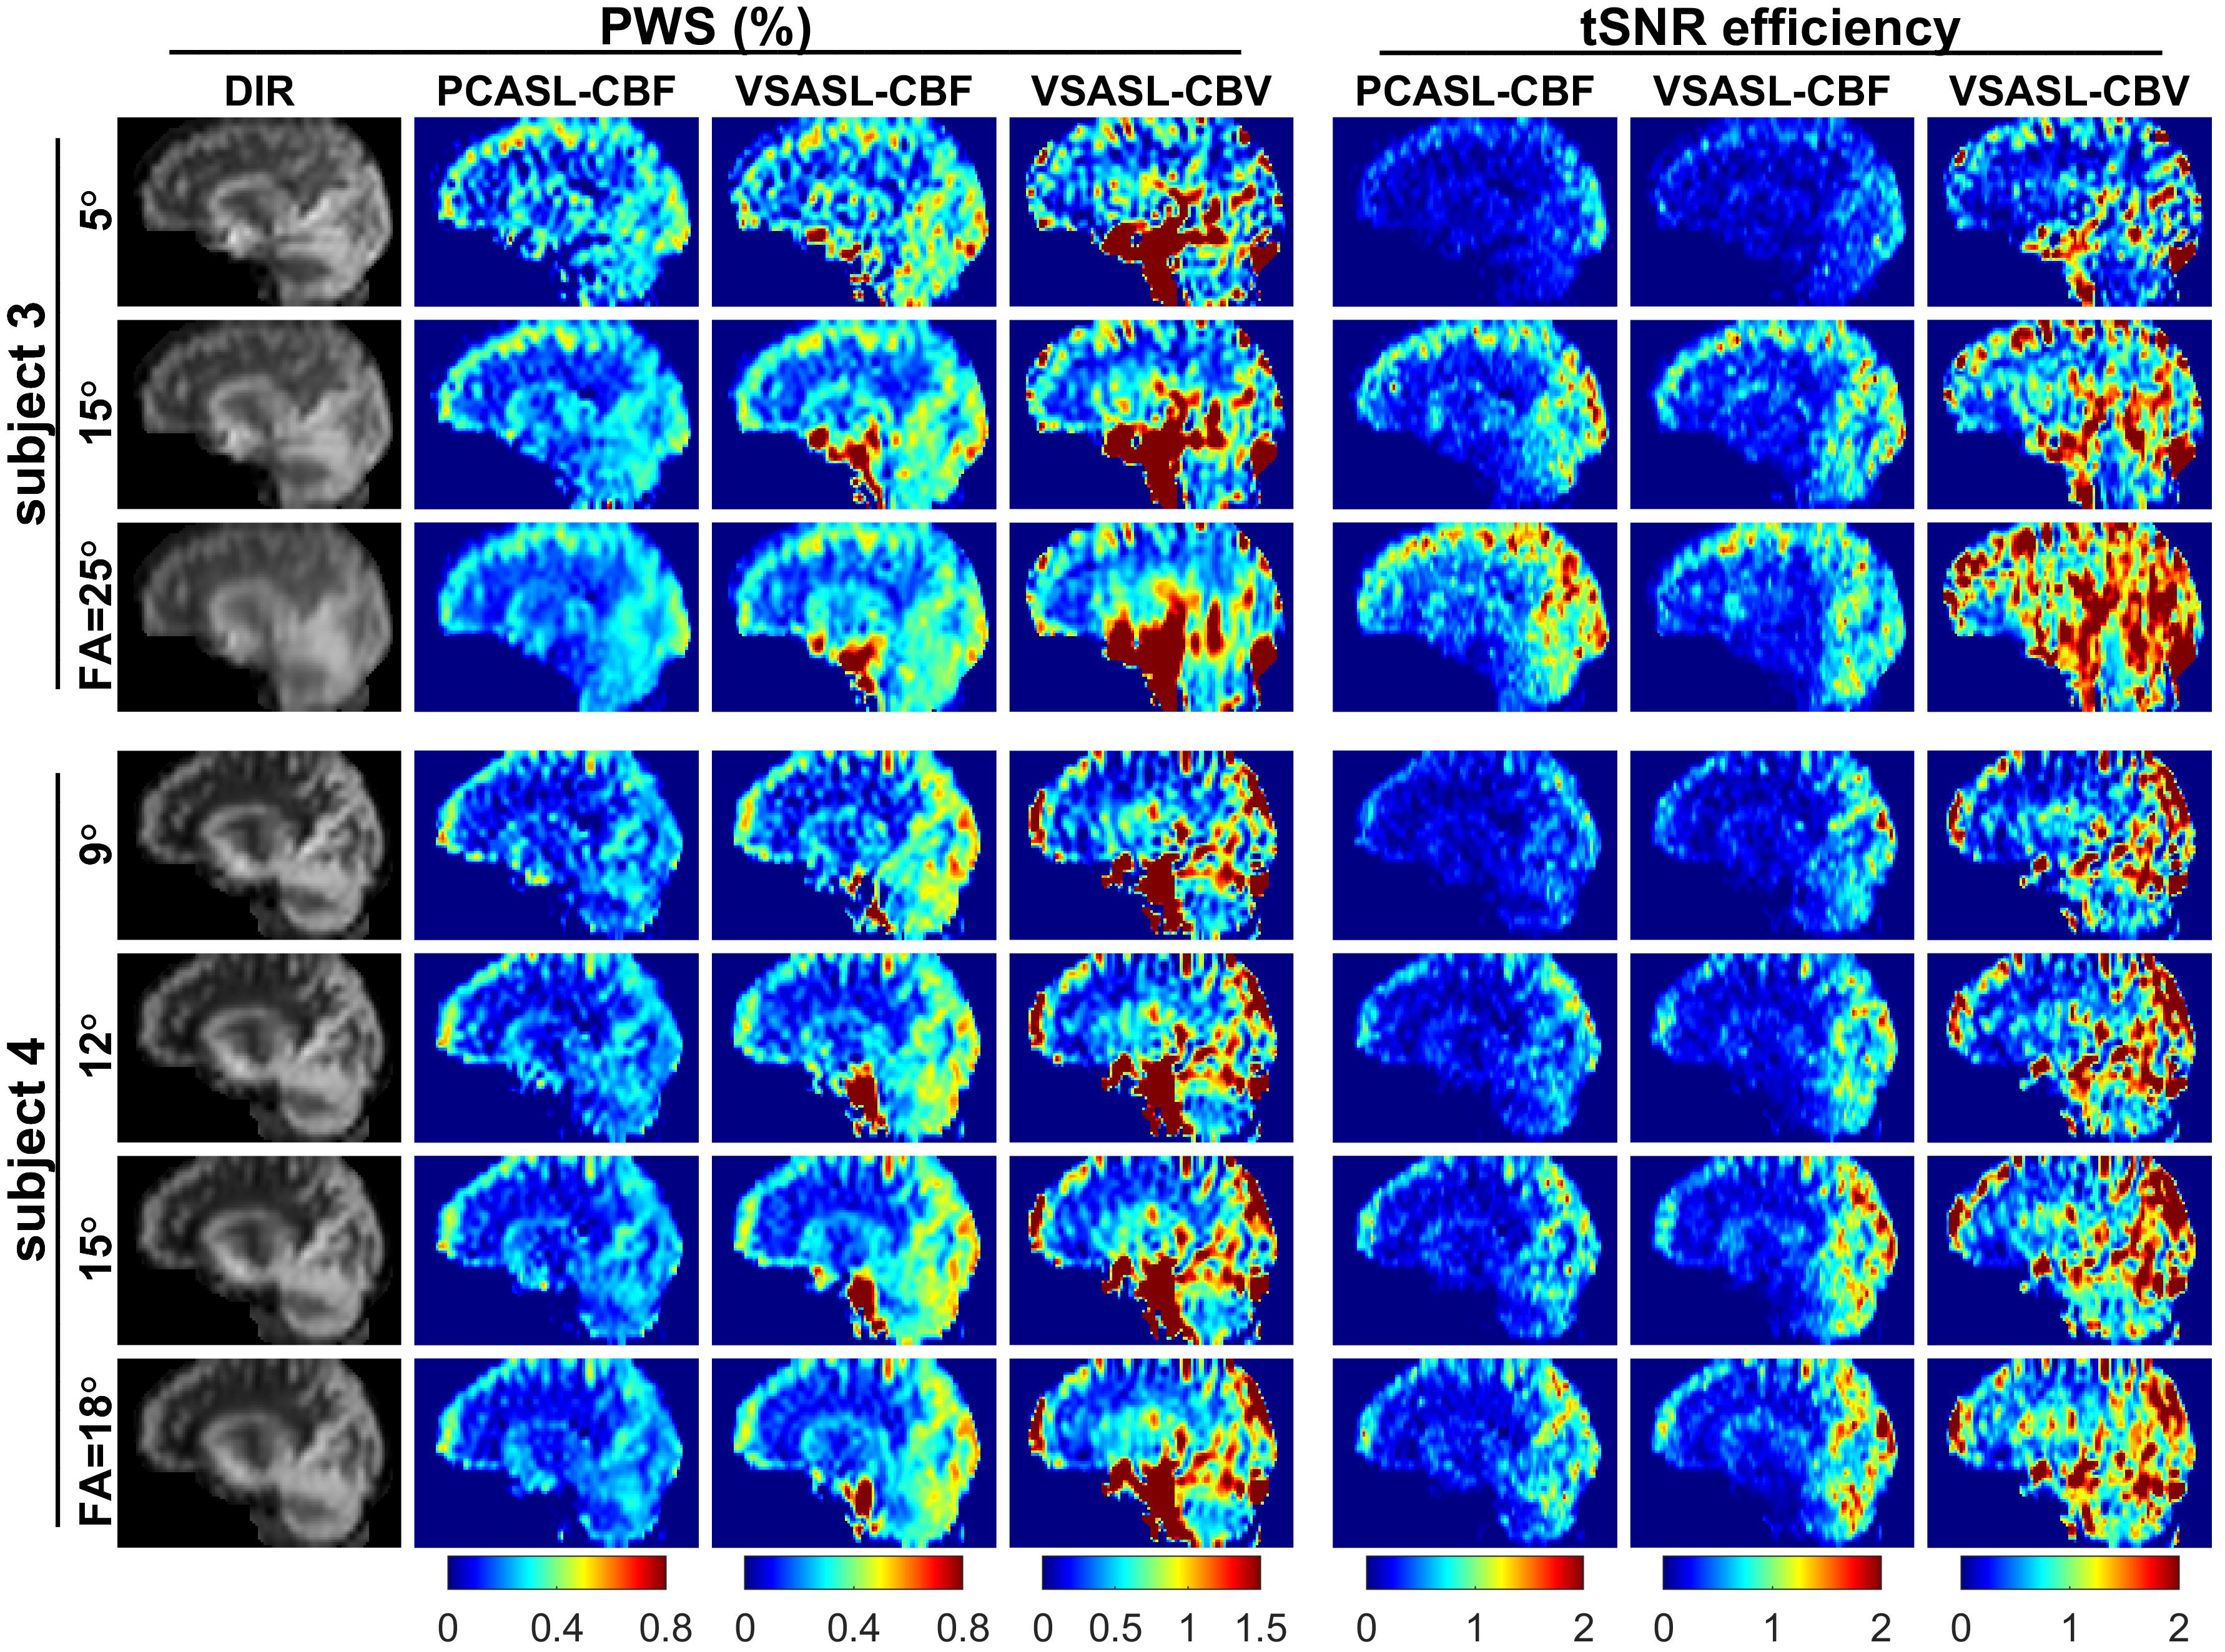
Figure 2:
A sagittal slice of the double inversion recovery (DIR), perfusion-weighted
signal (PWS) and temporal SNR (tSNR) efficiency images of 3D stack-of-spiral turbo
FLASH (SOS-TFL) with different flip angles (FAs) on two subjects. Different FAs
generated similar PWS for PCASL-CBF and VSASL-CBF, -CBV methods, with larger
FAs resulting in higher tSNR efficiency but more image blurring (most visible
with 25°).
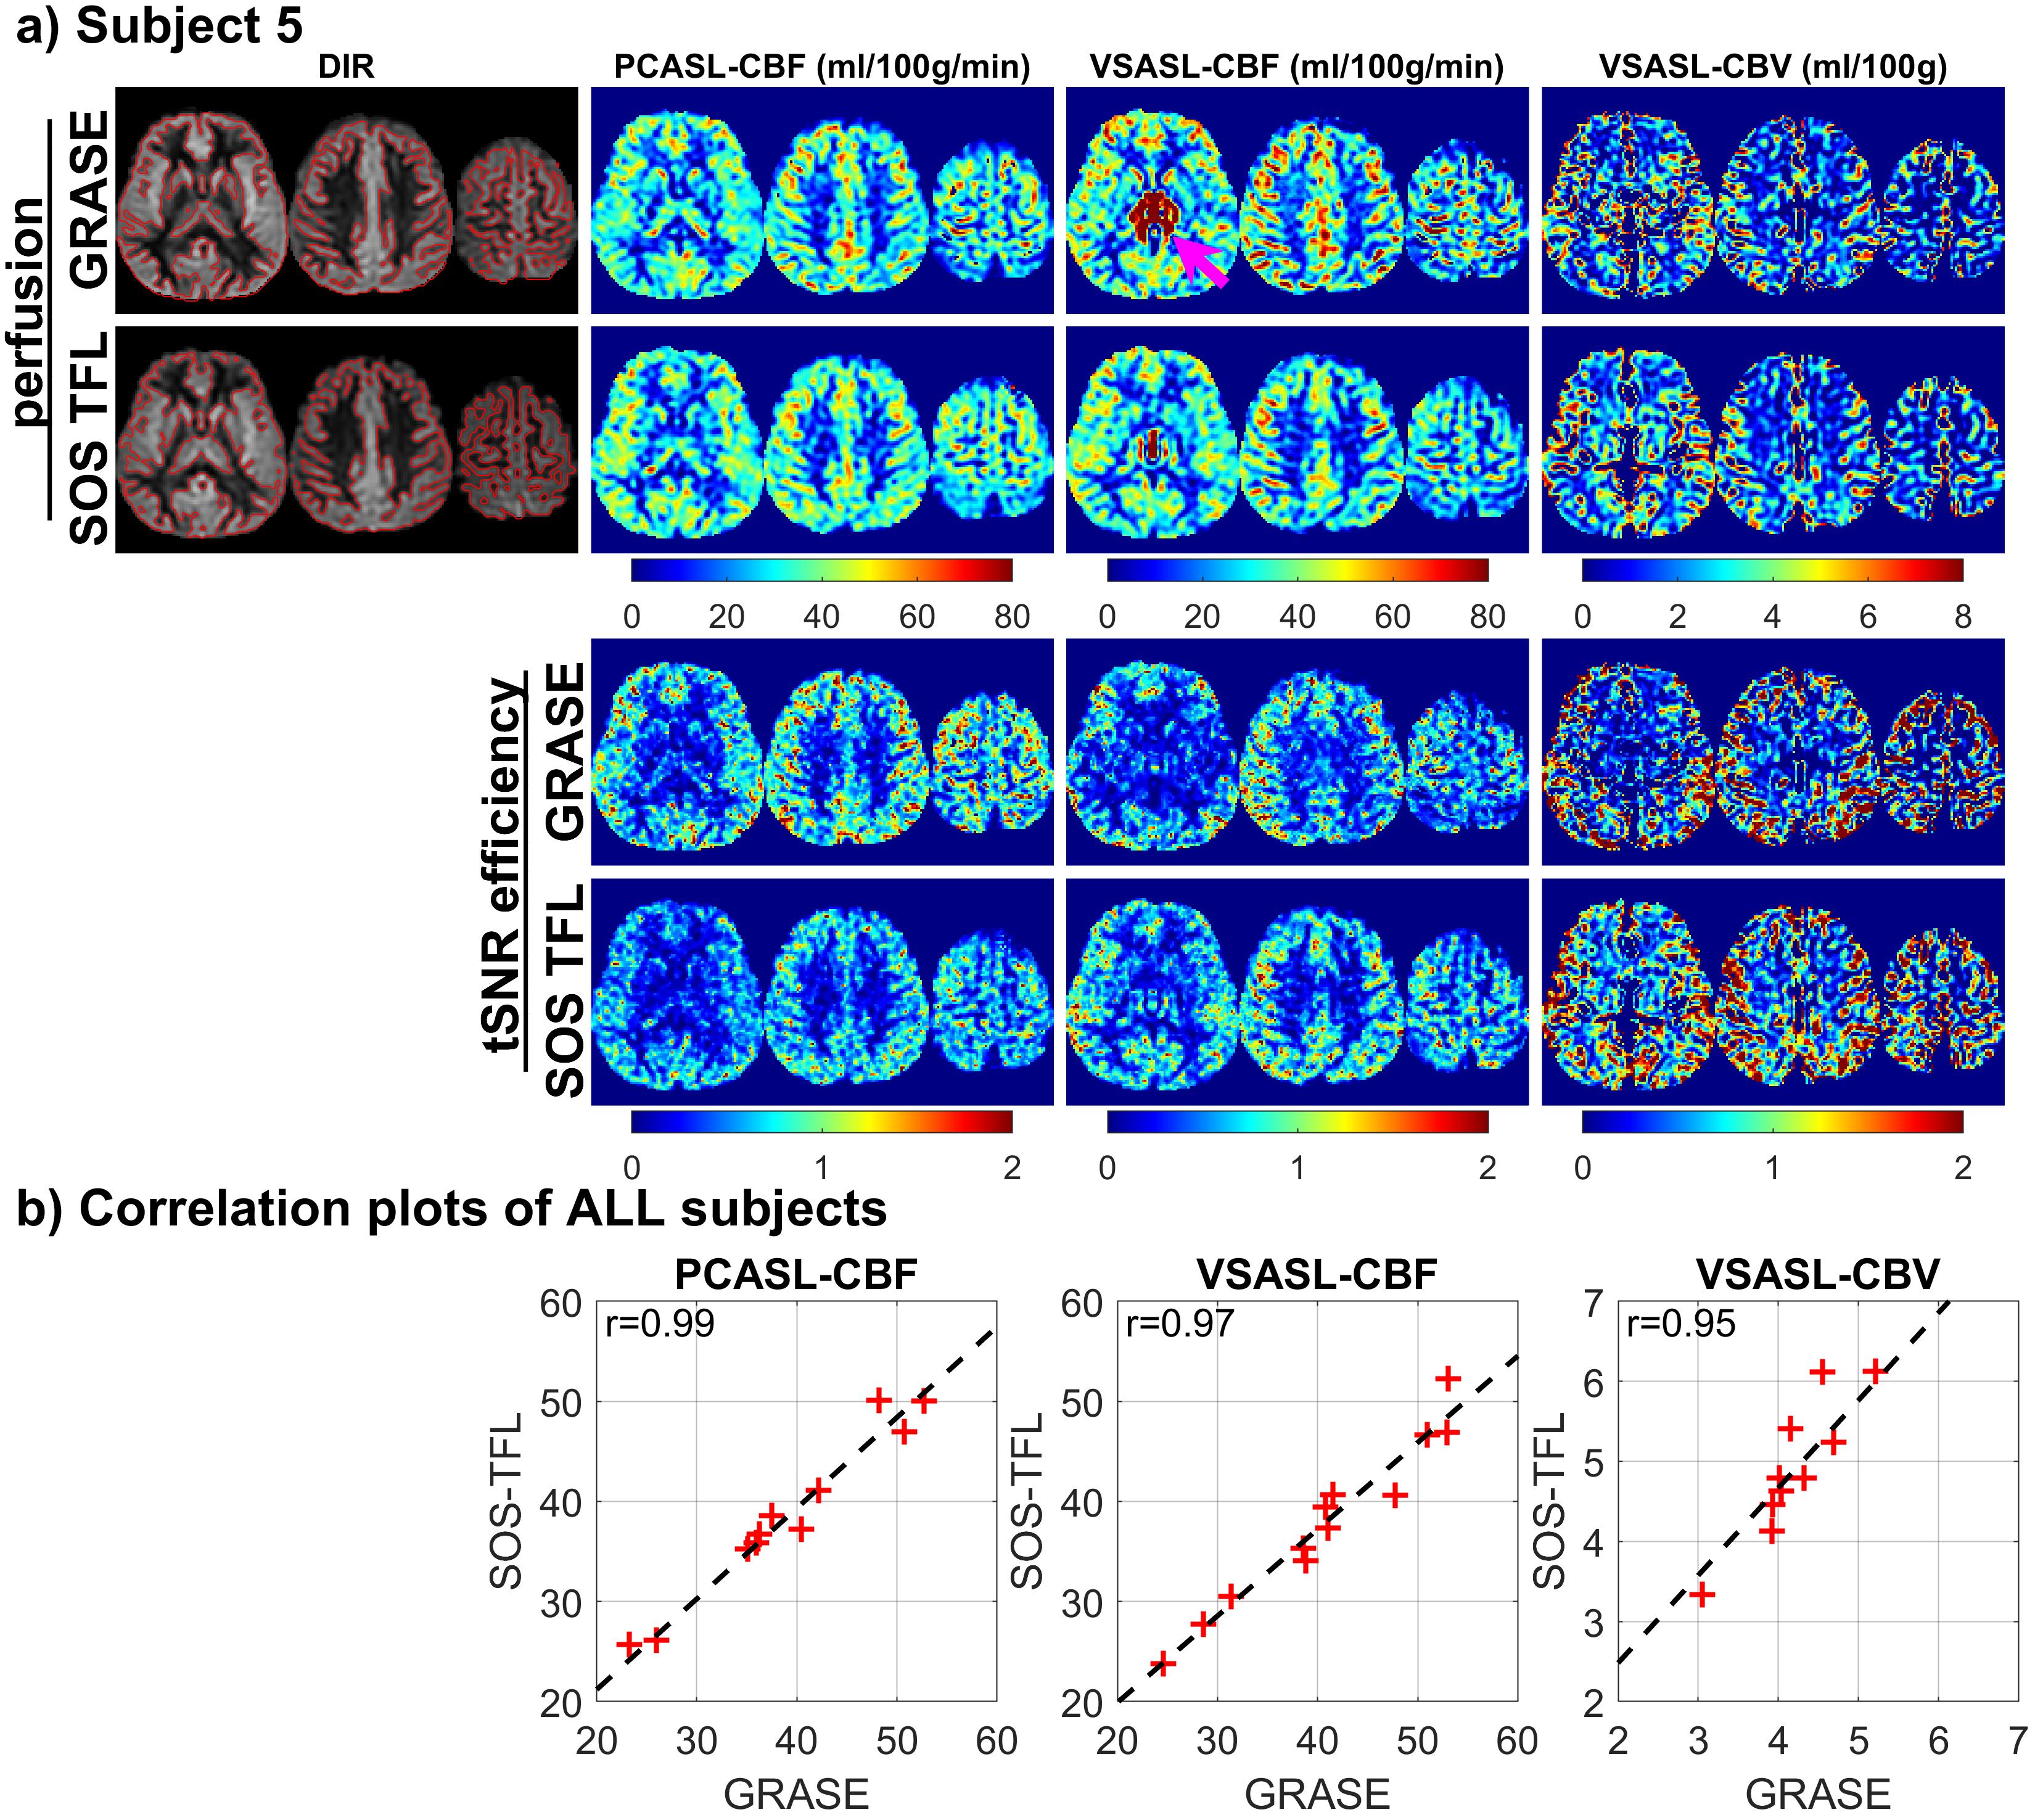
Figure 3:
a) double inversion recovery (DIR), perfusion and temporal SNR (tSNR)
efficiency maps of a representative subject, showing close associations between
3D GRASE and stack-of-spiral turbo FLASH (SOS-TFL) (water excitation, flip angle=15°) for PCASL-CBF, VSASL-CBF, and VSASL-CBV methods, with gray
matter (GM) ROI on DIR images (red contour). SOS-TFL based VSASL-CBF maps have
reduced CSF artifacts compared to GRASE (purple arrow). b) Scatter plots of whole-brain
GM perfusion SOS-TFL and GRASE for 12 subjects, showing high correlation
coefficients (r).
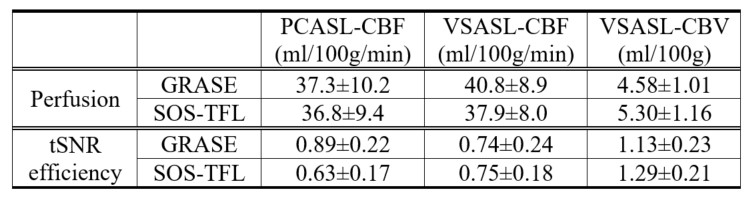
Table 1: Averaged
results of whole-brain gray matter (GM) perfusion and temporal SNR (tSNR)
efficiency of 12 subjects using 3D GRASE and stack-of-spiral turbo FLASH (SOS-TFL)
(water excitation, flip angle=15°) readouts, derived from PCASL-CBF, VSASL-CBF,
and VSASL-CBV methods.
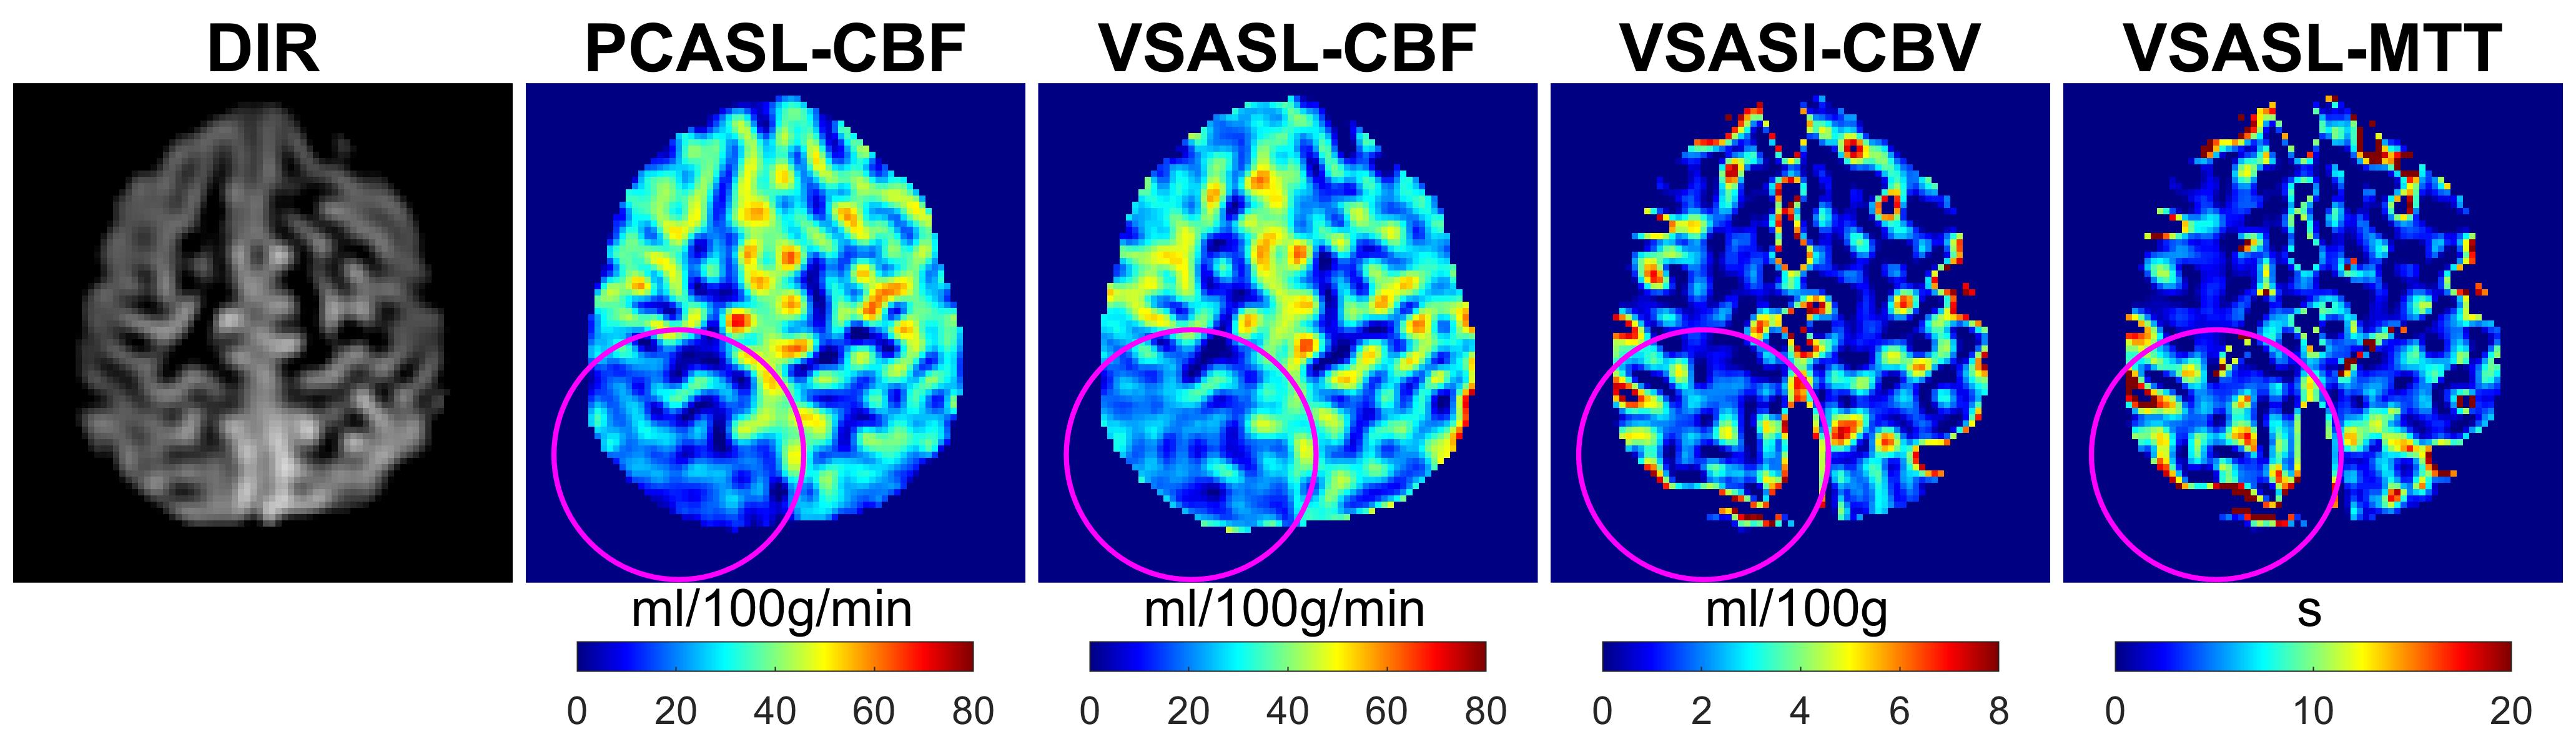
Figure 4: double
inversion recovery (DIR) and perfusion images of a patient 3-months following a
hemorrhagic stroke involving the right dorsal insula and deep gray matter are
shown in Fig.4. Decreased CBF, increased CBV, and prolonged mean transient time
(MTT=CBV/CBF) were observed in the right parietal lobe region distal to the
site of hemorrhage (purple circles).
DOI: https://doi.org/10.58530/2023/2584