2582
Increased Blood-brain Barrier Permeability in Response to Caffeine Challenge
Amnah Mahroo1, Simon Konstandin1,2, Daniel Christopher Hoinkiss1, Jochen Hirsch1, and Matthias Günther1,2,3
1Imaging Physics, Fraunhofer Institute for Digital Medicine MEVIS, Bremen, Germany, 2mediri GmbH, Heidelberg, Germany, 3MR-Imaging and Spectroscopy, University of Bremen, Bremen, Germany
1Imaging Physics, Fraunhofer Institute for Digital Medicine MEVIS, Bremen, Germany, 2mediri GmbH, Heidelberg, Germany, 3MR-Imaging and Spectroscopy, University of Bremen, Bremen, Germany
Synopsis
Keywords: Arterial spin labelling, Brain, Blood-brain Barrier (BBB) Permeability, caffeine, multi-TE ASL
Caffeine is a commonly used stimulant drug and is known to change brain physiology by constricting vessels leading to decreased perfusion. We tested the impact of caffeine ingestion on blood-brain barrier (BBB) permeability by measuring exchange time using multi-TE ASL technique. Six healthy volunteers were examined for five pre-caffeine sets and six post-caffeine sets. The multi-TE two-compartment model was used to estimate exchange time (Tex) along with perfusion and ATT. We found that perfusion and Tex decreased over time while ATT increased. Decreased Tex indicates that the labelled water transferred at a faster rate reflecting increased BBB permeability.Introduction
Caffeine is one of the most widely consumed stimulant drug and is known to perturb brain physiology 1. It is known to act as an antagonist to adenosine receptor and as a result improve vigilance as well as increase neural activity 2. In addition, caffeine blocks neurovascular adenosine receptors which in turn produces vasoconstriction and decreases brain perfusion 3,4. However, the impact of caffeine on the blood-brain barrier (BBB) is not widely studied. Multi-TE ASL offers a non-invasive method for evaluating the integrity of BBB by measuring exchange time (Tex) of the labelled spins. In this study, we investigated an acute effect of caffeine intake on Tex in six healthy humans.Methods
ImagingSix healthy volunteers (ages 28-54 years, 2 females) were examined at 3T (MAGNETOM Vida Fit, Siemens Healthineers AG). Every volunteer was scanned in the morning in the fasting state and was instructed to avoid caffeine for at least 8 hours before the scan.
A combination of single-TE and multi-TE Hadamard pseudo-continuous (pCASL) sequence, implemented in the in-house developed vendor-independent MRI framework gammaSTAR 5,6, with 3D GRASE readout of four-fold acceleration (2x2) and a CAIPIRINHA sampling pattern was used. Two FOCI pulses were used for background suppression of T1 values of 700 ms and 1400 ms. All measurements were acquired with a matrix size of 64x128x32 and a voxel size of 5x5x5 mm3. Two measurements of single-TE Hadamard-8 matrix with a sub-bolus duration of 400 ms and a post-labeling delay (PLD [ms]) of 600 and 800, respectively were acquired (TE[ms]: 13.2, TR[ms]: 4000, scan time: 02:15 min). The resulting two sets of seven TIs [ms] each were [1000, 1400, 1800, 2200, 2400, 3000, 3400] and [1200, 1600, 2000, 2400, 2800, 3200, 3600], respectively. A multi-TE Hadamard-4 matrix with a sub-bolus duration of 1000 ms and a PLD of 500 ms was used. The resulting three TIs [ms] were [1500, 2500, 3500] (TR [ms]: 4500, scan time: 01:55 min) and each TI was acquired at eight different echo times (TE [ms]) [13.8, 41.4, 69, 96.6, 124.2, 151.8, 179.4, 207]. Data from the two protocols was concatenated for fitting. M0 images were acquired in RL and LR phase encoding direction for distortion correction and to quantify perfusion (TE [ms]: 13.2, TR [ms]: 5000, TIs [ms]: 300, 1300, 2300). A T1 MPRAGE was acquired for structural processing. Five sets of baseline pre-caffeine ASL and M0 scans were taken, and each set took 04:50 min. The volunteer was then given a 200 mg caffeine tablet and six sets of post-caffeine ASL and M0 scans were acquired, covering post-caffeine dynamics of ~30 mins.
Post-processing
Data was analyzed with FSL fabber 7 and perfusion, arterial transit time (ATT), and Tex were fitted using the extended two-compartment multi-TE model 8. Mean gray matter values were calculated using a 50 % probability gray matter mask. The parameter maps were registered to structural and MNI 152 standard spaces to compare them within and across the subjects.
Results
Figure 1 shows three TIs of decoded HAD-4 images of one pre-caffeine set and six post-caffeine sets of a representative volunteer. After caffeine intake, all three TIs showed decrease in signal over time. Figure 2 shows fitted parameter maps including quantified perfusion, ATT and Tex of the same volunteer. Dynamic change in the fitted parameters during pre-caffeine and post-caffeine sets is shown in Figure 3. After caffeine intake, perfusion and Tex prominently decreased while ATT increased. Figure 3D shows correlation between perfusion and Tex (r=0.86, p<0.001). Comparing first set of pre-caffeine as a baseline with the last set of post-caffeine (~30 min after caffeine ingestion), perfusion decreased by 25.6%, P = 0.010, Tex decreased by 24.3%, P = 0.012 and ATT increased by 11.1%, P < 0.01 relative to the baseline (fig.4). Table-1 shows mean gray matter parameter values averaged across all subjects for pre-and-post caffeine sets.Discussion
Reduced Tex reflecting increased BBB permeability could be a result of vasoconstrictive effect and modulatory neurotransmitter response of caffeine. With decreased perfusion, increase in BBB permeability could be a compensatory mechanism to maintain the hemodynamics in the brain. Recently, one study using WEPCAST ASL technique reported increased water extraction fraction in brain tissue in response to caffeine intake 9. Along with the extraction fraction, they reported that the permeability surface area product (PS) remains unchanged. In our study, we explicitly measured the exchange time which reflects the transition of labelled spins from blood into the tissue based on change in transverse T2 relaxation the spins experience. Our method is only sensitive to this blood to tissue transition and does not consider the surface area of the vessels. Moreover, considering that BBB permeability increases, and vessel surface area decreases due to vasoconstriction in response to caffeine ingestion, then our results would be consistent with the unchanged PS value found in the WEPCAST-study.Conclusion
In conclusion, we evaluated the effect of caffeine ingestion on BBB permeability by measuring exchange time and found that the BBB permeability increased as a result.Acknowledgements
The DEBBIE project (Developing a non-invasive biomarker for early BBB breakdown in Alzheimer’s disease) is an EU Joint Programme -Neurodegenerative Disease Research (JPND) project. It is supported through the following funding organisations under the aegis of JPND -www.jpnd.eu (FWO in Belgium, Canadian Institutes of Health Research in Canada, BMBF in Germany, NFR in Norway, ZonMw in The Netherlands, TÜBITAK in Turkey). The project has received funding from the European Union’s Horizon 2020 research and innovation programme under grant agreement No. 825664.References
- Sawynok, J., 2011. Caffeine and pain. Pain, 152(4), pp.726-729.
- Xu, F., Liu, P., Pekar, J.J. and Lu, H., 2015. Does acute caffeine ingestion alter brain metabolism in young adults? Neuroimage, 110, pp.39-47.
- Cameron, O.G., Modell, J.G. and Hariharan, M., 1990. Caffeine and human cerebral blood flow: a positron emission tomography study. Life sciences, 47(13), pp.1141-1146.
- Addicott, M.A., et al.,, 2009. The effect of daily caffeine use on cerebral blood flow: How much caffeine can we tolerate?. Human brain mapping, 30(10), pp.3102-3114.
- Cordes, C., Konstandin, S., Porter, D. and Günther, M. (2020). Portable and platform-independent MR pulse sequence programs. Magn. Reson. Med. 83(4), pp.1277–1290.
- https://gamma-star.mevis.fraunhofer.de
- Chappell, M. A., Groves, A. R., Whitcher, B., and Woolrich, M. W. (2008). Variational Bayesian inference for a nonlinear forward model. IEEE Trans. Signal Process. 57, 223–236.
- Mahroo, A., et al., 2021. Robust Multi-TE ASL-Based Blood–Brain Barrier Integrity Measurements. Frontiers in neuroscience, 15.
- Lin, Z., Jiang, D., Liu, P., Ge, Y., Moghekar, A. and Lu, H., 2022. Blood–brain barrier permeability in response to caffeine challenge. Magnetic resonance in medicine, 88(5), pp.2259-2266.
Figures
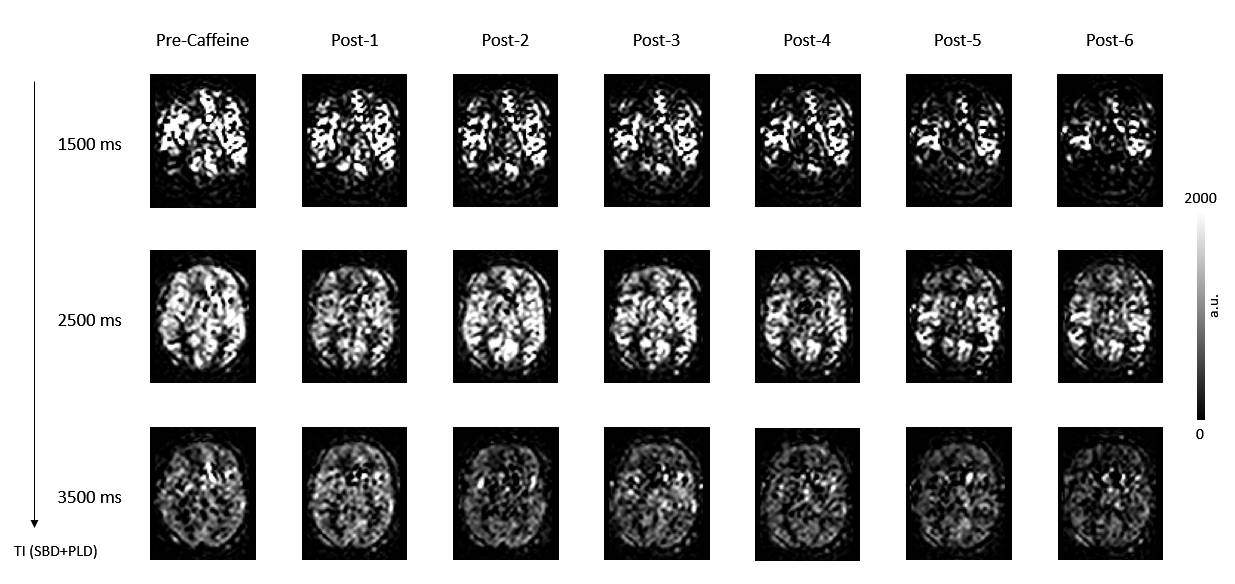
Figure-1: HAD-4 ASL images from one pre-caffeine set
compared with change in signal over time post caffeine ingestion from a
representative volunteer.
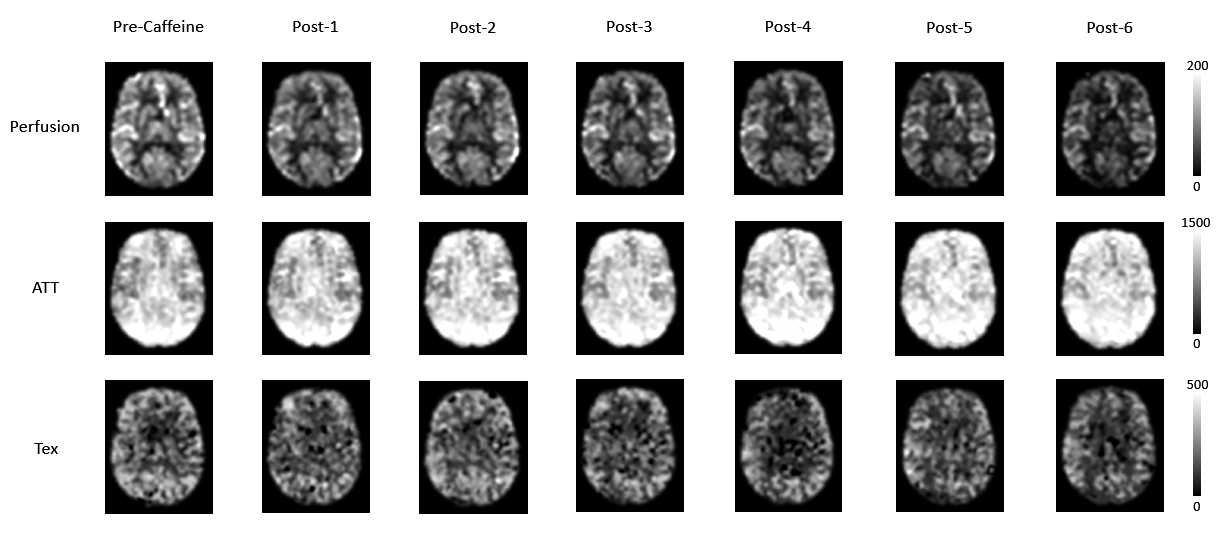
Figure-2: Fitted parameter maps shown for one
pre-caffeine set and six post-caffeine measurements from a representative volunteer.
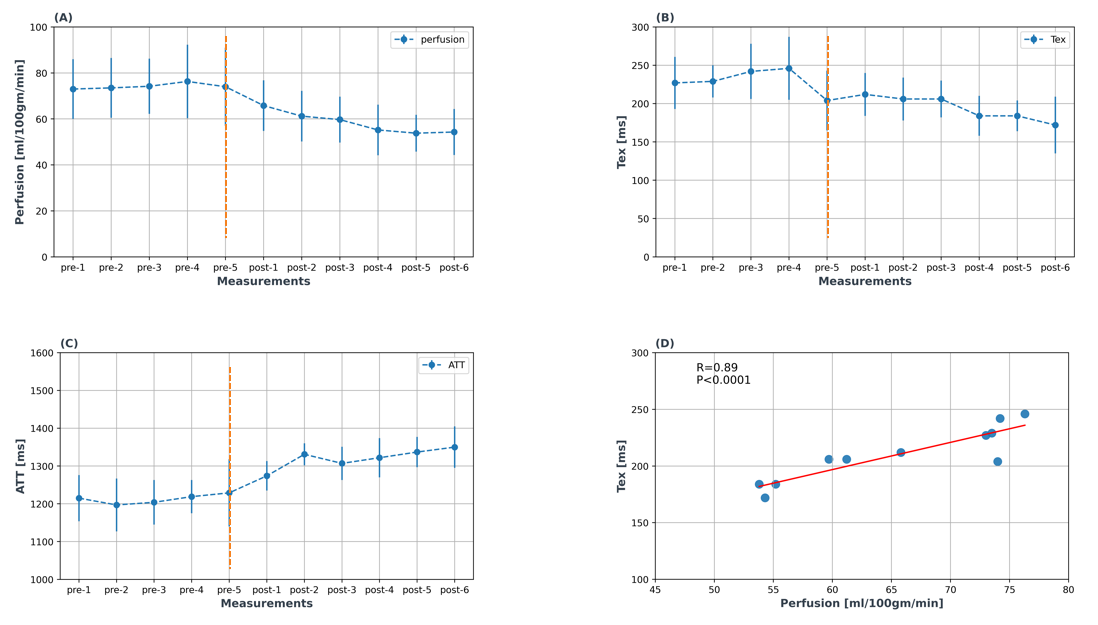
Figure-3: Change in dynamics of
physiological parameters (A) perfusion, (B) Tex, and (C) ATT pre-and-post
caffeine ingestion. Orange dotted line indicates when caffeine was taken. Six
post-caffeine measurements (scan time: 5min, each) were acquired covering a
total of 30 min. Error bars show standard deviation across volunteers. (D)
Correlation plot of averaged perfusion and Tex values (r = 0.89, P <0.001).
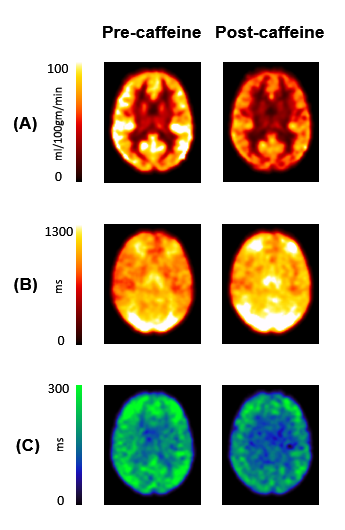
Figure-4: Comparison
of mean parameter maps (A) perfusion, (B) ATT and (C) Tex averaged across all
volunteers at pre-caffeine (pre-1) and post-caffeine (post-6) states.
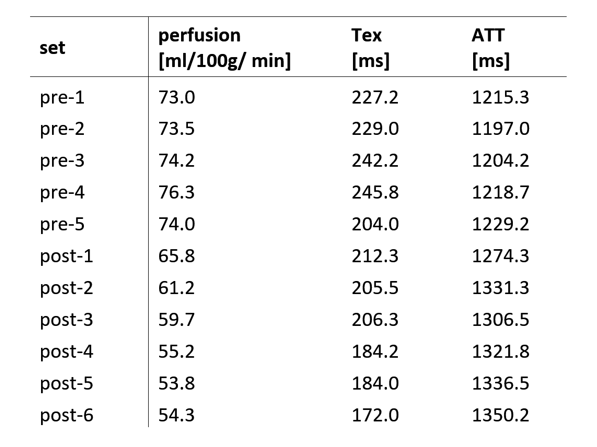
Table-1: Mean gray matter values of parameters pre-and-post caffeine measurements averaged across volunteers.
DOI: https://doi.org/10.58530/2023/2582