2581
Detectability of changes in the blood-brain barrier permeability to water using optimised multi-TE pseudo-continuous arterial spin labelling1Sir Peter Mansfield Imaging Centre and Mental Health & Clinical Neurosciences, School of Medicine, University of Nottingham, Nottingham, United Kingdom, 2Institute of Biomedical Engineering, Department of Engineering Science, University of Oxford, Oxford, United Kingdom, 3Wellcome Centre for Integrative Neuroimaging, FMRIB, Nuffield Department of Clinical Neurosciences, University of Oxford, Oxford, United Kingdom
Synopsis
Keywords: Arterial spin labelling, Arterial spin labelling
The blood-brain barrier integrity can be reflected by the pre-exchange lifetime of water molecules, Tex, which can be measured using multi-TE multi-delay ASL. Nevertheless, the low SNR of ASL limits the detectability of subtle Tex changes within a feasible scan time for clinical applications. In this study, optimised protocols were evaluated for the theoretical detectability of 10% changes in haemodynamic parameters. Simulation shows that while changes in CBF and arterial transit time (ATT) could be detected on individual level in a five-minute scan, the same detectability of Tex would require a minimum of 6 subjects within ten minutes of scanning.Introduction
The pre-exchange lifetime of water molecules across the blood-brain barrier (BBB), Tex, can be used as a surrogate measure for BBB integrity, where changes in the BBB permeability are associated with many cerebrovascular diseases1-3. Multi-TE pseudo-continuous arterial spin labelling (pCASL) with multiple post-labelling delays (PLD) is a non-invasive MRI approach that could quantitatively measure cerebral haemodynamic parameters, such as CBF, arterial transit time (ATT) and Tex4-7. However, the detection of subtle changes in such parameters (e.g., 10% change) within a clinically-desirable scan time has been challenging due to the intrinsically low SNR of the ASL technique. In this study, we obtained protocols with optimised PLD and TE timings aimed for improved estimation accuracy of the parameters, and evaluated the detectability of subtle changes in the parameters in an individual based on simulation.Methods
OptimisationOptimisation of PLDs and TEs was achieved using a general optimisation framework for ASL experiments, which is based on maximising the Fisher Information Matrix (FIM) to minimise the parameter variance specified by Cramer-Rao Lower Bound8. The parameters of interest in the optimisation were $$$\boldsymbol{\theta}=\{CBF,ATT,Tex\}$$$. The sensitivity function of each parameter was derived using a two-compartment kinetic model separating the IV and EV signal contributions9.
By changing the weightings on each parameter, four optimality criteria were developed: CBFopt, ATTopt, and Texopt, which were optimised for the estimation of a specific parameter while treating others as confounds, as well as ALLopt that was optimised for the average of all three parameters. To maintain the SNR of each PLD, the number of repeats of optimised protocols was fixed to 2. Under each optimality criterion, the optimisation was performed with numbers of PLDs ($$$nPLD$$$) ranging from 10 to 40, with higher $$$nPLD$$$ leading to longer total scan time, resulting in a total of 143 optimised protocols for evaluation.
Evaluation
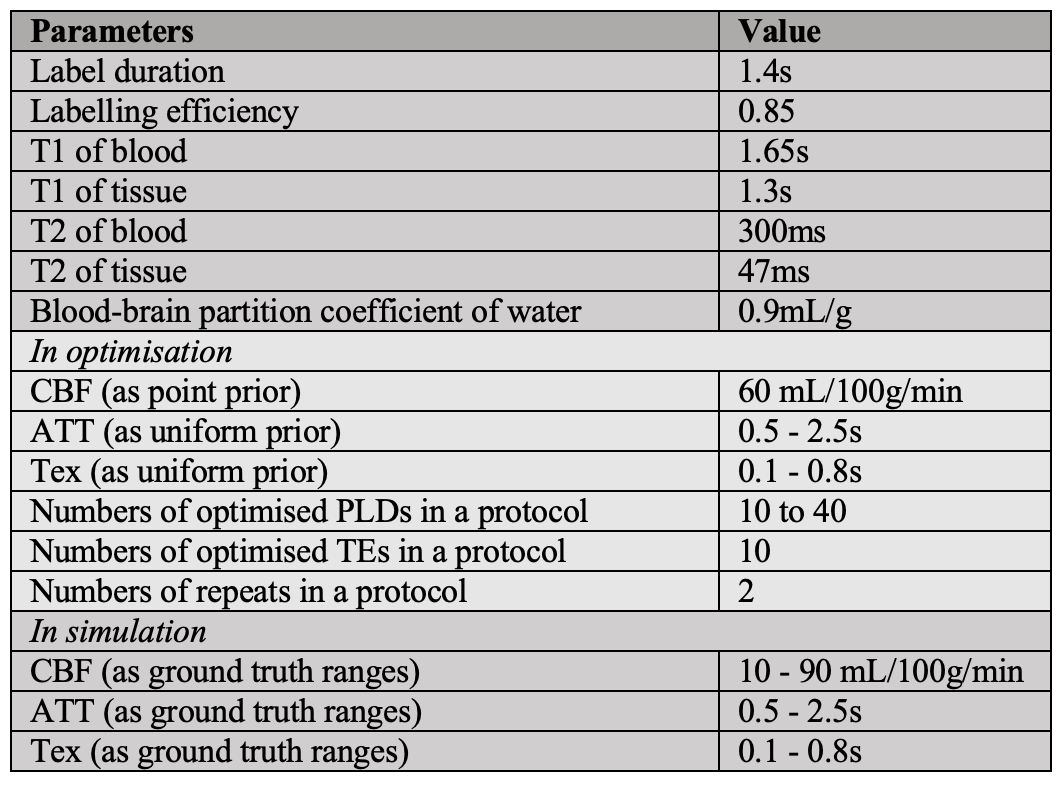
The evaluation aimed to investigate the theoretical detectability of parameter changes by the optimised protocols. PCASL signals using the two-compartment model were simulated and added white noise to achieve a typical SNR of 5. The parameters used in optimisation and simulation are listed in Table 1. The signals were fitted with the same kinetic models used in optimisation by two methods: nlinfit function in MATLAB (The MathWorks, Natick, MA) in a non-linear least squares (NLLS) fashion, and FSL’s fabber_asl tool using Bayesian Inference (FABBER). Estimation standard deviation ($$$\sigma$$$) of CBF, ATT and Tex were obtained over 1000 simulations at each ground truth value. The detectability of each protocol was indicated by the subject sample size ($$$N$$$) required to detect a parameter change ($$$\Delta$$$)10, which was set to 10% of the ground truth values in this study. $$$N$$$ was calculated by the equation $$N=\frac{2\sigma^2(Z_{1-\alpha}+Z_{1-\beta})}{\Delta^2}$$ where $$$Z_{1-\alpha}$$$ and $$$Z_{1-\beta}$$$ are the z-score at confidence level ($$$1-\alpha$$$) and power $$$\beta$$$. At 95% confidence level and 80% power, $$$Z_{1-\alpha}=1.645$$$ and $$$Z_{1-\beta}=0.84$$$.
Results and Discussion
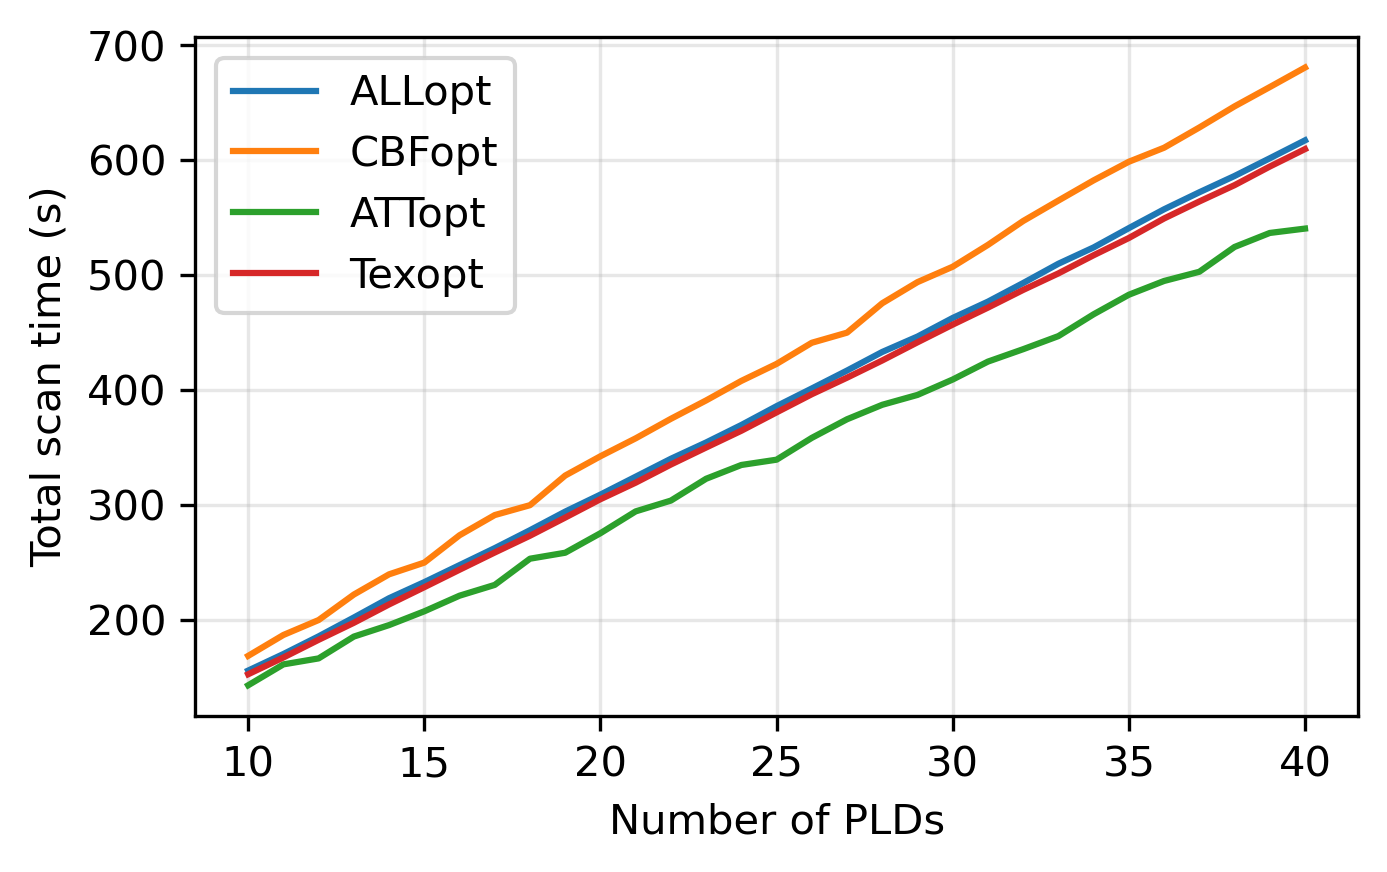
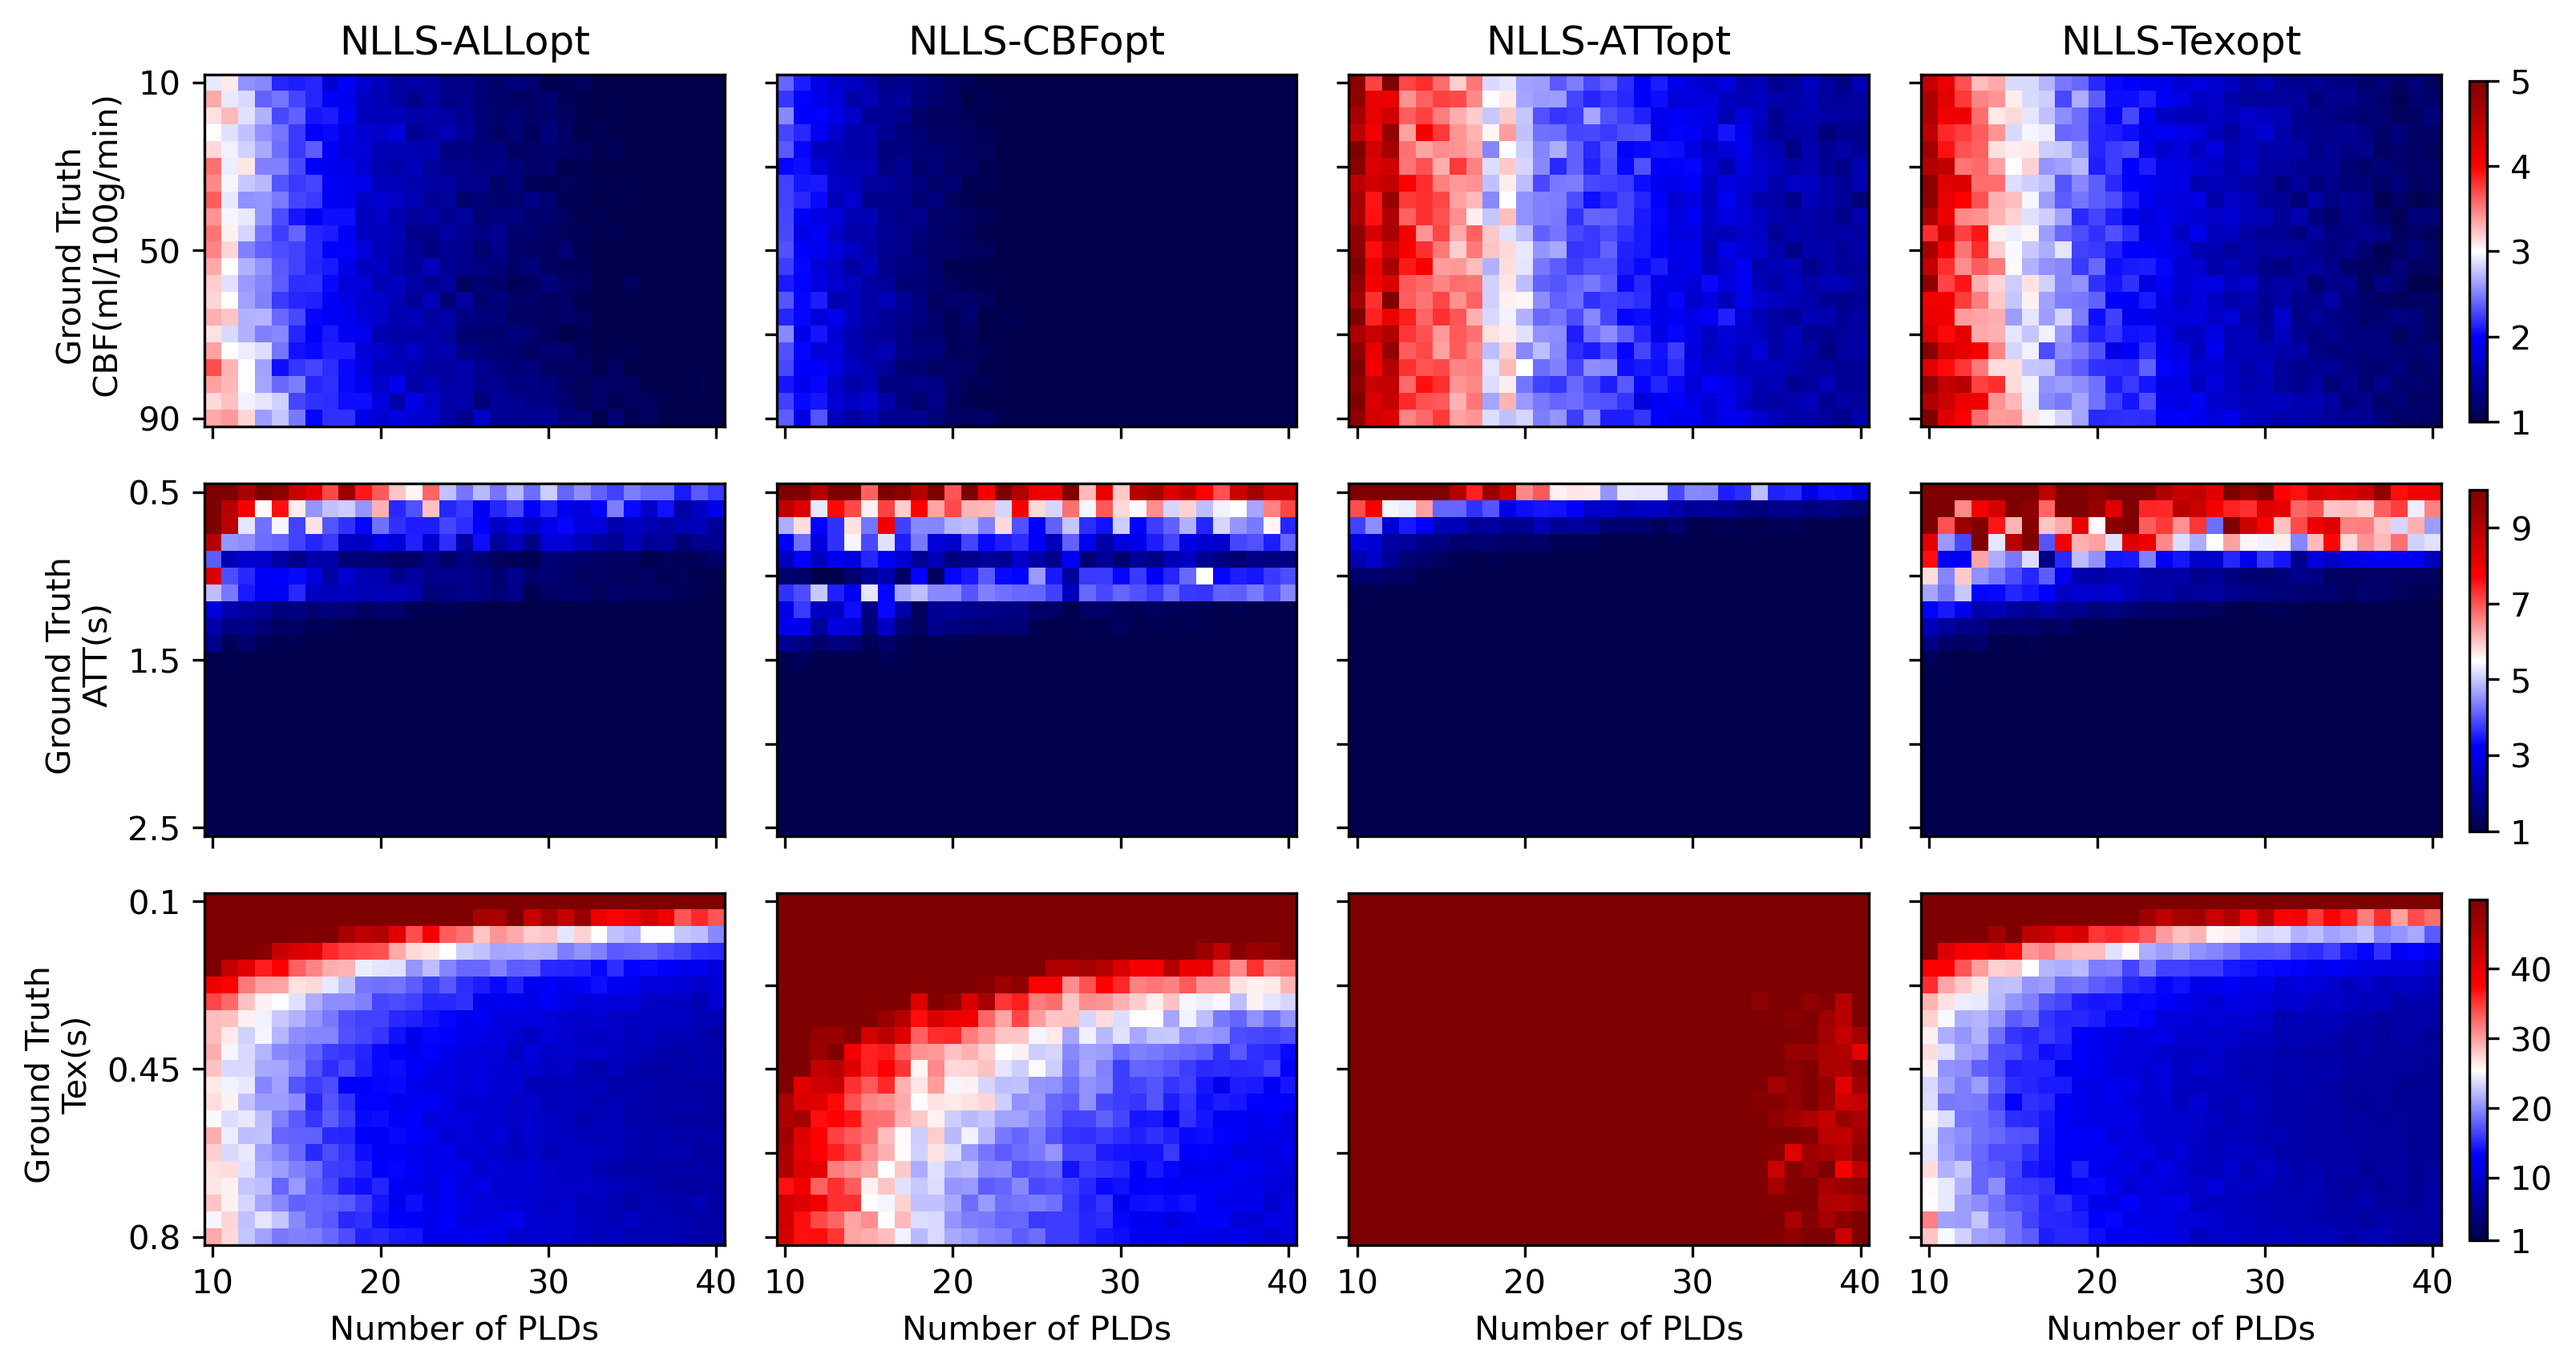
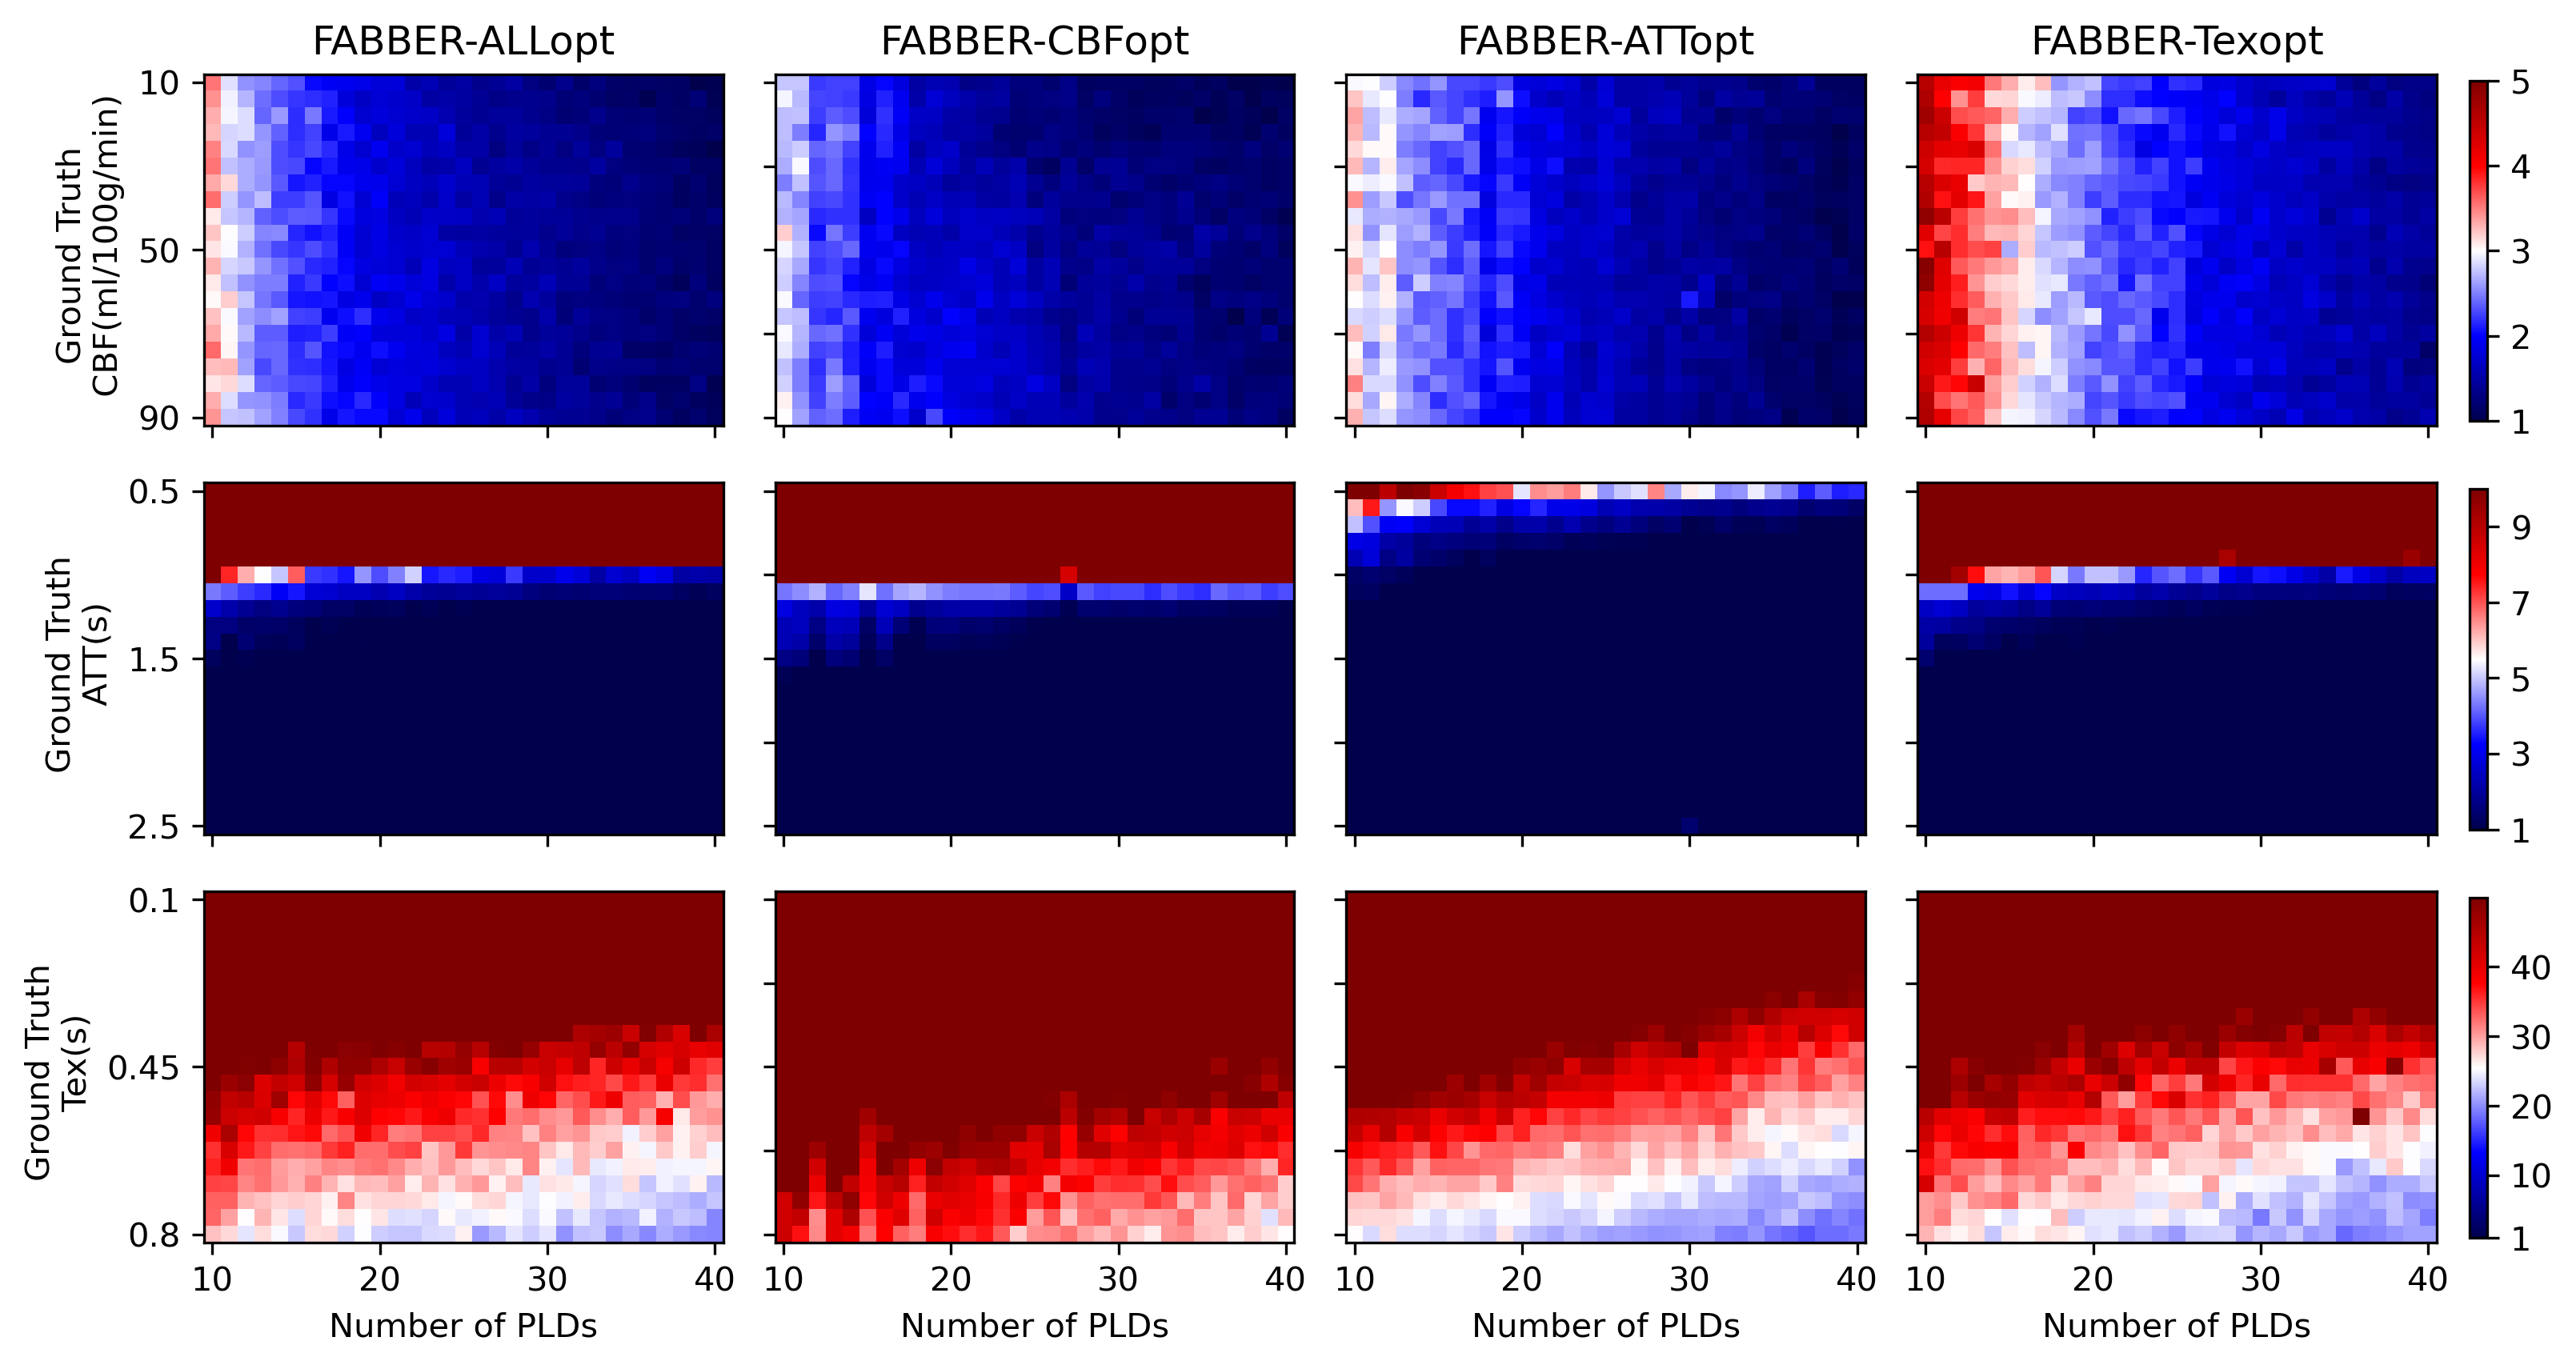
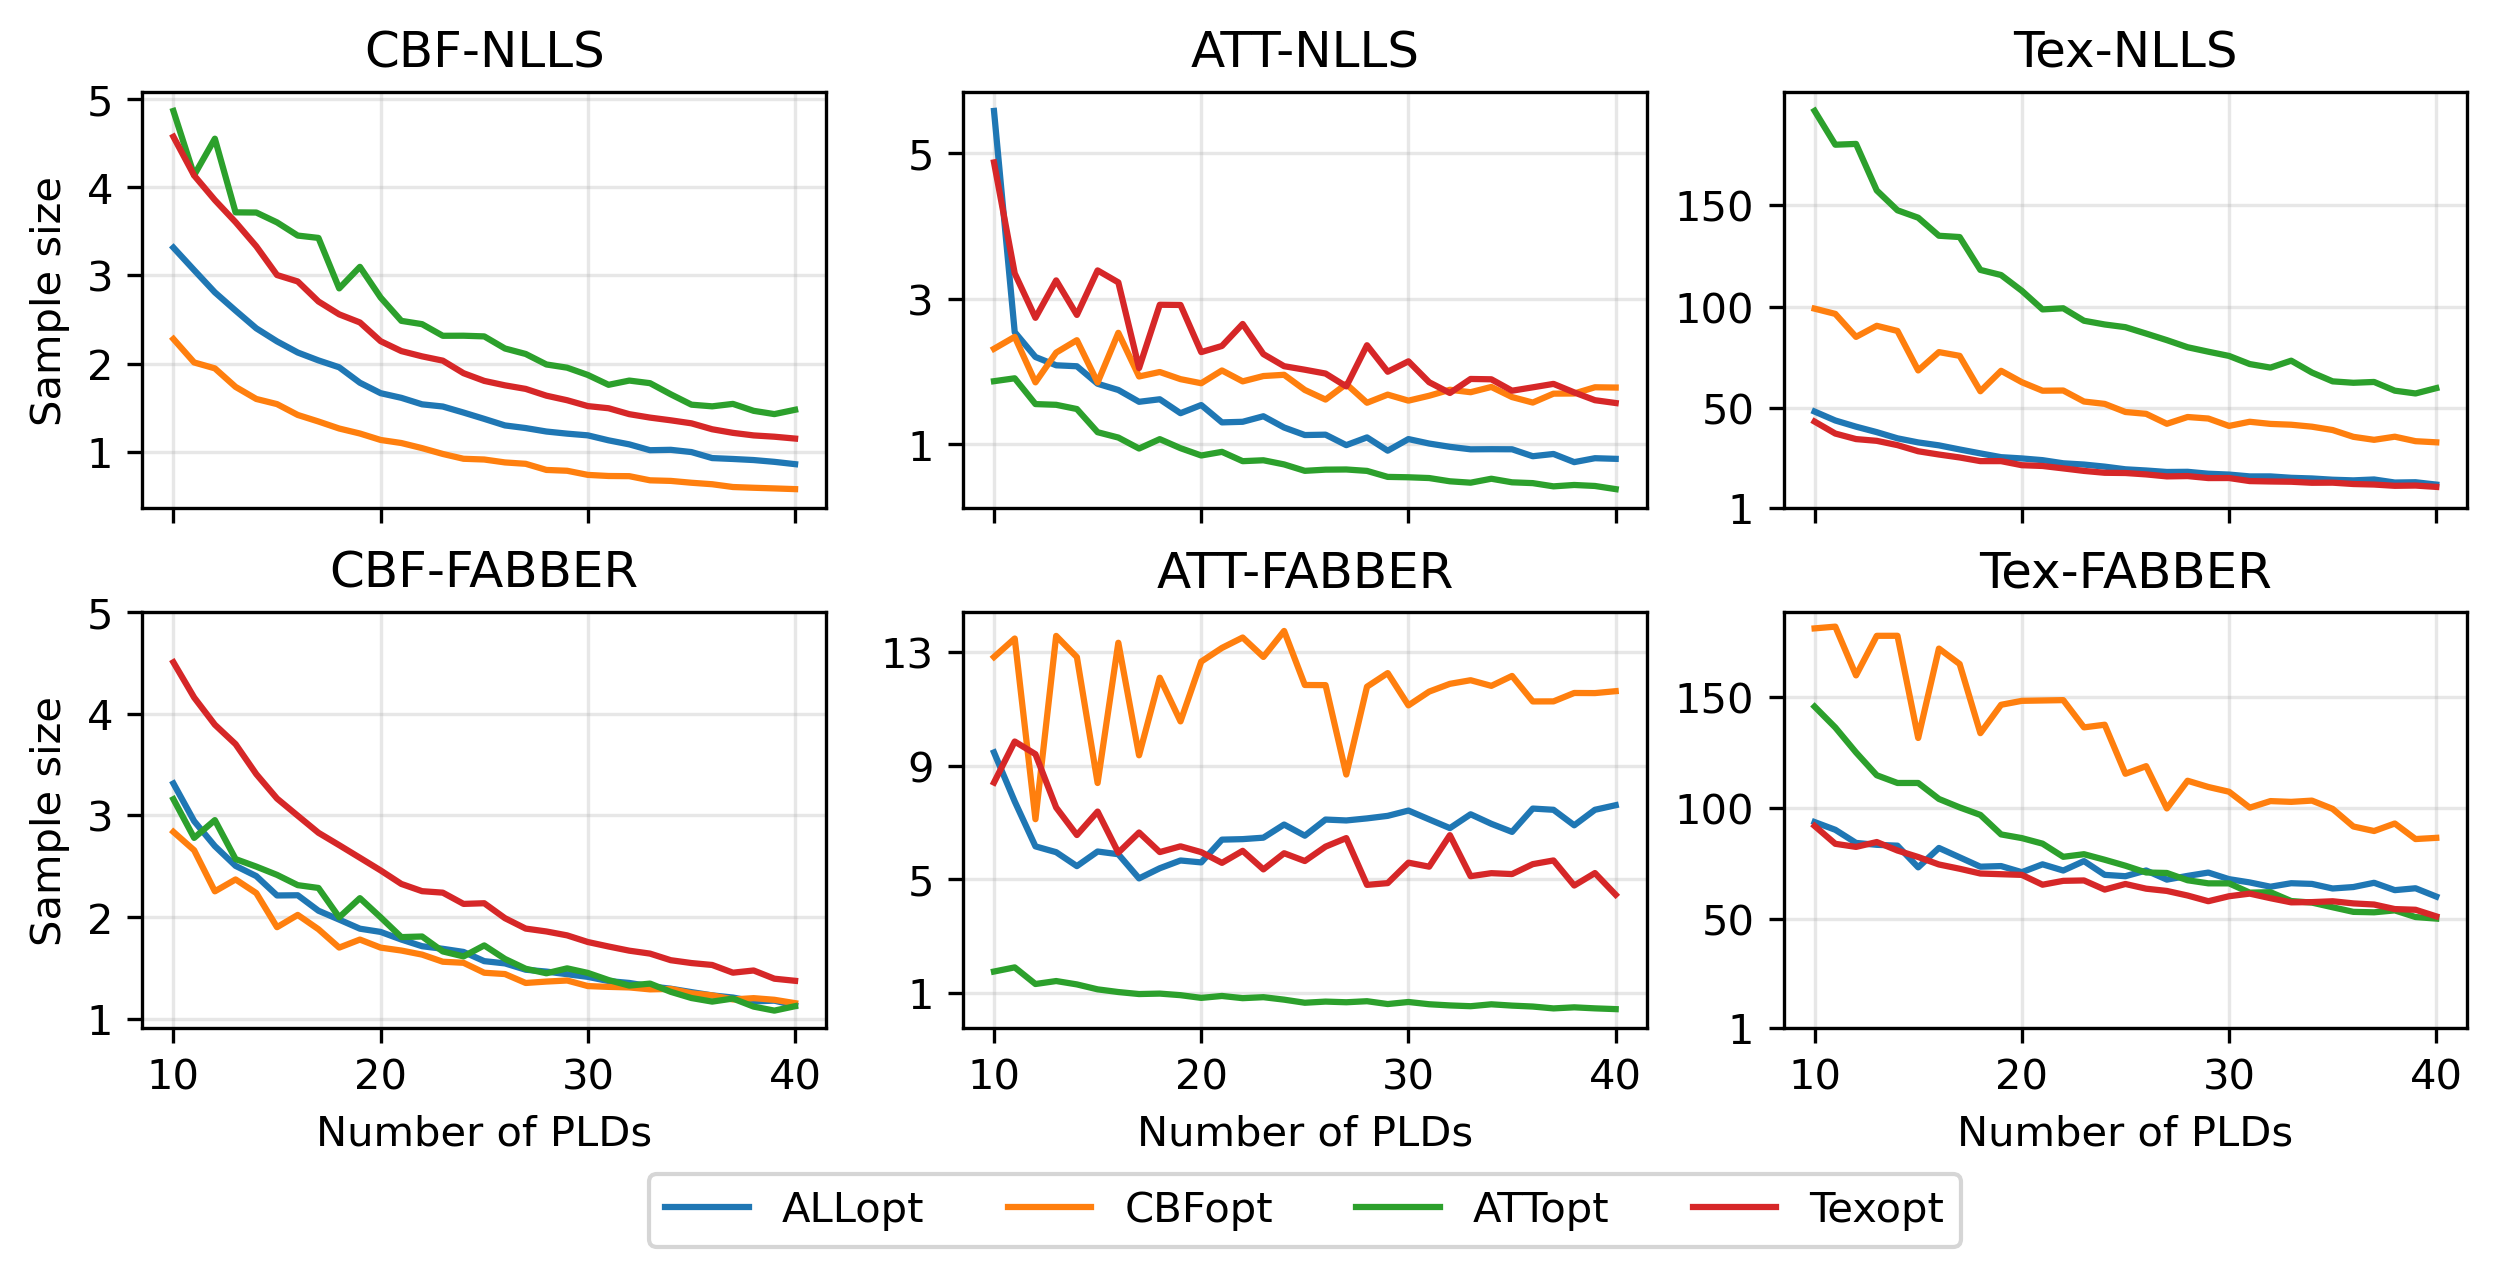
The relationship between $$$nPLD$$$ and the total scan time of each protocol under four optimality criteria is shown in Figure 1. When $$$nPLD$$$ was fixed, CBFopt had the longest scan time and ATTopt the shortest due to the distribution of longer and shorter PLDs required for optimal CBF and ATT estimation accuracy, respectively, consistent with previous findings8.Figure 2 and 3 show the sample size ($$$N$$$) required to detect a 10% change in each ground truth CBF, ATT, and Tex value with 95% confidence and 80% power, when the signal is fitted with NLLS and FABBER models, respectively. For ATT and Tex, detectability improved with higher ground truth values, due to a larger change in absolute values. The ability to detect 10% changes in CBF and ATT across most of the ground truth values was down to individual level ($$$N\le{1}$$$) by CBFopt and ATTopt protocols, respectively, when $$$nPLD\gt{20}$$$, which was around 5 minutes of scanning. However, a minimum group of 6 subjects was needed to detect a 10% change in Tex within 10 minutes of scan time by Texopt protocols, when ground truth Tex was above 0.3s, a typical value for grey matter in literature9. This demonstrated the challenge of accurately estimating for and detecting subtle changes in Tex in an individual. Comparing the two fitting methods, NLLS appeared to have higher detectability (lower $$$N$$$) for ALLopt, CBFopt, and Texopt protocols, while FABBER had higher detectability for protocols under the ATTopt criterion.
Figure 4 shows the minimum sample size averaged over the ground truth ranges of CBF, ATT and Tex as a function of $$$nPLD$$$. Although CBFopt, ATTopt, and Texopt had the highest sensitivity to detect a change in the corresponding parameter, the trade-off of losing detectability on other parameters was high. Protocols under the ALLopt criterion, which balanced the estimation of all three parameters, could offer an intermediate level of detection.
Conclusion
Optimised pCASL protocols were obtained with variable numbers of PLDs, and were evaluated for their detectability of 10% change in three haemodynamic parameters. Simulation showed that while CBFopt and ATTopt protocols could achieve such detection in CBF and ATT in an individual with 95% confidence and 80% power in a five-minute scan, Texopt protocols would require at least 6 subjects with 10 minutes of scanning to have the same detectability of Tex changes.Acknowledgements
This work received funding from the Engineering and Physical Sciences Research Council (EP/P012361/1).References
1. Kassner A, Merali Z. Assessment of Blood–Brain Barrier Disruption in Stroke. Stroke. 2015;46(11):3310-3315.
2. Minagar A, Alexander JS. Blood-brain barrier disruption in multiple sclerosis. Multiple Sclerosis. 2003;9(6):540-549.
3. Desai BS, Monahan AJ, Carvey PM, Hendey B. Blood-Brain Barrier Pathology in Alzheimer’s and Parkinson’s Disease: Implications for Drug Therapy. Cell Transplant. 2007;16:285-299.
4. Wells JA, Siow B, Lythgoe MF, Thomas DL. Measuring Biexponential Transverse Relaxation of the ASL Signal at 9.4 T to Estimate Arterial Oxygen Saturation and the Time of Exchange of Labeled Blood Water into Cortical Brain Tissue. Journal of Cerebral Blood Flow & Metabolism. 2013;33(2):215-224.
5. Ohene Y, Harrison IF, Nahavandi P, et al. Non-invasive MRI of brain clearance pathways using multiple echo time arterial spin labelling: an aquaporin-4 study. Neuroimage. 2019;188:515-523.
6. Ohene Y, Harrison IF, Evans PG, Thomas DL, Lythgoe MF, Wells JA. Increased blood–brain barrier permeability to water in the aging brain detected using noninvasive multi-TE ASL MRI. Magn Reson Med. 2021;85(1):326-333.
7. Petitclerc L, Schmid S, Hirschler L, van Osch MJP. Combining T2 measurements and crusher gradients into a single ASL sequence for comparison of the measurement of water transport across the blood–brain barrier. Magn Reson Med. 2021;85(5):2649-2660.
8. Woods JG, Chappell MA, Okell TW. A general framework for optimizing arterial spin labeling MRI experiments. Magn Reson Med. 2019;81(4):2474-2488.
9. Gregori J, Schuff N, Kern R, Günther M. T2-based arterial spin labeling measurements of blood to tissue water transfer in human brain. Journal of Magnetic Resonance Imaging. 2013;37(2):332-342.
10. Lahiri A, Fessler JA, Hernandez-Garcia L. Optimizing MRF-ASL scan design for precise quantification of brain hemodynamics using neural network regression. Magn Reson Med. 2020;83(6):1979-1991.
Figures