2578
DSC-MRI and ASL-MRI Measured Perfusion in Glioblastoma: Are they Competitive or Complementary?1Department of Radiology, University of Texas Southwestern Medical Center, DALLAS, TX, United States, 2Philips Healthcare, Shanghai, China, 3Advanced Imaging Research Center, University of Texas Southwestern Medical Center, DALLAS, TX, United States, 4Department of Neurology, University of Texas Southwestern Medical Center, DALLAS, TX, United States, 5Department of Hematology and Oncology, University of Texas Southwestern Medical Center, DALLAS, TX, United States
Synopsis
Keywords: Arterial spin labelling, Perfusion, Dynamic susceptibility contrast (DSC), Brain, Cancer, Glioblastoma (GBM)
Introduction
Perfusion-weighted MR imaging (PW-MRI), specifically using dynamic susceptibility contrast (DSC) is routinely performed to measure tumor vascularity. However, DSC requires exogenous contrast and the quantitative measurements from DSC-MRI are sensitive to mathematical modeling. Arterial spin labeled (ASL) MRI, which uses water as an endogenous tracer to measure tissue perfusion, serves as an alternative imaging method. Extensive investigations compared ASL with DSC, showing good correlations among different neurological conditions.(1-3) However, the relationship between ASL and DSC-MRI in the setting of patients with glioblastoma (GBM) undergoing chemoradiation therapy remains unclear. Thus, the goal of this study was to evaluate whether ASL-MRI is competitive or complementary to DSC-MRI measured perfusion in GBM patients.Methods
Subjects: Under IRB approval, 20 newly diagnosed GBM patients (mean age: 59±14 years) scheduled to undergo chemoradiation (CRT) therapy were recruited for MR imaging before, during, and after CRT. All patients were imaged on a 3T MR scanner (Ingenia, Philips Healthcare) for a total of 78 imaging sessions (Figure 1A).Image acquisition: All imaging was performed with a 32-channel head coil. In each imaging session, routine clinical imaging protocol (including DSC) was performed with two additional ASL sequences for each subject. DSC scans were acquired with EPI sequence using the recommended Brain Tumor Imaging Protocol (BTIP) (4): TR/TE = 1757/30 ms, FA=30˚, EPI factor = 49, SENSE factor 2.3, a total of 120 dynamic volumes (acquisition time = 2:26 minutes) obtained with a bolus injection of contrast agent (Gadobutrol, 0.1 mmol/kg at 2/3rd dose) at the end of 50th dynamic scan. Prior to DSC acquisition, 1/3rd dose of Gaobutrol was administered for a dynamic contrast-enhanced (DCE) acquisition, which also served as the preload for DSC acquisition. ASL scans were acquired with the following parameters for two different readouts: label duration (LD)/post-label delay (PLD) = 1.8/1.8 s, 4 background suppression pulses and 5 inflow saturation pulses. For TSE based Cartesian Acquisition with Spiral Profile Reordering (CASPR) readout: TR/TE = 6000/14 ms, echo spacing = 2.8 ms, TSE factor = 80, 1 repetition and acquisition time = 3:10 minutes. A M0 image was acquired using the same acquisition parameters in 1:30 minutes. For GRASE: TR/TE = 3955/14 ms, TSE factor = 19, EPI factor = 15, echo spacing = 14.1 ms, 3 repetitions and acquisition time = 4:37 minutes (including the M0). The two readouts had similar acquisition time.
Image analysis: The entire processing pipeline followed the schematic shown in Figure 1B. DSC cerebral blood flow (CBF) and cerebral blood volume (CBV) maps were reconstructed on the scanner without leakage correction, while ASL CBF maps were calculated in MATLAB following the recommendations of ASL consensus paper (5). All maps were converted to NIfTI followed by co-registration to T1 post contrast images. Regions of interest (ROIs) were manually drawn by an experienced radiologist (M. P.).
Results and Discussion
Among all manual segmentations, enhancing tumor (ET) and tumor core (TC) were used to extract mean cerebral blood flow (CBF) values. Mean CBF within ET and TC showed good correlation between ASL-GRASE and ASL-CASPR, although ASL-GRASE did have more variation than ASL-CASPR (Figures 2A & 2B). Since the only difference between these two ASL variants was readout, they can serve as a reference for competitive relationship. The scatter plot (Figure 2C) and linear regression (Figure 2D) between DSC and ASL-CASPR showed a relatively larger deviation from the diagonal, indicating more complicated relationship.We observed both competitive (Figure 3) and complementary (Figure 4) relationships between ASL and DSC. In the competitive example (Figure 3), both ASL and DSC were able to delineate the tumor well, although DSC was prone to contamination of signal from large vessels and some image distortion due to B0 inhomogeneity. In a complementary example on the other hand (Figure 4), both ASL and DSC delineated tumor well for some lesions (yellow arrow) but exhibited differences in other lesions. For example, ASL showed increased contrast in some lesions (red arrow), while exhibiting lower contrast in other lesions (blue arrow) compared to DSC. It would be clinically valuable to know the exact proportion of each relationship between ASL and DSC. Figure 5 shows the detailed information about the competitive or complementary information between these two perfusion imaging techniques for each specific MR scan.
DSC CBF maps were used for comparison in our preliminary analysis instead of CBV maps since they are compared to single-delay ASL that also generates CBF. However, this should not influence our results as both DSC CBF and CBV maps were carefully compared with each other and both maps showed similar hyper-perfusion regions for tumor delineation.
Conclusion
ASL was competitive to DSC in over 90% of the MR scans and in over 90% of the competitive cases, ASL was either equivalent or superior to DSC, which could make ASL a very attractive alternative to DSC in GBM patients. In some cases (less than 10%), however, ASL and DSC were complementary to each other and combining them together could generate a more comprehensive evaluation of the whole tumor.Acknowledgements
This work was supported by NIH/NCI grant U01CA207091. The authors thank Kelli Key, PhD, Abey Thomas, RT(MR), Courtney Dawson, RT(MR), Michael Fulkerson, AS, LVN, Sydney Haldeman, MPH for their help in human imaging, and Ben Wagner, MSEE, for his help with image database and analysis routines.References
1. Wong AM, Yan FX, Liu HL. Comparison of three-dimensional pseudo-continuous arterial spin labeling perfusion imaging with gradient-echo and spin-echo dynamic susceptibility contrast MRI. J Magn Reson Imaging. 2014;39(2):427-33.
2. White CM, Pope WB, Zaw T, Qiao J, Naeini KM, Lai A, et al. Regional and voxel-wise comparisons of blood flow measurements between dynamic susceptibility contrast magnetic resonance imaging (DSC-MRI) and arterial spin labeling (ASL) in brain tumors. J Neuroimaging. 2014;24(1):23-30.
3. Novak J, Withey SB, Lateef S, MacPherson L, Pinkey B, Peet AC. A comparison of pseudo-continuous arterial spin labelling and dynamic susceptibility contrast MRI with and without contrast agent leakage correction in paediatric brain tumours. Br J Radiol. 2019;92(1094):20170872.
4. Ellingson BM, Bendszus M, Boxerman J, Barboriak D, Erickson BJ, Smits M, et al. Consensus recommendations for a standardized Brain Tumor Imaging Protocol in clinical trials. Neuro Oncol. 2015;17(9):1188-98.
5. Alsop DC, Detre JA, Golay X, Gunther M, Hendrikse J, Hernandez-Garcia L, et al. Recommended Implementation of Arterial Spin-Labeled Perfusion MRI for Clinical Applications: A Consensus of the ISMRM Perfusion Study Group and the European Consortium for ASL in Dementia. Magn Reson Med. 2015;73(1):102-16.
Figures
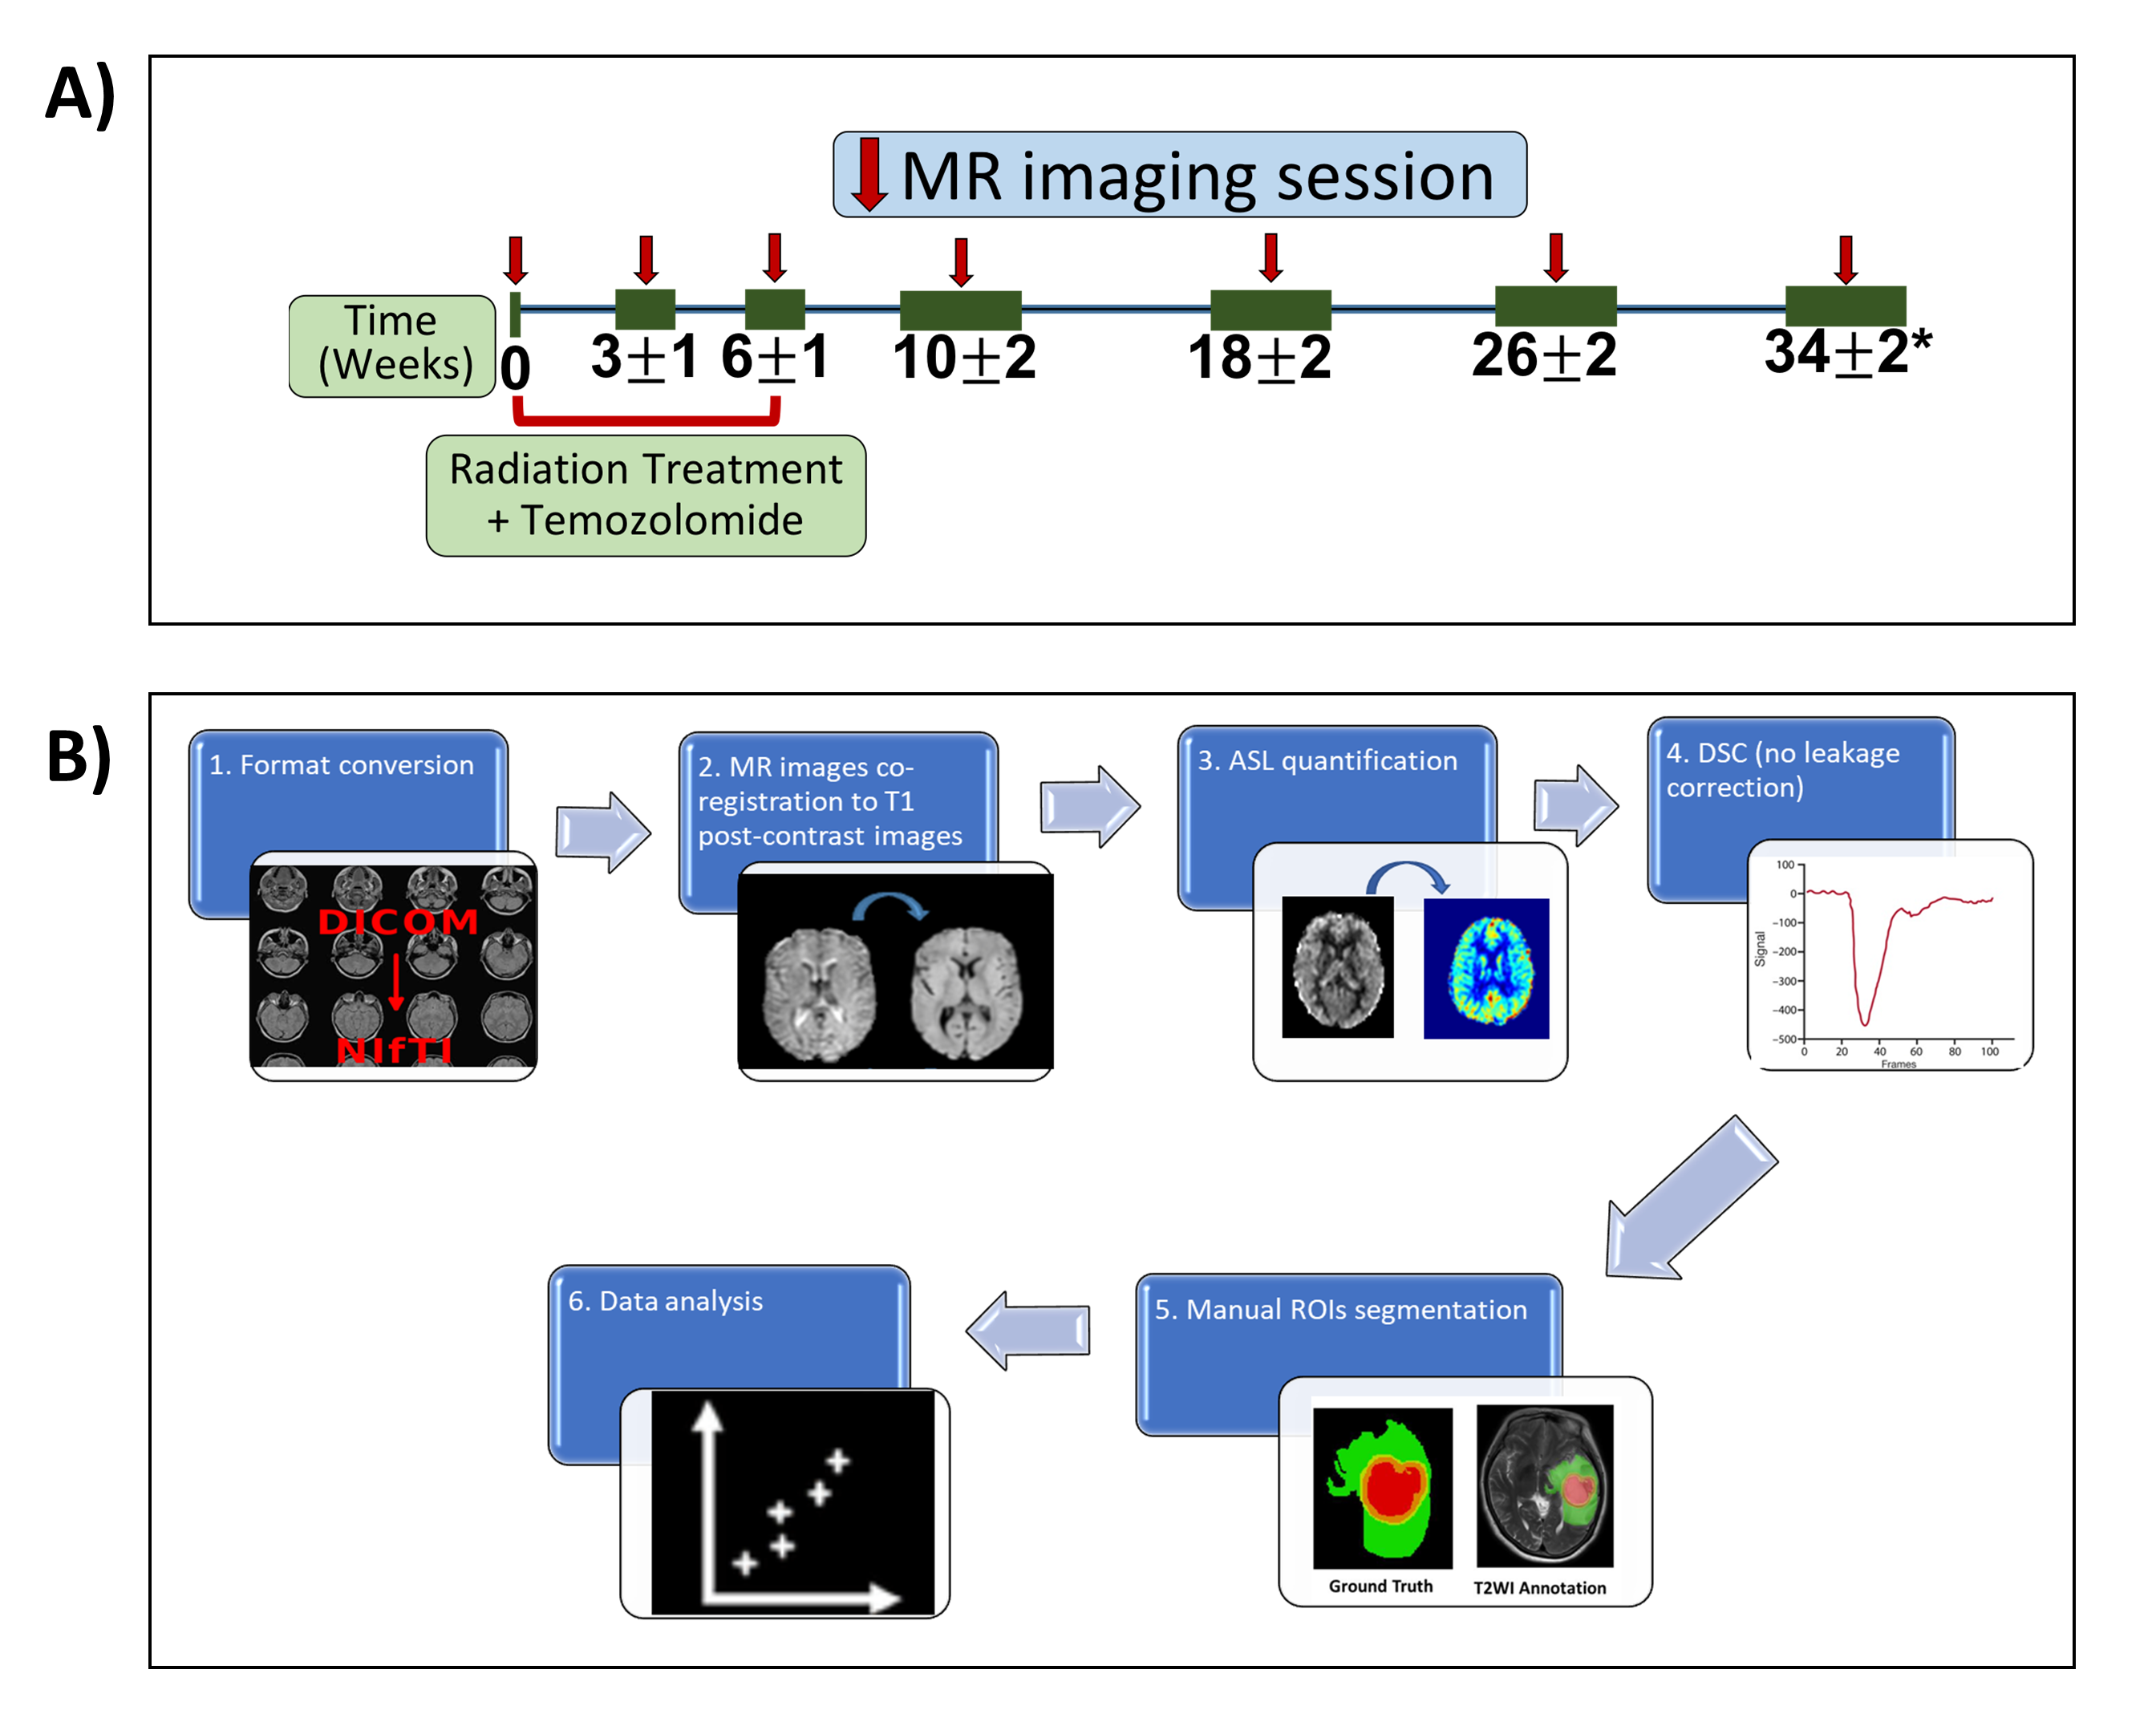
Figure 1: Magnetic resonance imaging (MRI) session time points in patients with glioblastoma (GBM) (A) and the processing pipeline (B). A) MRI including two variants of ASL and DSC were performed before, during, and after chemoradiation treatment at the indicated time points. B) The post-processing pipeline included the format transformation from DICOM to NifTI, co-registration to post-contrast T1-weighted images, quantification, manual segmentation, and data analysis.
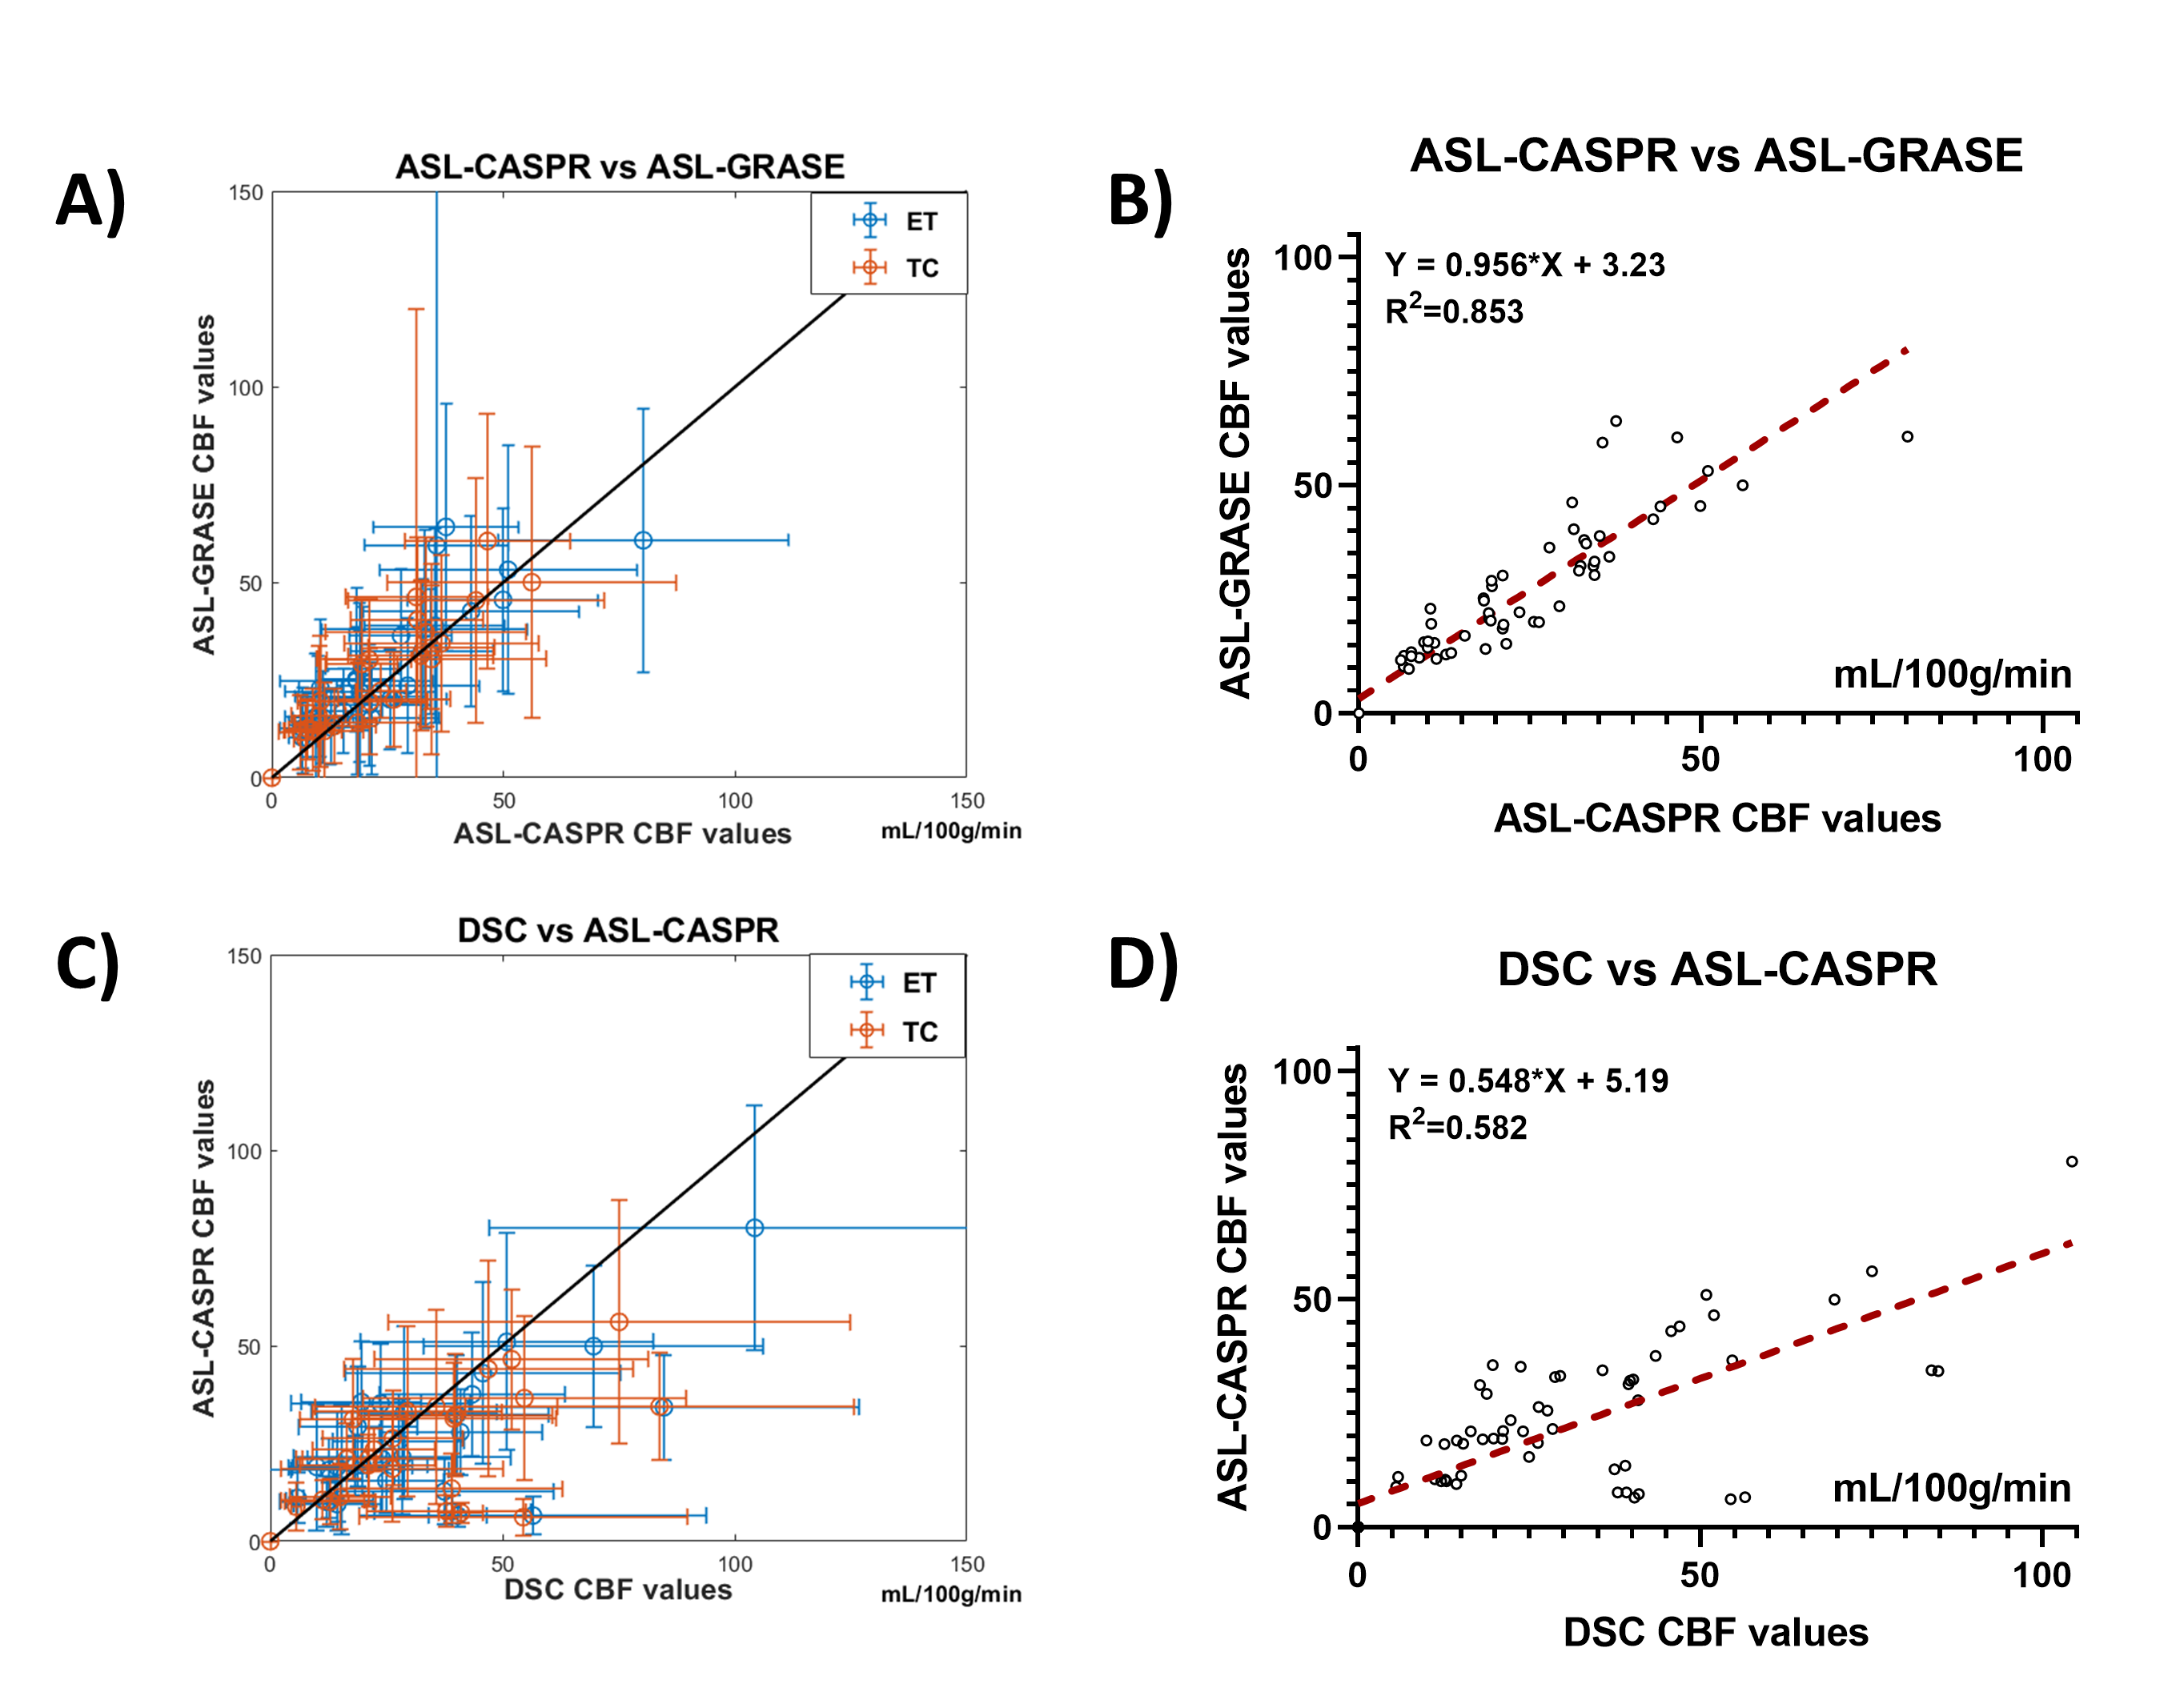
Figure 2: Scatter plots and linear regression analysis between ASL and DSC sequences. A) Scatter plot between ASL-CASPR and ASL-GRASE among enhancing tumor (ET) and tumor core (TC). The error bars are the standard deviation within the ROIs. B) Linear regression between ASL-CASPR and ASL-GRASE. C) Scatter plot between DSC and ASL-CASPR among TC and ET. D) Linear regression between DSC and ASL-CASPR.
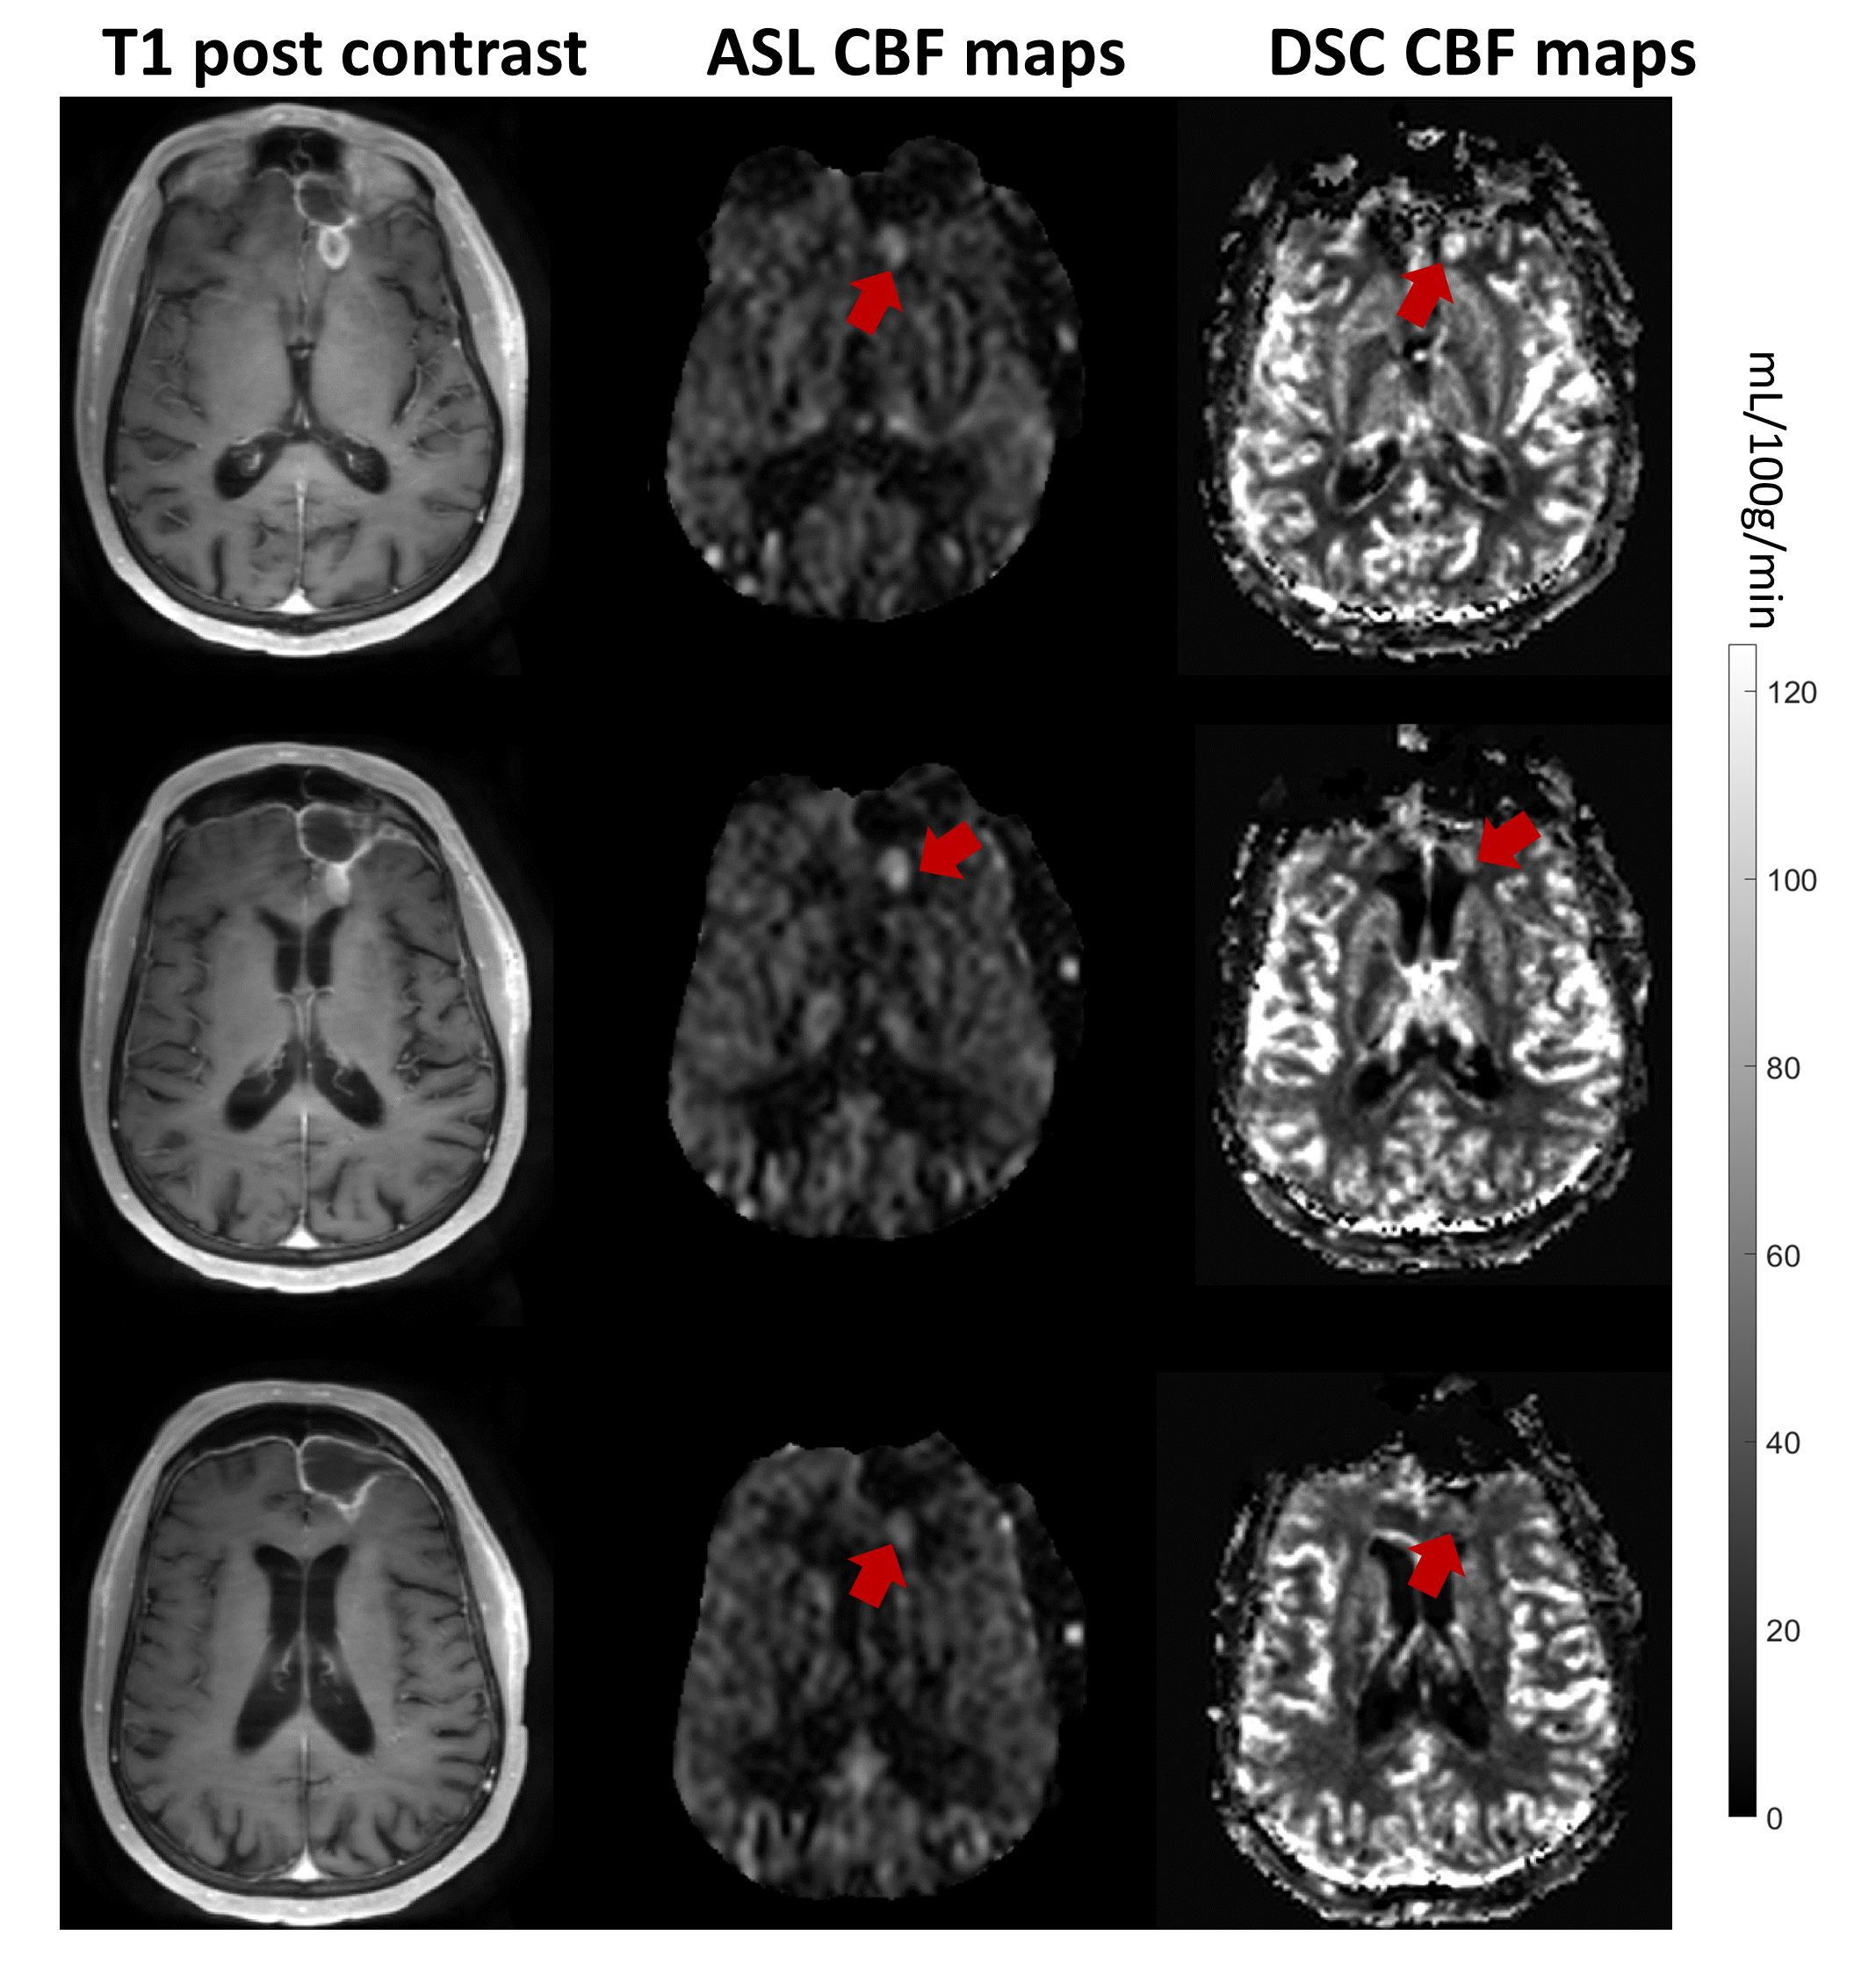
Figure 3: ASL is competitive to DSC. Either DSC or ASL can be used for tumor delineation in the first two slices (top & middle rows), but ASL outperforms DSC in third slice (bottom row). Although DSC shows lesion on the third slice, it is substantially obscured by the contamination of signal from large vessels and increased susceptibility due toB0 inhomogeneities.
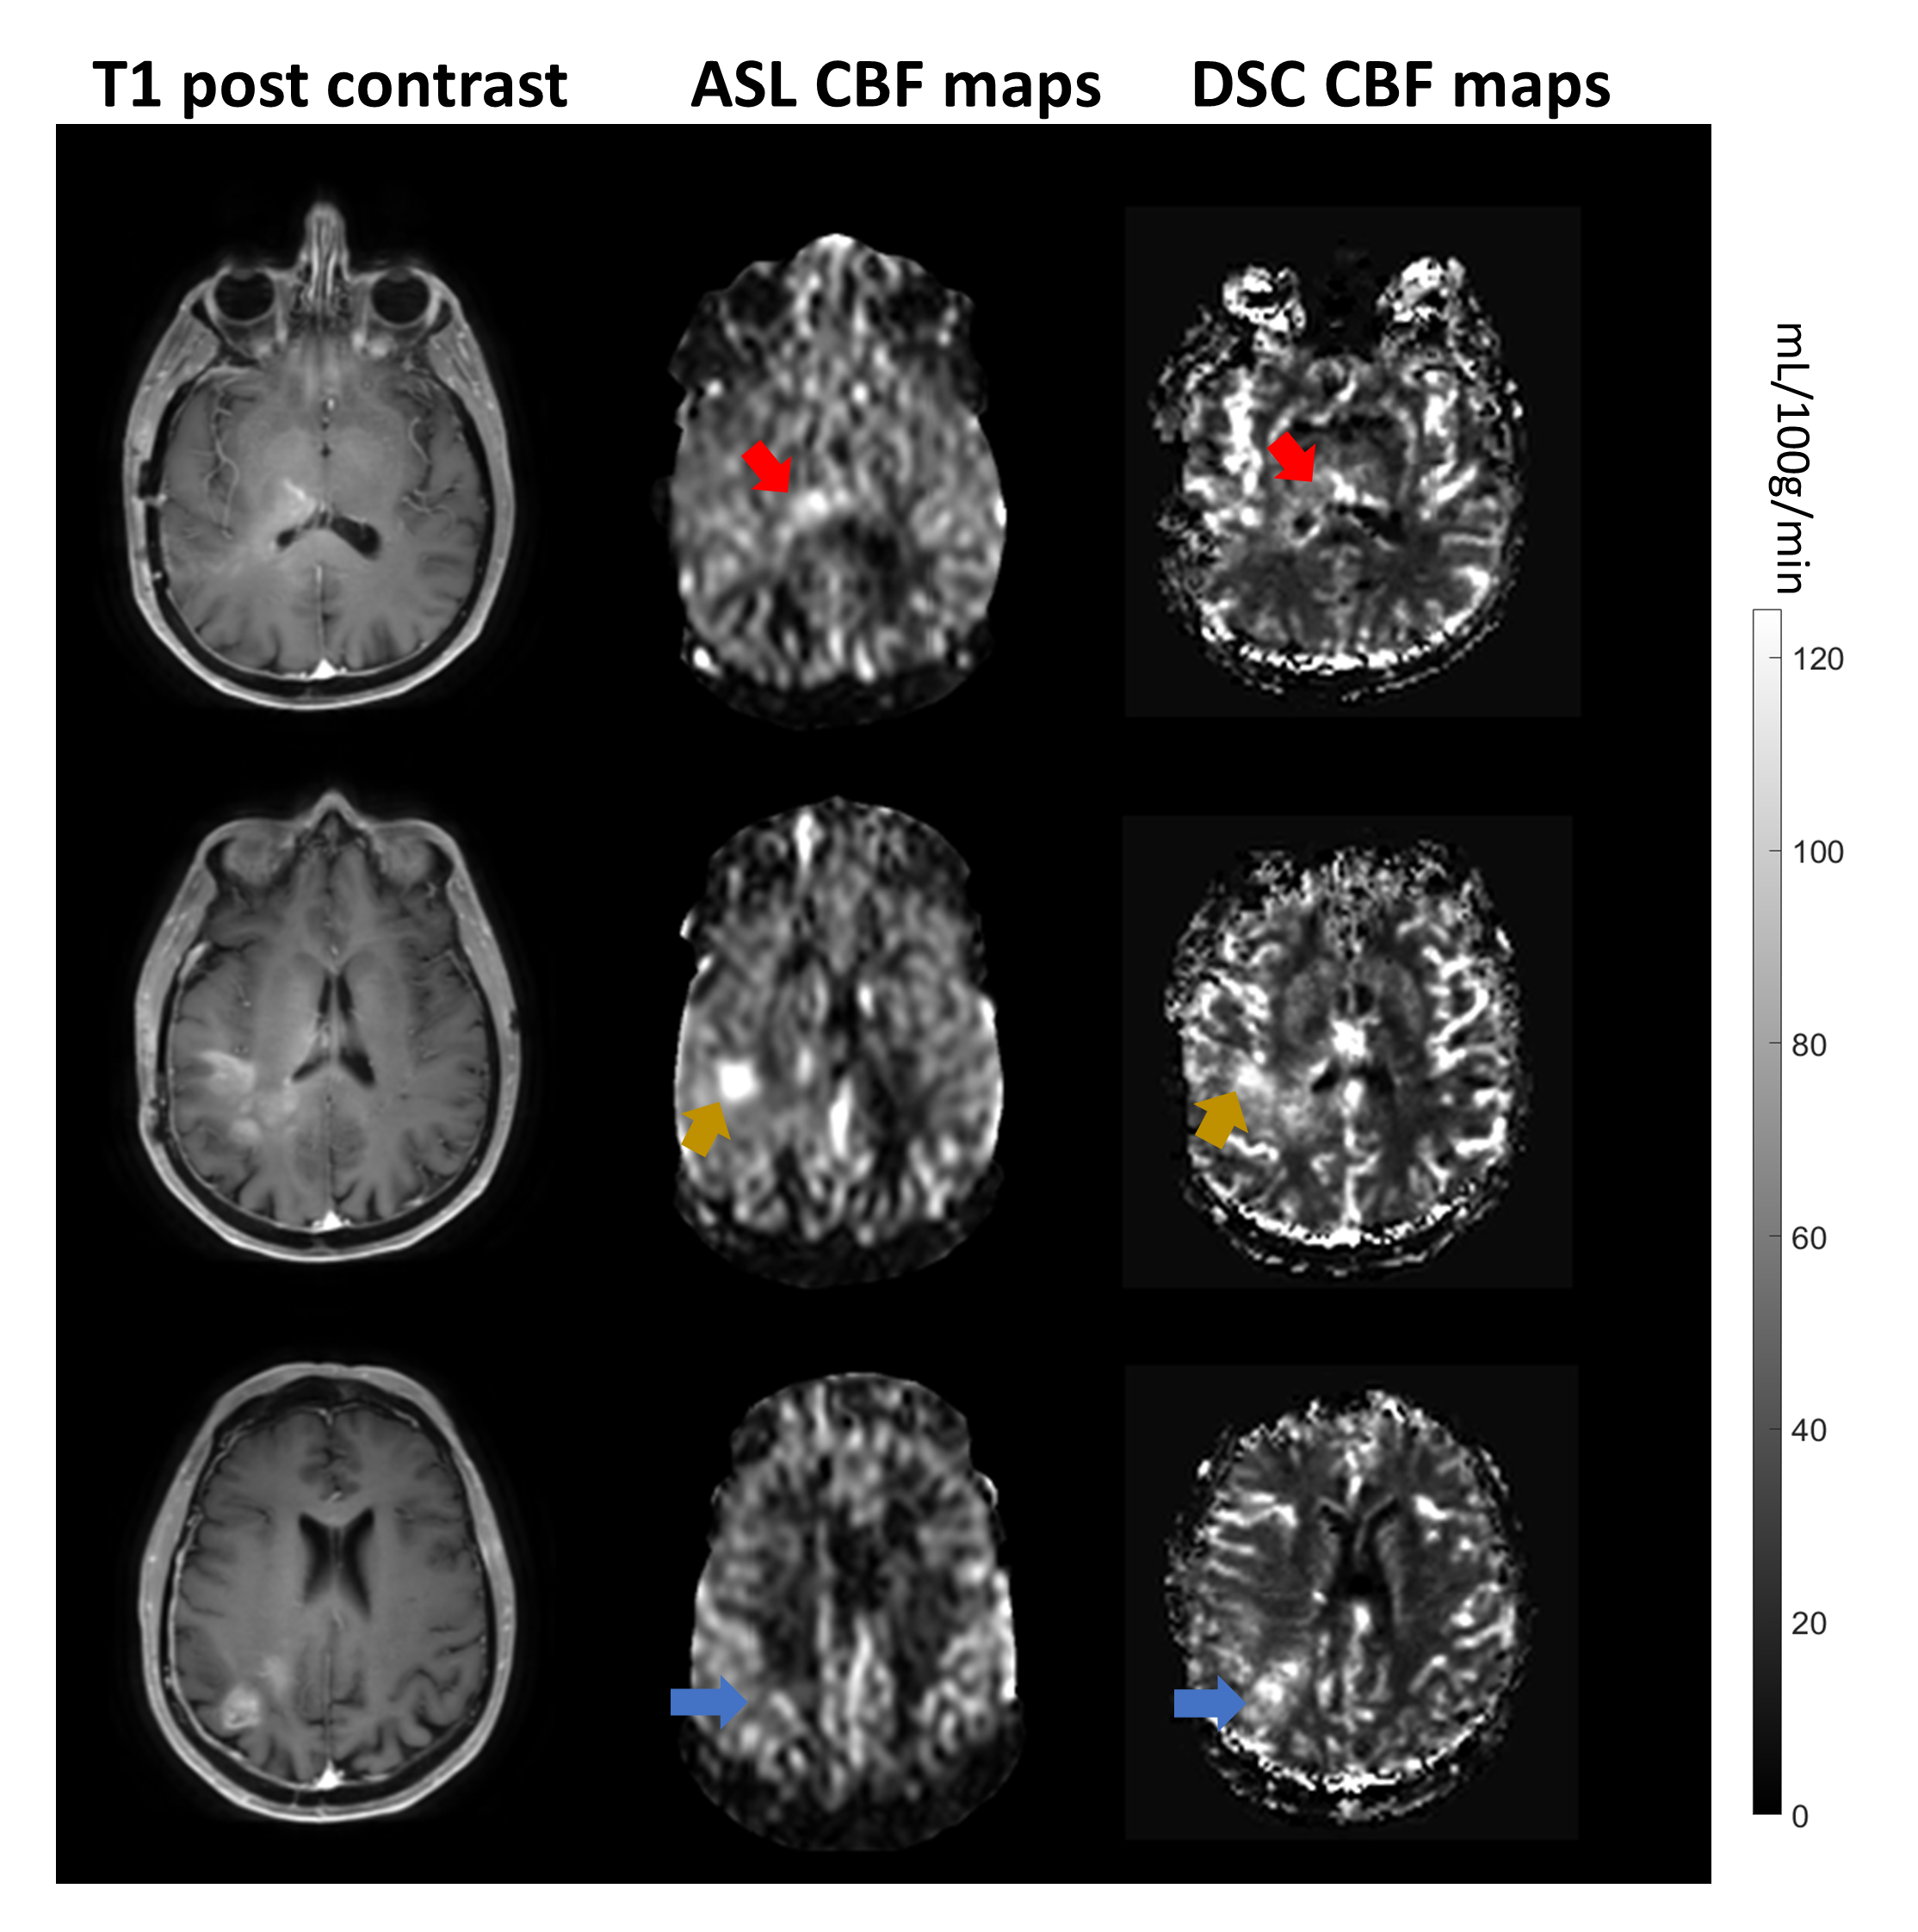
Figure 4: ASL and DSC are complementary to each other. In some lesions (yellow arrow), both ASL and DSC delineate tumor well. In other lesions, ASL has its advantages with increased conspicuity in some lesions (red arrow), but with lower contrast in other lesions (blue arrow) compared to DSC.

Figure 5: Detailed table about the relationship between ASL and DSC in each specific MR scan. ASL is competitive to DSC in over 90% of the MR scans and in over 90% of the competitive cases, ASL is either equivalent or superior to DSC.