2577
Extracting CBF and ATT from One or Two Post-labeling Delays-based Arterial Spin Labeled Perfusion MRI via Deep Learning1University of Maryland School of Medicine, Baltimore, MD, United States, 2University of Minnesota, Minneapolis, MN, United States, 3University of Pennsylvania Perelman School of Medicine, Philadelphia, PA, United States
Synopsis
Keywords: Arterial spin labelling, Arterial spin labelling
Cerebral blood flow (CBF) and arterial transit time (ATT) can be quantified through fitting the arterial spin labeling (ASL) perfusion MRI signal acquired at different post-labeling delays (PLDs) into a kinetic model. Acquiring multiple-PLD ASL MRI needs exponentially prolonged total scan time compared to the single-PLD acquisition, making it highly sensitive to motions and impractical for clinical use. We proposed a deep neural network that can reliably estimate ATT and CBF maps from significantly fewer PLD ASL MRI acquisitions without image quality loss.Introduction
Cerebral blood flow (CBF) and arterial transit time (ATT) can be quantified through fitting the arterial spin labeling (ASL) perfusion MRI [1] signal acquired at different post-labeling delays (PLDs) into a kinetic model [2]–[4]. However, acquiring multiple-PLD ASL MRI needs exponentially prolonged total scan time compared to the single-PLD acquisition, making it highly sensitive to motions and impractical for clinical use. There is a need of developing a technique to reliably estimate CBF and ATT from ASL MRI with a minimal number of PLDs. The purpose of this work is to train and test a deep learning (DL)-based ATT/CBF estimation algorithm: the ATT-Nets, to estimate ATT and CBF from one or two PLDs-based ASL MRI. Compared to the two studies published in the literature [5-6], our new contributions include: the use of wide activation network and large sample size; the inclusion of additional image features such as the weighted delay or the variation of ASL perfusion signal; the possibility of achieving an extremely large PLD reduction rate by using one or two-PLDs.Methods
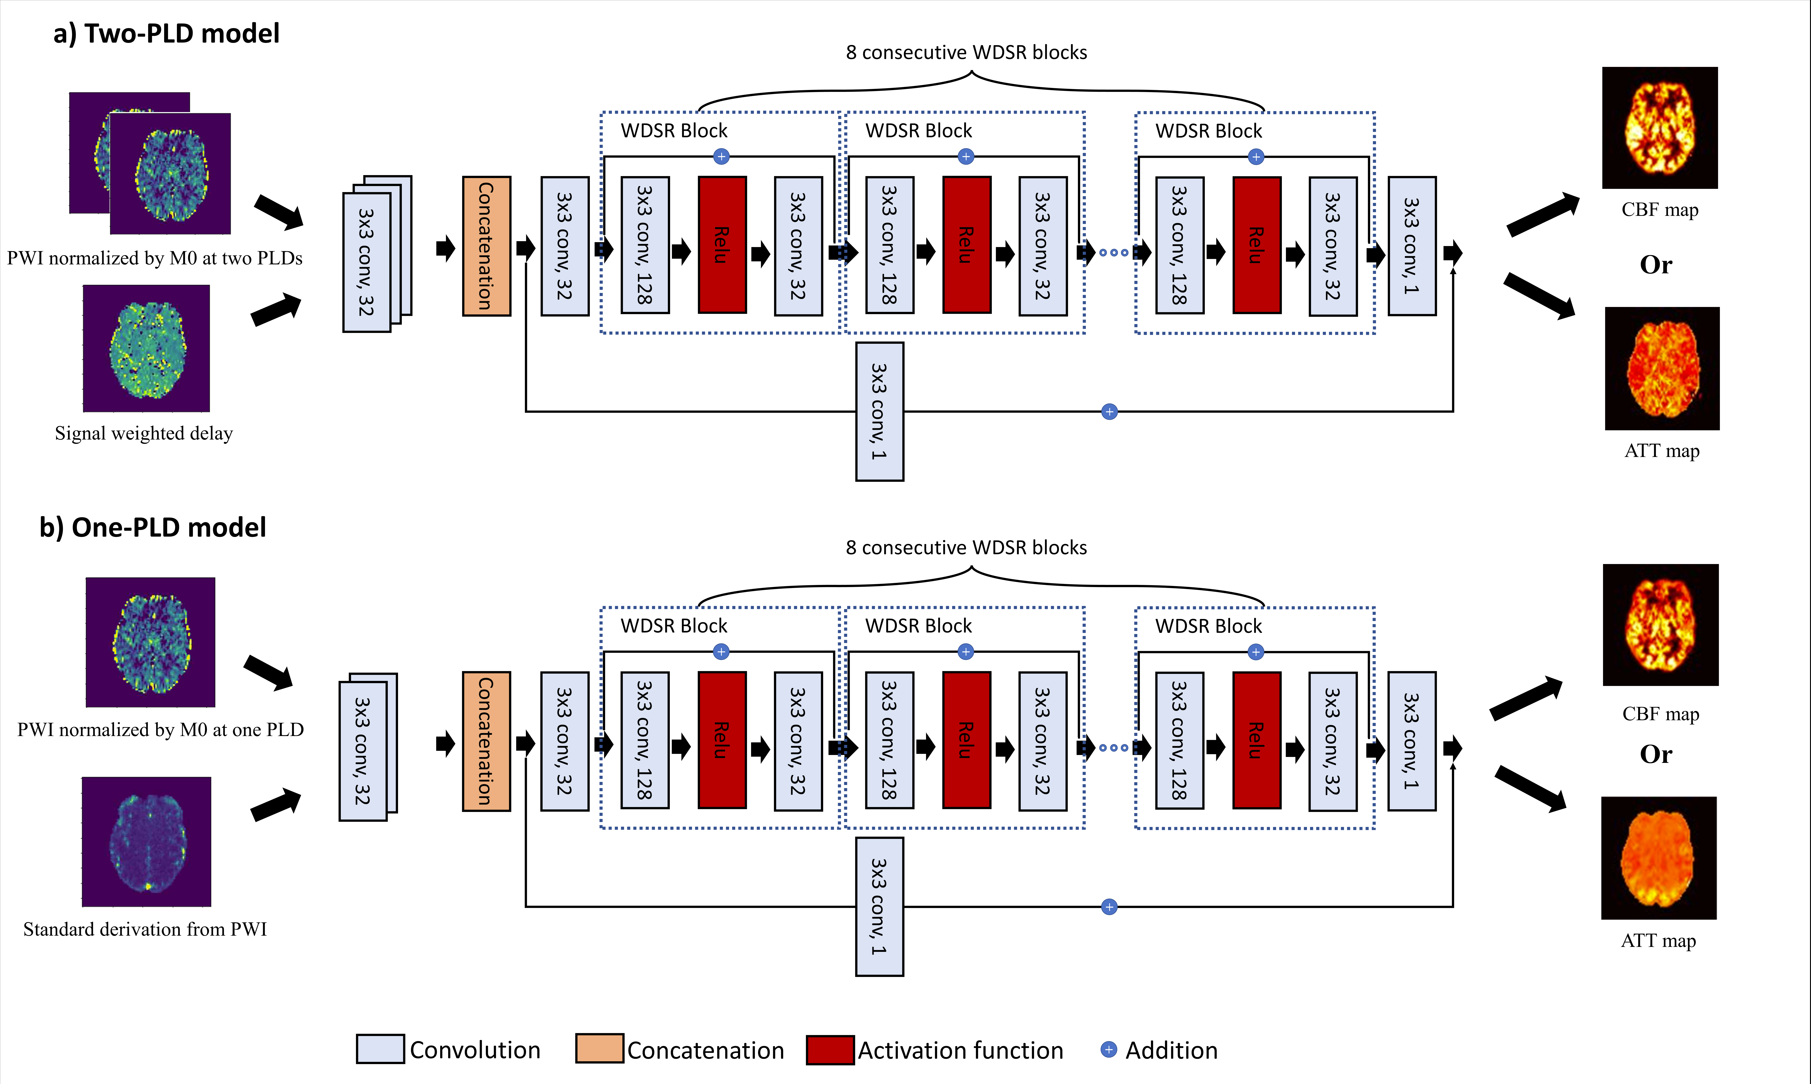
Multiple-PLD ASL data were downloaded from Human Connectome Project development project (HCP-D) [7]. ASL data acquisitions were based on a pseudo-continuous arterial spin labeling (PCASL) and 2D multiband-echo-planar imaging (EPI) sequence [8], with following acquisition parameters: 86×86×65 matrix, 3.5×3.5×3.5mm3 voxel resolution, TR/TE = 3580/18.7ms, pseudo-continuous labeling with 1500ms label duration. The same imaging process was repeated at 5 PLDs of 200, 700, 1200, 1700, and 2200ms, containing 6, 6, 6, 10, 15 control-label image pairs, respectively. To create the reference of CBF and ATT images, a voxel-wise ASL kinetic model fitting was applied via FSL toolbox [9] and ASLtbx [10].Figure 1 shows the architecture of ATT-Nets. The backbone of the network is the vanilla residual network [11] and all the residual blocks are replaced by Wide-activation Deep Super-Resolution network (WDSR) blocks [12]. For both the one-PLD and two-PLD ATT-Nets, CBF and ATT were predicted from the same input but with a separately trained model. The one-PLD model used the M0 normalized ΔM (PWI) and the standard deviation of the subtractions between pairwise label and control images at one PLD (=1.7s in this work) as the input. For two-PLD ATT-Nets, the input was the normalized ΔM and the signal weighted decay with two PLDs (=0.7/1.7s) [13]. The input channels besides normalized ΔM brought the value of PLD into consideration and took advantage of each acquisition instead of the average only. There are 627 qualified subjects in HCP-D dataset. 400 of them were randomly selected for training, another 100 subjects for testing, and the rest of the subjects for validation. For each subject, we extracted axial slices from 26th to 45th slice as high-quality training data. For each ATT-Nets, training was stopped after 300 epochs. The generated CBF and ATT maps were both registered to the corresponding T1-weighted images and then normalized into MNI space using scripts from ASLtbx, respectively. A couple of experiments were conducted to predict the CBF and ATT maps and some quantitative metrics and plots were used to evaluate the performance of the proposed method.
Results
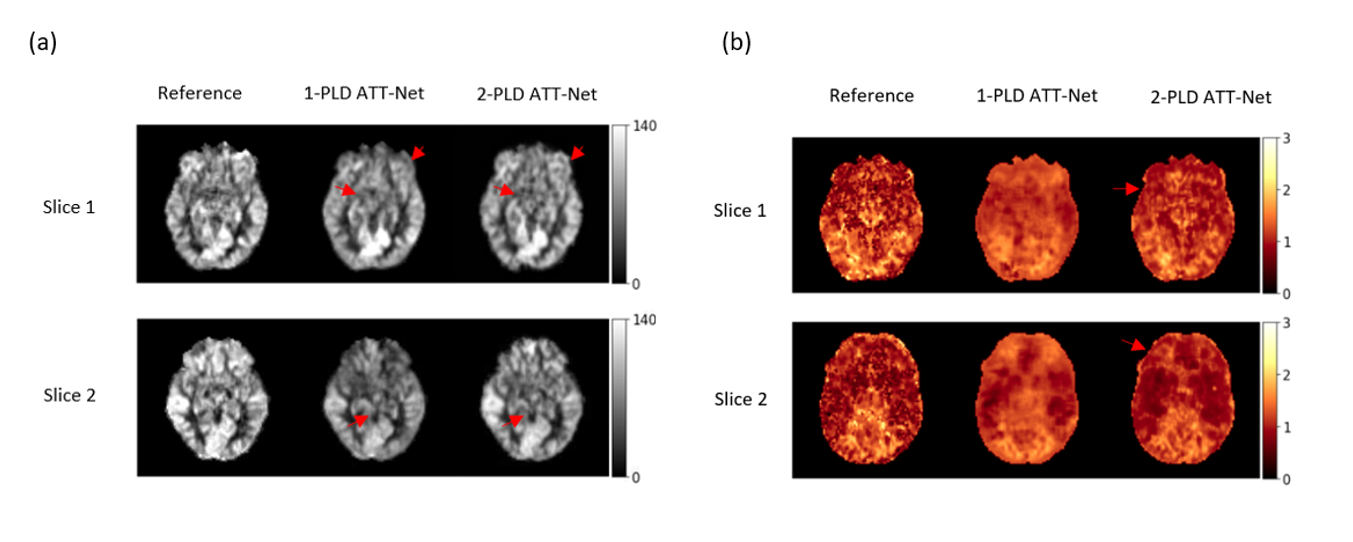
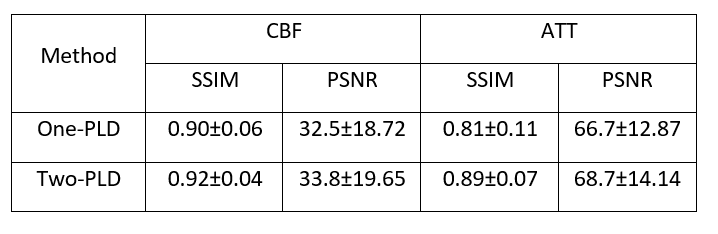
Figure 2(a)(b) shows the CBF and ATT estimation results for a representative subject of HCP-D. CBF images produced by the one-PLD and two-PLD ATT-Nets showed improved image quality in terms of less artifacts in grey matter, better signal contrast in the grey matter/white matter boundary as marked by the red arrows. For ATT images, both the one-PLD and the two-PLD ATT-Nets showed better image contrast and reduced noise than the reference. The ATT maps of the one-PLD ATT-Nets showed bigger image context difference in white matter.Table 1 lists the SSIM and PSNR results of CBF and ATT maps from the two models separately. There was no statistically significant difference between one-PLD and two-PLD ATT-Nets for SSIM and PSNR in either CBF or ATT.
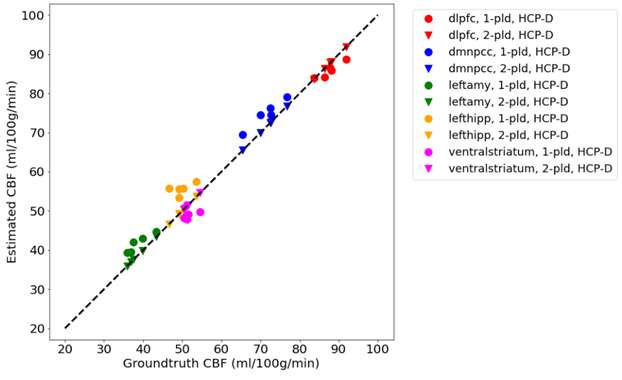
Figure 3 and 4 show CBF and ATT estimated from the entire 5-PLD data and by ATT-Nets. Mean values within 5 region-of-interest (ROIs) were shown. Both ATT-Nets produced similar CBF value to the reference. The two-PLD ATT-Nets produced nearly the same ATT as the reference but the one-PLD ATT-Nets produced lower than reference ATT in most of ROIs.
Discussion and Conclusion
Both the one-PLD and two-PLD ATT-Nets produced similar results to the reference as measured by SSIM with two-PLD ATT-Net performing better. The ATT image estimated by two-PLD ATT-Nets was quite similar to the reference but the one by one-PLD ATT-Nets showed noticeable difference from the reference. In conclusion, ATT and CBF can be reliably estimated from two-PLD ASL MRI using ATT-Nets. Compared to the 5-PLD acquisition scheme, the use of ATT-Nets can save 60% of total scan time. Further acceleration through the one-PLD ATT-Nets is possible once we improve the ATT estimation quality in future work.Acknowledgements
This project was supported by NIH grants: R01AG060054, R01 AG070227, R01EB031080-01A1, P41EB029460-01A1, and 1UL1TR003098.References
[1] J. A. Detre, J. S. Leigh, D. S. Williams, and A. P. Koretsky, “Perfusion imaging,” Magn Reson Med, vol. 23, no. 1, pp. 37–45, 1992.
[2] R. B. Buxton, L. R. Frank, E. C. Wong, B. Siewert, S. Warach, and R. R. Edelman, “A general kinetic model for quantitative perfusion imaging with arterial spin labeling,” Magn Reson Med, vol. 40, no. 3, pp. 383–396, 1998.
[3] J. B. Gonzalez-At, D. C. Alsop, and J. A. Detre, “Cerebral perfusion and arterial transit time changes during task activation determined with continuous arterial spin labeling,” Magnetic Resonance in Medicine: An Official Journal of the International Society for Magnetic Resonance in Medicine, vol. 43, no. 5, pp. 739–746, 2000.
[4] M. Günther, M. Bock, and L. R. Schad, “Arterial spin labeling in combination with a look-locker sampling strategy: inflow turbo-sampling EPI-FAIR (ITS-FAIR),” Magnetic Resonance in Medicine: An Official Journal of the International Society for Magnetic Resonance in Medicine, vol. 46, no. 5, pp. 974–984, 2001.
[5] D. Kim, M. Lipford, H. He, Q. Ding, V. Ivanovic, S. Lockhart, S. Craft, C. Whitlow, and Y. Jung, “A Three-Dimensional Convolutional Neural Network in ASL with Reduced Number of Inversion Times or Averages,” in ISMRM Perfusion Workshop, 2022.
[6] N. J. Luciw, Z. Shirzadi, S. E. Black, M. Goubran, and B. J. MacIntosh, “Automated Generation of Cerebral Blood Flow Maps Using Deep Learning and Multiple Delay Arterial Spin-Labelled MRI,” bioRxiv, 2021.
[7] S. Y. Bookheimer, D. H. Salat, M. Terpstra, B. M. Ances, D. M. Barch, R. L. Buckner, G. C. Burgess, S. W. Curtiss, M. Diaz-Santos, J. S. Elam, and others, “The lifespan human connectome project in aging: an overview,” Neuroimage, vol. 185, pp. 335–348, 2019.
[8] M. P. Harms, L. H. Somerville, B. M. Ances, J. Andersson, D. M. Barch, M. Bastiani, S. Y. Bookheimer, T. B. Brown, R. L. Buckner, G. C. Burgess, and others, “Extending the Human Connectome Project across ages: Imaging protocols for the Lifespan Development and Aging projects,” Neuroimage, vol. 183, pp. 972–984, 2018.
[9] M. Jenkinson, C. F. Beckmann, T. E. J. Behrens, M. W. Woolrich, and S. M. Smith, “Fsl,” Neuroimage, vol. 62, no. 2, pp. 782–790, 2012.
[10] Z. Wang, G. K. Aguirre, H. Rao, J. Wang, M. A. Fernández-Seara, A. R. Childress, and J. A. Detre, “Empirical optimization of ASL data analysis using an ASL data processing toolbox: ASLtbx,” Magn Reson Imaging, vol. 26, no. 2, pp. 261–269, 2008.
[11] K. He, X. Zhang, S. Ren, and J. Sun, “Deep residual learning for image recognition,” in Proceedings of the IEEE conference on computer vision and pattern recognition, 2016, pp. 770–778.
[12] J. Yu, Y. Fan, J. Yang, N. Xu, Z. Wang, X. Wang, and T. Huang, “Wide activation for efficient and accurate image super-resolution,” arXiv preprint arXiv:1808.08718, 2018.
[13] W. Dai, P. M. Robson, A. Shankaranarayanan, and D. C. Alsop, “Reduced resolution transit delay prescan for quantitative continuous arterial spin labeling perfusion imaging,” Magn Reson Med, vol. 67, no. 5, pp. 1252–1265, 2012.
Figures