2573
Assessment of Splenic Switch-Off With Arterial Spin Labeling in Adenosine Perfusion Cardiac MRI1Radiology, Clínica Universidad de Navarra, Pamplona, Spain, 2IdiSNA, Instituto de Investigación Sanitaria de Navarra, Pamplona, Spain, 3Siemens Healthineers, Madrid, Spain, 4Cardiology, Clínica Universidad de Navarra, Pamplona, Spain
Synopsis
Keywords: Arterial spin labelling, Perfusion
Splenic switch-off, defined as the stress to rest splenic blood flow (SBF) attenuation in response to adenosine, is an indicator of stress adequacy. This study aims to explore the ability of pseudo-continuous arterial spin labeling (PCASL) to identify splenic switch-off in patients with suspected CAD. In healthy subjects, multi-delay PCASL data were acquired to quantify SBF and determine the adequate postlabeling delay. In patients, single-delay PCASL and first-pass perfusion images were acquired under rest and adenosine conditions. This study could demonstrate the feasibility of PCASL to identify splenic switch-off during adenosine perfusion MRI.INTRODUCTION
In patients with suspected coronary artery disease (CAD), myocardial perfusion is measured under rest and pharmacologically induced stress to identify potential areas of ischemia, but inadequate stress levels can cause false negative findings in the MRI perfusion scan[1]. Splenic switch-off has been proposed as an indicator of stress adequacy and it has been successfully assessed in first pass images during study interpretation[2]–[6]. Non contrast imaging techniques such as arterial spin labeling are beneficial for the real time evaluation of splenic switch off. The main goal of this study is to evaluate the potential of pseudo-continuous ASL (PCASL) to identify splenic switch-off in rest-stress adenosine perfusion studies and to validate the technique against first-pass imaging in patients with suspected CAD.METHODS
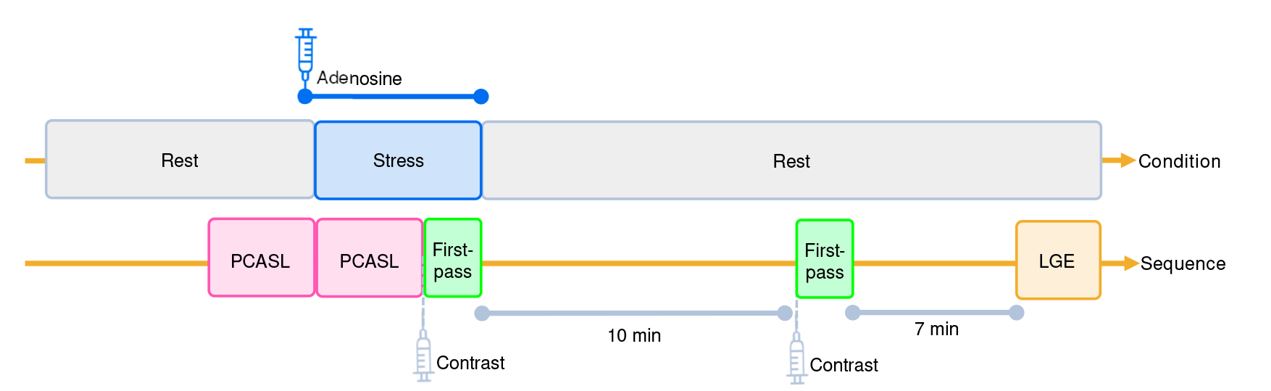
Five healthy volunteers (age 24.8 ± 3.8 years) and 32 patients (age 66.4 ± 8.2 years) were recruited for the study. Data acquisition was performed in a 1.5 T Aera scanner. In healthy subjects, a multi-delay PCASL sequence was acquired with six different post-labeling delays (PLDs:500, 700, 1000, 1200, 1500, and 2000 ms), labeling duration of 1600 ms, 90% background suppression, and spin echo–echo planar imaging readout. 50 label-control images per PLD and a proton-density image were acquired.In patients, a single-delay PCASL sequence was acquired with the optimal PLD (1200 ms) obtained from the study with healthy subjects. A maximum of 30 label-control images and a proton density image were acquired under rest and stress conditions. These sequences were added to the clinical protocol (Figure-1) prior to the acquisition of first-pass images to avoid the T1 reduction effects by gadolinium. During stress, the PCASL sequence was initiated with adenosine infusion and stopped before the first-pass sequence. The perfusion protocol included ECG-triggered stress-rest first-pass short axis images of the heart during free breathing. The adenosine infusion was initiated using the standard dosage (140 μg/kg/min) and increased to 180 μg/kg/min whenever there was not a 10-bpm increase in patient heart rate during the subsequent 3–4 minutes.
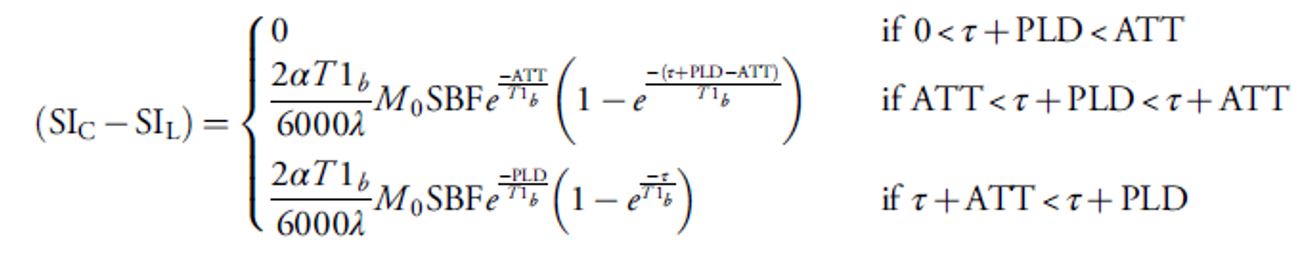
Splenic blood flow perfusion data were quantified using equation presented in Figure-2. Stress-to-rest SBF ratios were computed to evaluate splenic switch-off. In first-pass data, semiquantitative perfusion quantification was performed in both myocardial and splenic tissue in one short-axis slice where the spleen could be observed. Three observers visually evaluated rest and stress perfusion images obtained with PCASL and First-Pass and classified patients in “switch-off” or “failed switch-off” categories. Patients with a visual attenuation of splenic perfusion were classified as having experienced switch-off.
Statistical tests: Wilcoxon signed-rank, kappa, percentage agreement, Generalized Linear Mixed Model, receiver operating characteristic, area-under-the-curve (AUC) and confusion matrix.
RESULTS AND DISCUSSION
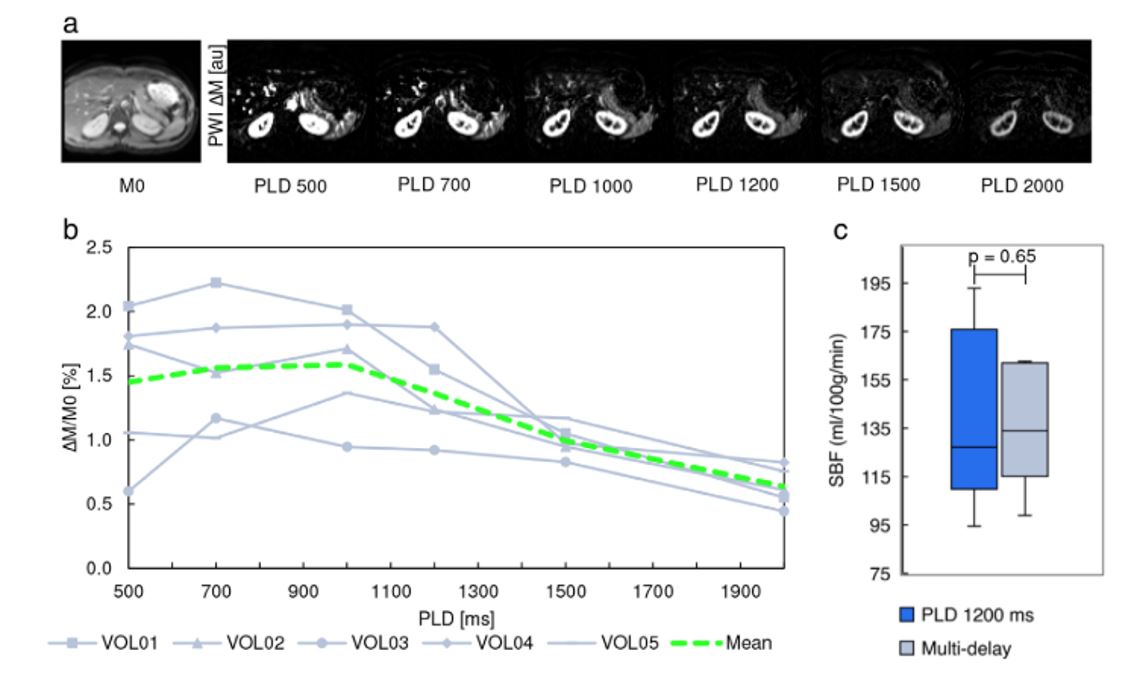
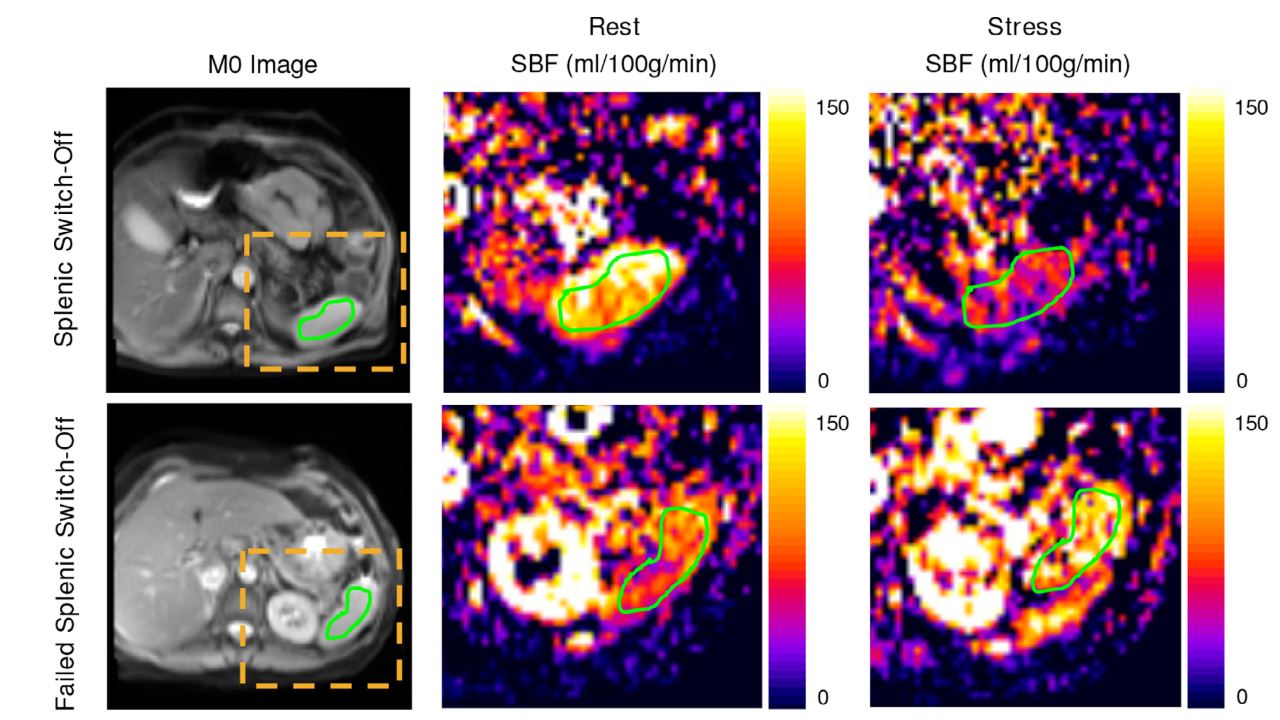
Multi-delay PCASL was feasible in healthy subjects, with measured splenic perfusion being in agreement with previously reported values[7]. Multi-delay PCASL yielded perfusion images for each PLD (Figure-3a), with a group mean splenic perfusion signal of 1.45% for the 500 msec PLD, which increased to a maximum value of 1.59% for the 1000 msec PLD and decreased for longer PLDs (Figure-3b). A PLD of 1200 msec was selected for the single-delay analysis (to ensure PLD > ATT and thus complete delivery of labeled blood to tissue), which yielded SBF values of 139.7 mL/100 g/min (SD: 37.5, range 94.4– 192.9 mL/100 g/min). No significant differences were observed between SBF values derived from single and multi-delay data (P = 0.65) (Figure-3c).Adequate SBF maps were obtained for 32 patients. Group mean SBF values were 105.3 mL/100 g/min (SD: 56.8 mL/100 g/min) at rest and 57.9 mL/100 g/min (SD: 54.2 mL/100 g/min) under stress, a difference that was statistically significant. Figure 4 shows quantitative perfusion maps for two representative patients with and without switch-off obtained with PCASL during rest and stress. No significant differences (P = 0.58) were found in the splenic ratios measured by first-pass and PCASL, but these ratios were significantly lower than those obtained in the myocardium.
Splenic switch-off occurred in 84.4% of patients according to the first-pass visual assessment performed by the radiologists (κ = 0.916). Visual assessment of splenic switch-off from PCASL data showed a strong interobserver agreement (κ = 0.878). Intertechnique agreement was fair (κ = 0.23 and 78.7% percentage agreement). The results of the GLMM estimation showed that the difference between techniques was nonsignificant (estimate = 1.3261, SE = 0.9800, z-value = 1.253, P value = 0.176), indicating that the two techniques may be used interchangeably. Stress-to-rest splenic ratios measured with both PCASL and first-pass were significantly lower than those obtained in the myocardium. This supports the idea that splenic perfusion is attenuated with adenosine stress in comparison to myocardial perfusion.
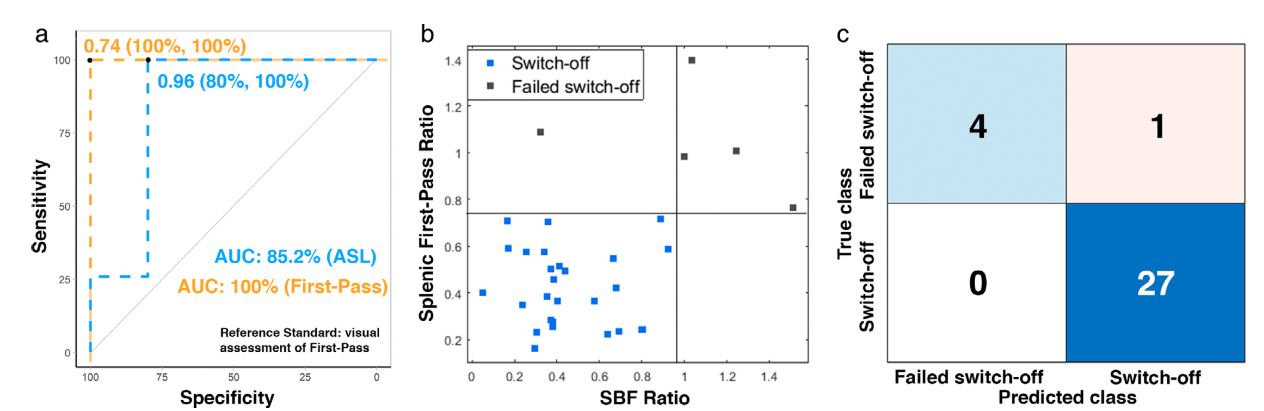
Figure 5 shows ROC curves for the discrimination between splenic switch-off and failed switch-off stress-to-rest perfusion ratios. First-pass ROC analysis yielded a cut-off of 0.74. Classification results using this threshold were in full accordance with those obtained by visual assessment (sensitivity =100%, specificity = 100%, AUC = 100%). For PCASL, the optimal a cut-off was 0.96 (sensitivity = 80%, specificity = 100%, AUC = 85.2%).
CONCLUSION
This study could demonstrate the feasibility of using PCASL to identify splenic switch-off during adenosine stress cardiac MRI in patients with suspected CAD.Acknowledgements
Grant Support: Sergio M. Solís-Barquero received PhD grant support from Fundación Carolina and Universidad de Costa Rica.
Spanish Ministry of Science and Innovation (grant: PI21/00578).
References
[1] S. Plein et al., “Associated factors for a false negative cardiovascular magnetic resonance perfusion study: a CE-MARC substudy,” J. Cardiovasc. Magn. Reson., vol. 15, no. S1, p. P214, 2013, doi: 10.1186/1532-429x-15-s1-p214.
[2] C. Manisty et al., “Splenic Switch-off: A Tool to Assess Stress Adequacy in Adenosine Perfusion Cardiac MR Imaging.,” Radiology, vol. 000, no. 0, p. 142059, 2015, doi: 10.1148/radiol.2015142059.
[3] D. Patriki et al., “Splenic switch-off as a predictor for coronary adenosine response: validation against 13N-ammonia during co-injection myocardial perfusion imaging on a hybrid PET/CMR scanner,” J. Cardiovasc. Magn. Reson., vol. 23, no. 1, pp. 1–7, 2021, doi: 10.1186/s12968-020-00696-y.
[4] A. Bakula et al., “Splenic switch-off as a novel marker for adenosine response in nitrogen-13 ammonia PET myocardial perfusion imaging: Cross-validation against CMR using a hybrid PET/MR device,” J. Nucl. Cardiol., vol. 29, no. 3, pp. 1205–1214, Jun. 2022, doi: 10.1007/s12350-020-02448-y.
[5] A. Hosking et al., “Evaluation of splenic switch off in a tertiary imaging centre: Validation and assessment of utility,” Eur. Heart J. Cardiovasc. Imaging, vol. 18, no. 11, pp. 1216–1221, 2017, doi: 10.1093/ehjci/jew205.
[6] S. Giusca et al., “Splenic Switch-Off for Determining the Optimal Dosage for Adenosine Stress Cardiac MR in Terms of Stress Effectiveness and Patient Safety,” J. Magn. Reson. Imaging, vol. 52, no. 6, pp. 1732–1742, 2020, doi: 10.1002/jmri.27248.
[7] C. R. Bradley et al., “Multi-organ assessment of compensated cirrhosis patients using quantitative magnetic resonance imaging,” J. Hepatol., vol. 69, no. 5, pp. 1015–1024, 2018, doi: 10.1016/j.jhep.2018.05.037.
Figures