2572
Change in Blood-brain Barrier Permeability with Age – Comparing a Physiologically Informed Biophysical Model with a Triexponential Decay Model
Amnah Mahroo1 and Matthias Günther1,2,3
1Imaging Physics, Fraunhofer Institute for Digital Medicine MEVIS, Bremen, Germany, 2MR-Imaging and Spectroscopy, University of Bremen, Bremen, Germany, 3mediri GmbH, Heidelberg, Germany
1Imaging Physics, Fraunhofer Institute for Digital Medicine MEVIS, Bremen, Germany, 2MR-Imaging and Spectroscopy, University of Bremen, Bremen, Germany, 3mediri GmbH, Heidelberg, Germany
Synopsis
Keywords: Arterial spin labelling, Brain, Blood-brain barrier Permeability, Aging, Multi-TE ASL
With age the integrity of blood-brain barrier (BBB) slowly deteriorates. Multi-TE ASL, being a water-based MRI method, offers detection of subtle changes in the BBB by probing T2 relaxation. In this study, we evaluated the sensitivity of multi-TE ASL method in detecting changes in the BBB occurring due to age using two models; a physiologically informed biophysical (PIB) model by estimating exchange time and a simpler tri-exponential decay (TD) model by determining the rate of change of tissue fraction. We found that both models were able to detect age-based changes in BBB. Moreover, PIB model showed higher robustness.Introduction
Blood-brain barrier (BBB) is a crucial physiological barrier around the brain vessels which maintains the microenvironment by tightly regulating the movement of substances in and out of the brain 1. With age the integrity of this barrier slowly deteriorates which may in turn play a role in progression of neurodegenerative diseases 2. Multi-TE ASL, being a water-based MRI method, offers detection of subtle changes in the BBB by probing T2 relaxation 3-5. The purpose of this study is to evaluate the sensitivity of multi-TE ASL method in detecting changes in the BBB, occurring due to age, using two models; a physiologically informed biophysical (PIB) model by estimating exchange time (Tex), and a simpler tri-exponential decay (TD) model by determining the rate of change of tissue fraction (Kin), as measures of BBB permeability.Methods
ImagingWe acquired data from two different age groups of healthy volunteers (n=13, each) – older group > 50 years and younger group < 20 years. All volunteers were examined at 3T (MAGNETOM Skyra, SIEMENS Healthineers AG). A combination of single-TE and multi-TE Hadamard pseudo-continuous (pCASL) protocol 6 with 3D GRASE readout of four-fold acceleration was used. All measurements were acquired with a matrix size of 64x128x24 and a voxel size of 5x5x5 mm. The resulting HAD-8 were [600-3000 ms with 400 ms increment; SBD [ms]: 400; PLD [ms]: 200; TR [ms]: 5000]. The resulting HAD-4 TIs [ms] were [1600, 2600, 3600; SBD [ms]: 1000; PLD [ms]: 600; TR [ms]: 5000]. Both protocols were acquired at eight echo times (TE [ms]) [14.4, 43.4, 72.4, 101.3, 130.3, 159.2, 188.2, 217.2]. Multi-TE M0 images were also acquired at same TE values (TR [ms]: 5000, TI [ms]: 400, 1700, 3000). A T1 MPRAGE was acquired for structural processing.
Post-processing
For PIB model processing, data was analyzed with FMRIB Software Library (FSL) fabber 7 and perfusion, arterial transit time (ATT), Tex and intra-voxel transit time (ITT) were fitted using the extended two-compartment multi-TE model 6. Mean gray matter (GM) values were calculated. The parameter maps were registered to structural and MNI 152 standard spaces to compare them within and across the subjects, respectively.
For TD model, multi-TE M0 images and HAD-4 decoded images were fitted independently using mono-exponential decay function $$$S_{0} \cdot\exp\left(-TE/T2\right) + noise$$$ to estimate T2 voxelwise. HAD-4 ASL decoded images were fitted with three-parameter tri-exponential decay model to compartmentalize spins into blood, tissue and cerebrospinal fluid (CSF) spaces.
$$S_{tissue} \cdot\exp\left(-TE/T2\right) + S_{blood} \cdot\exp\left(-TE/T2\right)+S_{csf} \cdot\exp\left(-TE/T2\right)$$
Tissue T2 was fixed using T2 estimated with multi-TE M0. T2 blood and T2 CSF were fixed at 165ms and 2200ms, respectively 8. The resulting fitted signals were used to calculate tissue fraction at every TI. TI-dependent frequency histograms of tissue fraction were calculated, and peak fractions were detected. A linear model $$$Tissue Fraction (TI) = K_{in}\cdot TI + b$$$ was used to determine the slope (Kin) reflecting the rate of change of tissue fraction over time.
Results
Figure 1 shows ASL data (only TE-1) comparing images of an older and a younger volunteer. From PIB model, we observed that the exchange time was 36 % lower in older group (142.5 ± 30 ms) as compared to the younger group (224.1 ± 51 ms), P = 0.008. This shows that water transfers at a faster rate from blood into the tissue, reflecting an increased BBB permeability in the older volunteers. Mean perfusion was 29 %, P < 0.001 lower while mean ATT was 17 %, P < 0.001 higher in older group relative to the younger group (figure 2). Figure 3 shows (A) T2 images fitted with ASL data and (B) T2 frequency histogram. Decrease in T2 can be seen as TI increases. Figure 4 shows (A) tissue fraction at all three TIs and (B) their peaks detected from frequency histogram. Figure 4(C) shows peak frequencies fitted with a linear model. Averaged Kin for older group (0.06) was significantly lower (P < 0.001) than the younger group (0.14) as shown in figure 5.Discussion and Conclusion
PIB model showed sensitivity for detecting age-related changes in BBB. We found that Tex was lower in the older group, depicting a faster exchange and increased BBB permeability. This has been in line with literature published with contrast-agent based MRI 9. The simpler TD model has less assumptions and is more flexible, making it less complicated. TD model was also able to detect age-based BBB changes, with older group showing a smaller positive slope (flatter) as compared to the younger group (figure 5). Moreover, the most prominent difference was higher tissue fraction at the earliest TI (1600 mas) in the older group (0.70) compared to the younger group (0.54). This difference could be arising from vessel narrowing occurring with age due to deposition of substances like cholesterol in case of arteriosclerosis or paramagnetic materials (eg. iron), causing an apparent decrease in blood T2. This could have resulted in an apparent higher tissue fraction at the earliest TI in the older group. We conclude that both models are able to detect age-based changes in the BBB. Moreover, PIB model considers physiological parameters which makes it more robust, while exhibiting higher complexity.Acknowledgements
The DEBBIE project (Developing a non-invasive biomarker for early BBB breakdown in Alzheimer’s disease) is an EU Joint Programme -Neurodegenerative Disease Research (JPND) project. It is supported through the following funding organisations under the aegis of JPND -www.jpnd.eu(FWO in Belgium, Canadian Institutes of Health Research in Canada, BMBF in Germany, NFR in Norway, ZonMw in The Netherlands, TÜBITAK in Turkey).The project has received funding from the European Union’s Horizon 2020 research and innovation programme under grant agreement No. 825664.References
- Sweeney, M.D., Sagare, A.P. and Zlokovic, B.V., 2018. Blood–brain barrier breakdown in Alzheimer disease and other neurodegenerative disorders. Nature Reviews Neurology, 14(3), pp.133-150.
- Farrall, A.J. and Wardlaw, J.M., 2009. Blood–brain barrier: ageing and microvascular disease–systematic review and meta-analysis. Neurobiology of aging, 30(3), pp.337-352.
- Liu, P., Uh, J. and Lu, H., 2011. Determination of spin compartment in arterial spin labeling MRI. Magnetic Resonance in Medicine, 65(1), pp.120-127.
- Wells, J.A., Siow, B., Lythgoe, M.F. and Thomas, D.L., 2013. Measuring biexponential transverse relaxation of the ASL signal at 9.4 T to estimate arterial oxygen saturation and the time of exchange of labeled blood water into cortical brain tissue. Journal of Cerebral Blood Flow & Metabolism, 33(2), pp.215-224.
- Gregori, J., Schuff, N., Kern, R. and Günther, M., 2013. T2‐based arterial spin labeling measurements of blood to tissue water transfer in human brain. Journal of Magnetic Resonance Imaging, 37(2), pp.332-342.
- Mahroo, A., Buck, M.A., Huber, J., Breutigam, N.J., Mutsaerts, H.J., Craig, M., Chappell, M. and Günther, M., 2021. Robust Multi-TE ASL-Based Blood–Brain Barrier Integrity Measurements. Frontiers in neuroscience, 15.
- Chappell, M. A., Groves, A. R., Whitcher, B., and Woolrich, M. W. (2008). Variational Bayesian inference for a nonlinear forward model. IEEE Trans. Signal Process. 57, 223–236.
- Atlas, S.W. ed., 2009. Magnetic resonance imaging of the brain and spine (Vol. 1). Lippincott Williams & Wilkins.
- Montagne, A., Barnes, S.R., Sweeney, M.D., Halliday, M.R., Sagare, A.P., Zhao, Z., Toga, A.W., Jacobs, R.E., Liu, C.Y., Amezcua, L. and Harrington, M.G., 2015. Blood-brain barrier breakdown in the aging human hippocampus. Neuron, 85(2), pp.296-302.
Figures
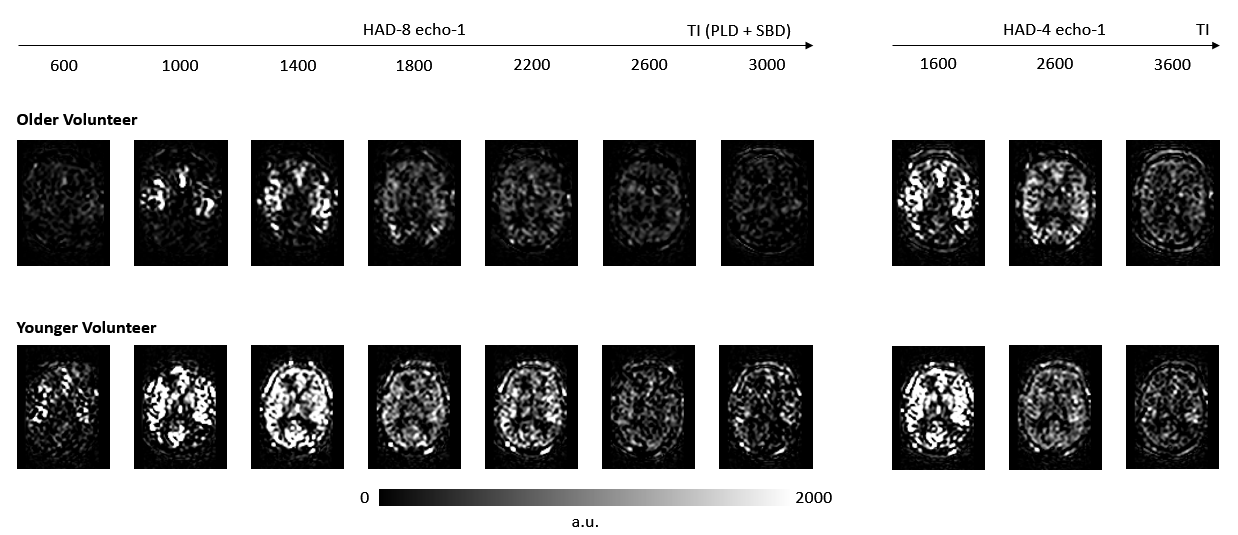
Figure-1: Representative ASL images from an older and a younger volunteer. The total data consists of ten TIs from
concatenation of HAD-8 and HAD-4. Each TI was acquired at eight different TE values.
Here only TE-1 is shown.
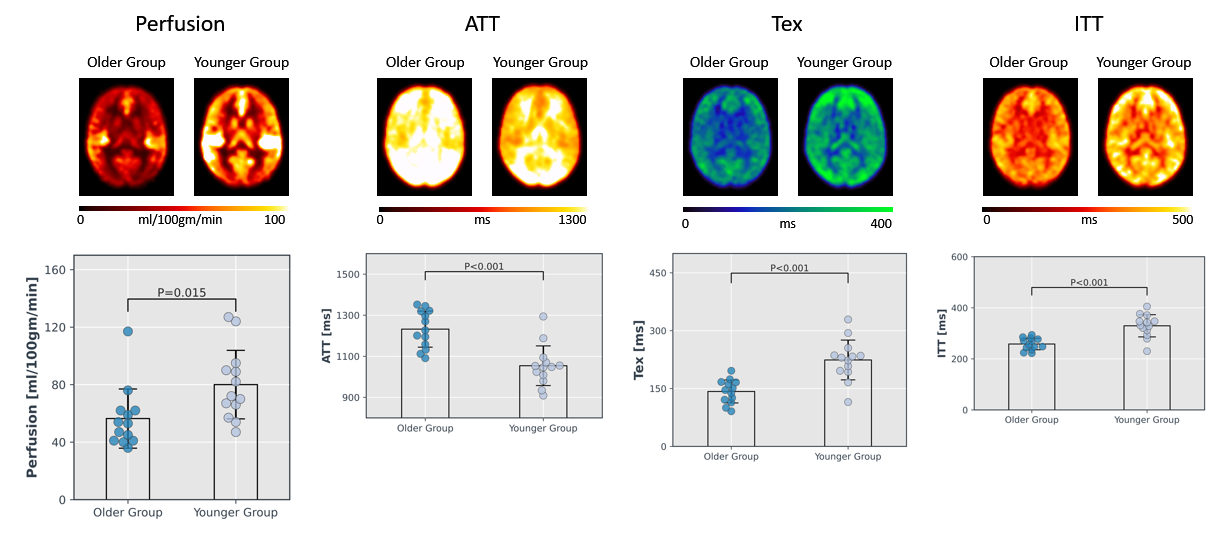
Figure-2: Group averaged parameter maps in MNI space.
Averaged gray matter values of parameters are shown in plots below.
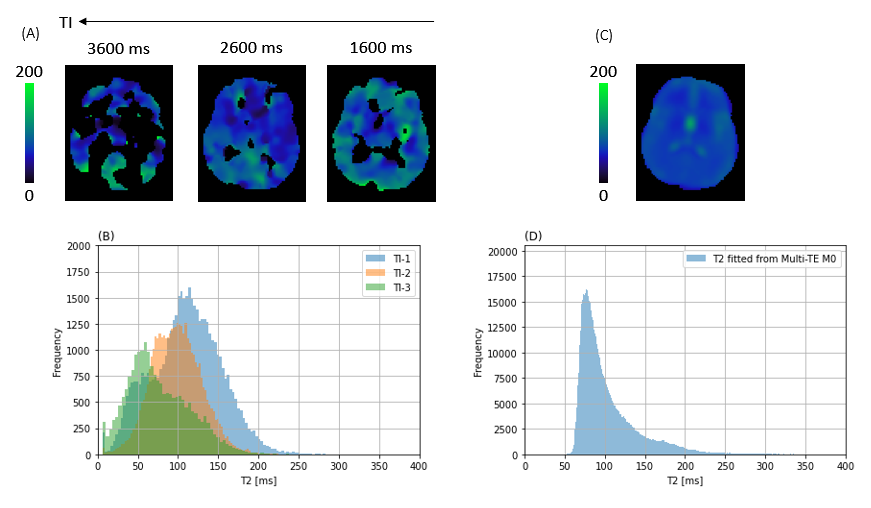
Figure-3: T2 fitted with (A,B) HAD-4 decoded ASL data (x5 voxel size smoothed) and (C,D) Multi-TE M0 data from a representative volunteer. For ASL data voxels
with r-squared > 0.9 are included. (A,B) It can be observed that T2 of the
labelled spins decreases with increasing TI, indicating that the spins moved
from blood to tissue.
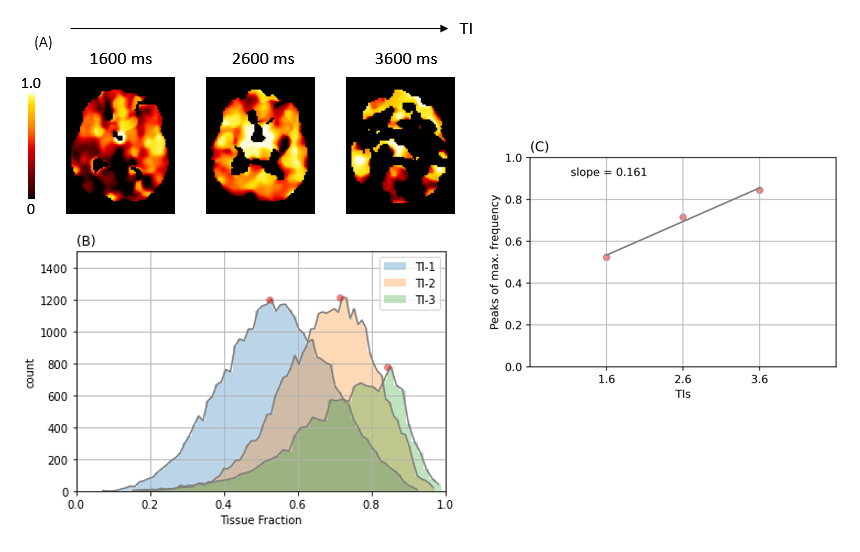
Figure-4: (A) Tissue fraction calculated at all TIs of
HAD-4 (r-squared > 0.9). (B) Frequency histogram of tissue fraction along
with their respective peaks detected. (C) The peak frequencies are fitted with
a linear model to calculate slope (Kin) representing the rate of change of tissue
fraction over TIs as a measure of BBB permeability.

Figure-5: Comparison of Kin values between the
two groups. (A) Kin was significantly lower (0.054, p < 0.001) in the older
group relative to the younger group (0.150). (B) Averaged Kin was calculated
across volunteers in each group for all three TIs and was fitted with a linear
model to estimate group Kin value. Interestingly, the older group showed a very
high tissue fraction (0.7) at the earliest TI (1600 ms) which makes the overall
slope significantly smaller (flatter) compared to the slope of the younger group.
DOI: https://doi.org/10.58530/2023/2572