2571
Comparing the Repeatability of Cerebrovascular Reserve Measured by PET and ASL using Simultaneous PET/MRI1Department of Radiology, Stanford University, Stanford, CA, United States, 2Department of Biomedical Engineering, University of California Davis, Davis, CA, United States
Synopsis
Keywords: Arterial spin labelling, Perfusion
Cerebrovascular reserve (CVR) is an important biomarker to assess vascular hemodynamics and link to the risk for acute strokes. Whilst several imaging modalities have been applied to measure CVR, their reproducibility remains to be elucidated. Here we compare the reproducibility of CVR measurements in 22 normal subjects between single and multi-delay ASL using 15O-water PET as the reference. Results implied that multi-delay ASL achieved a higher reproducibility and should be the preferred non-invasive modality for clinical applications.Introduction
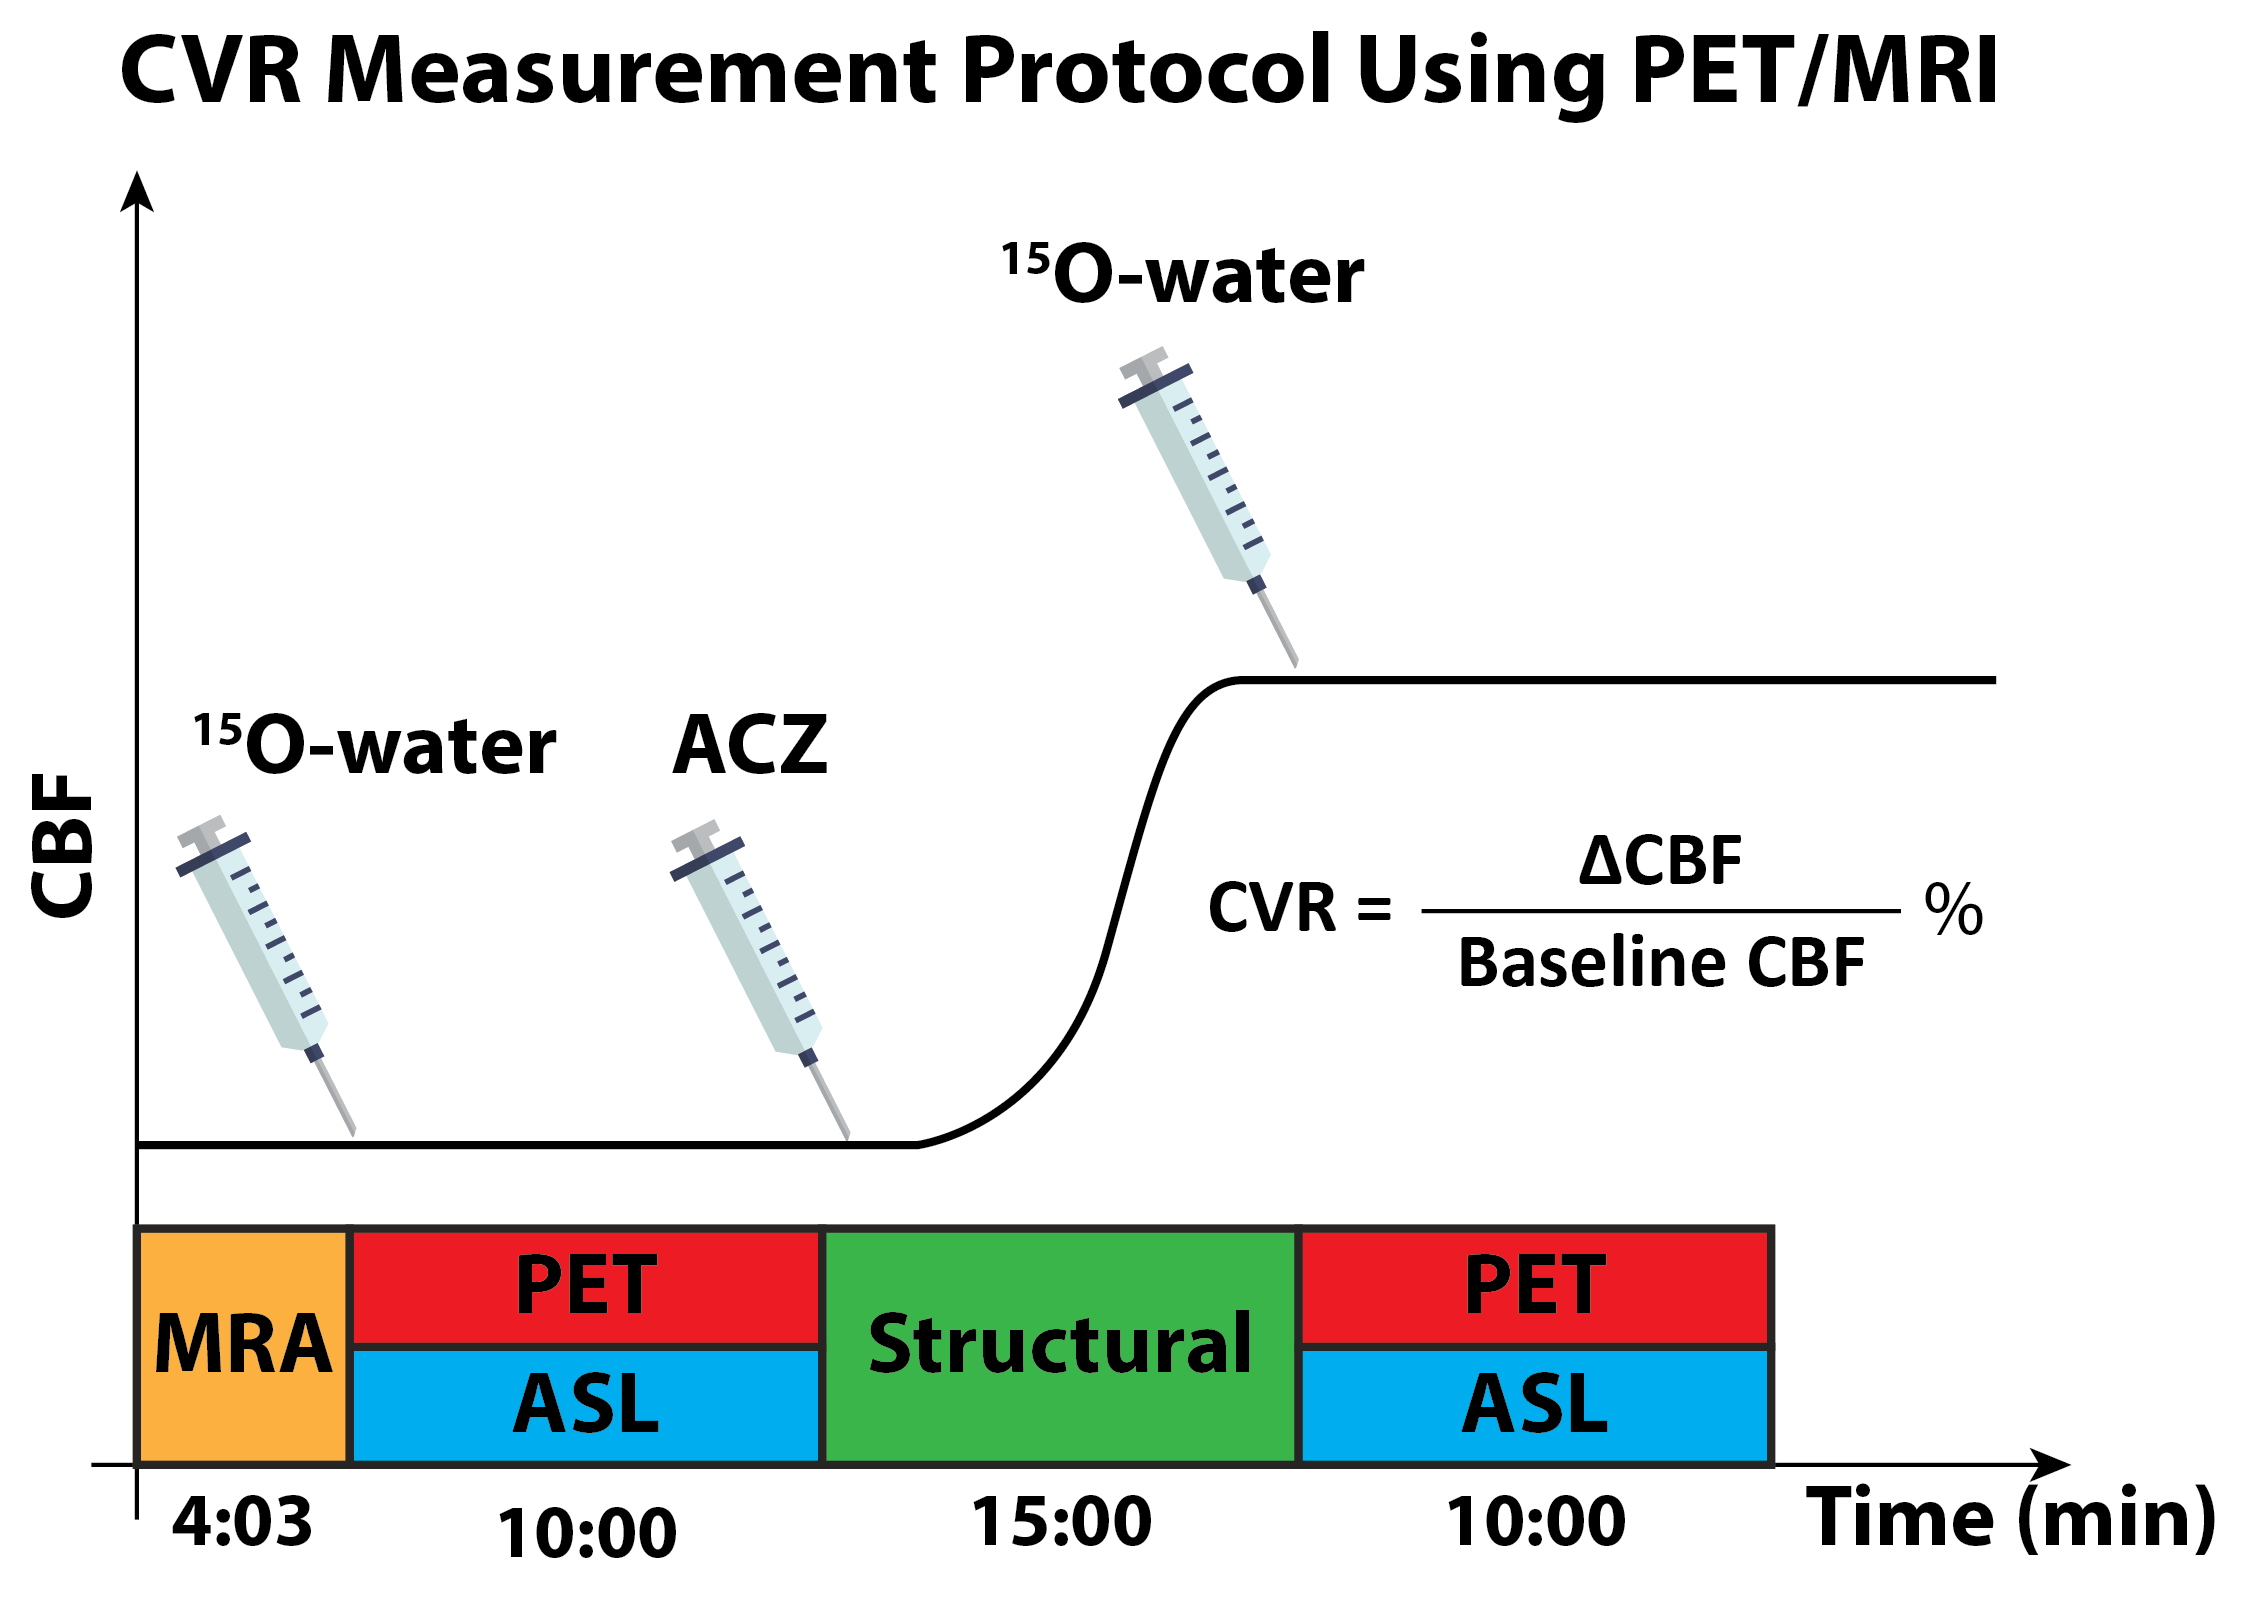
Cerebrovascular reserve (CVR) reflects the change in cerebral blood flow (CBF) in response to vasodilation. Studies have demonstrated that decreased CVR is linked with a higher risk for acute stroke [1]. CVR can be measured in a stress-test where vasodilators such as acetazolamide (ACZ) are administered to increase blood flow. Whilst 15O-water PET is the gold standard modality of CBF and CVR measurement, ASL is a non-invasive and has been applied to measure CVR induced by ACZ in patients with cerebrovascular diseases [2]. However, the reproducibility of ASL-based CVR techniques is not clear, which hinders its clinical application. Additionally, the regional CVR differences within the brain remain to be elucidated.Here, we compare the reproducibility of CVR in normal subjects measured by single-PLD and multi-PLD PCASL with the gold standard 15O-water PET using a simultaneous PET/MRI system in a test-retest study. Inter-session variations of the repeated measurements were assessed using coefficient of variation and interclass correlation coefficient for different regions of the brain.
Methods
PET and MRI data were collected from 22 healthy volunteers (mean age 33 ± 17 years, 9 males) using a simultaneous time of flight (TOF) enabled 3T simultaneous PET/MRI system (Signa, GE Healthcare, Waukesha, WI, USA) after the subjects had given written informed consent. Each subject underwent ACZ administration at a dose of 15 mg/kg of body weight with a maximum of 1g during the MRI procedures as shown in Figure 1. The imaging session was conducted twice separated by an average of 13 days, except in two cases in which the test-retest sessions were separated by more than a year due to our study being suspended during the Covid-19 lockdown. In each experiment, O15-water PET, single-PLD and multi-PLD (3 PLDs and other parameters) ASL, and a 3D T1-weighted structural image scans were acquired before and 15 minutes after ACZ administration using the parameters reported in our previous work [3].CBF from both ASL techniques was estimated by fitting the general kinetic model to the ASL difference data using the FSL tool BASIL [4], assuming the inversion efficiency of 85%, signal loss due to background suppression of 25%, and brain/blood partition coefficient of 0.9 ml/g. PET CBF was computed using the 1-compartment pharmacokinetic model and an image-derived arterial input function [5]. CVR is defined as the percentage of change in CBF from baseline CBF. All CBF and CVR images were transformed to the standard MNI space using the FSL tool FLIRT and FNIRT [6].
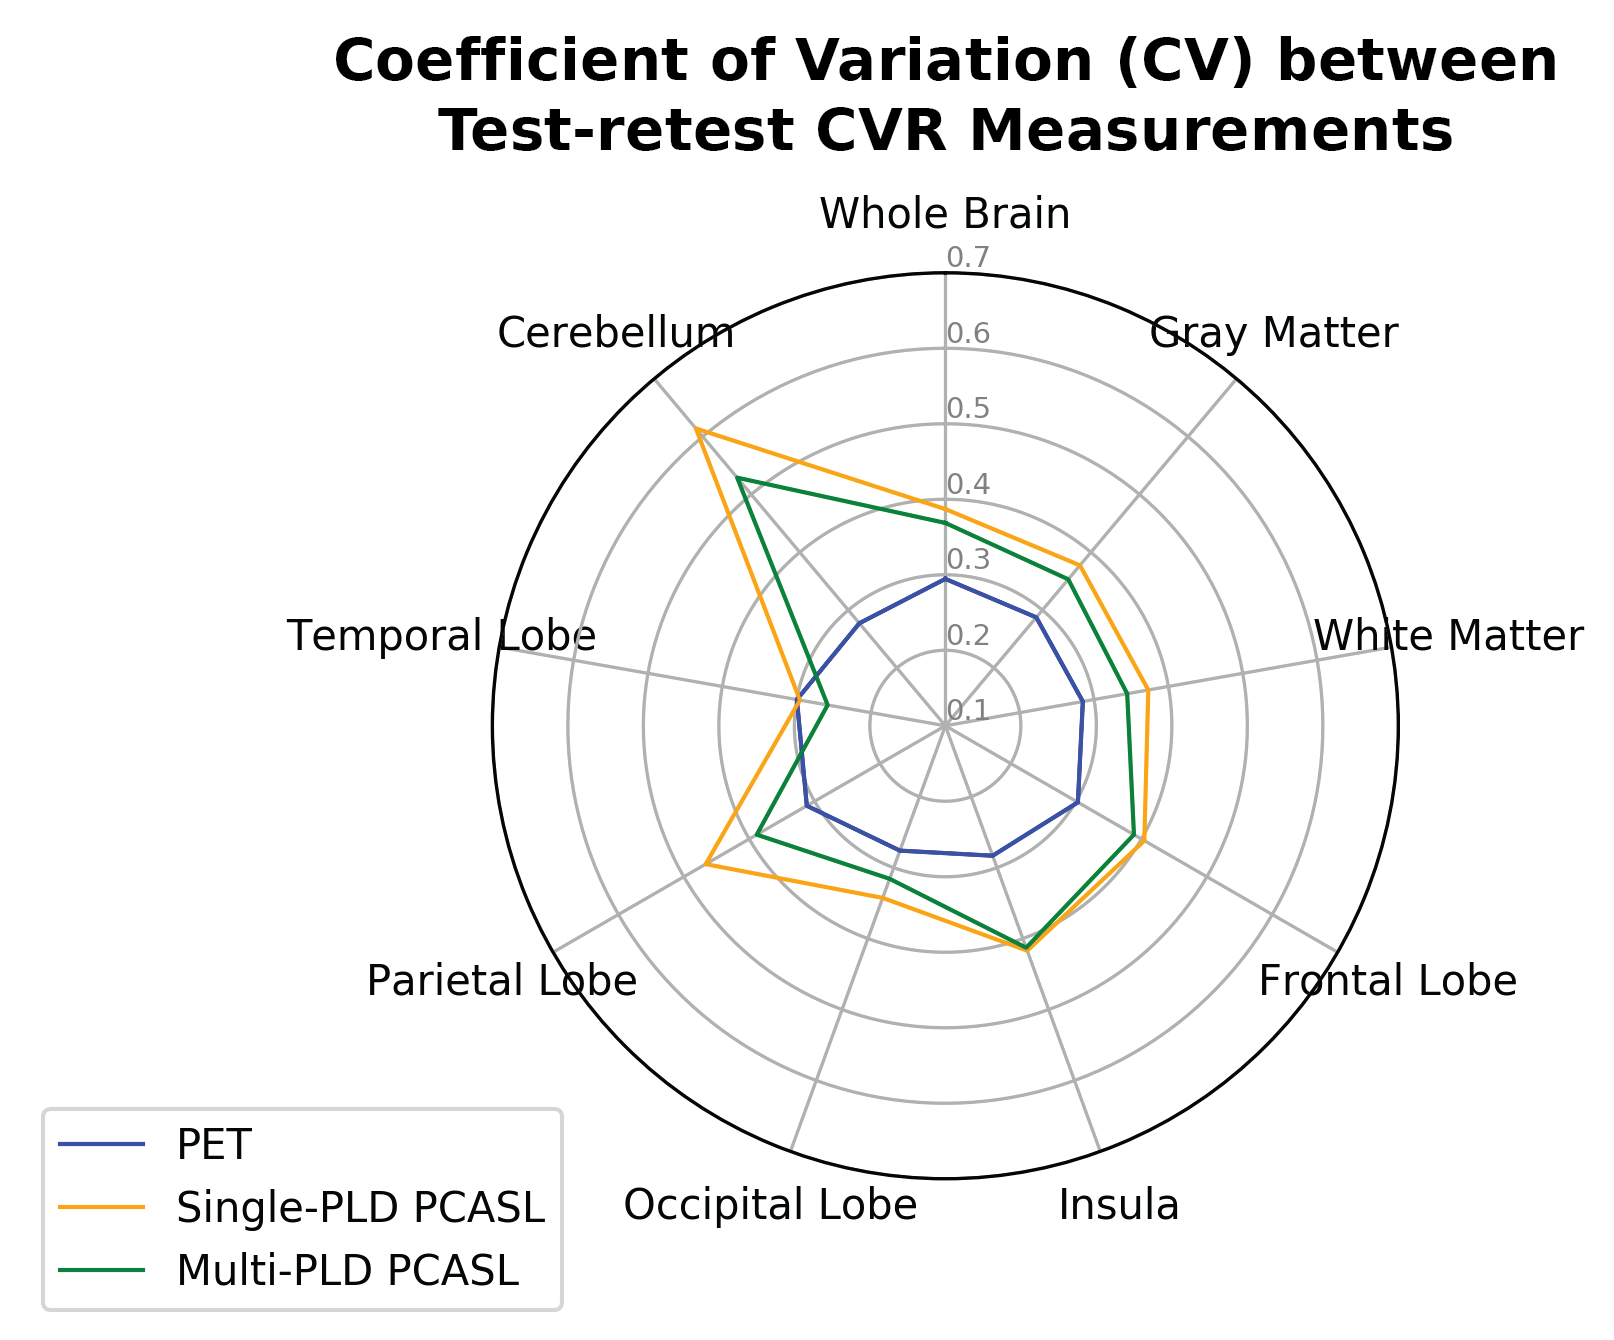
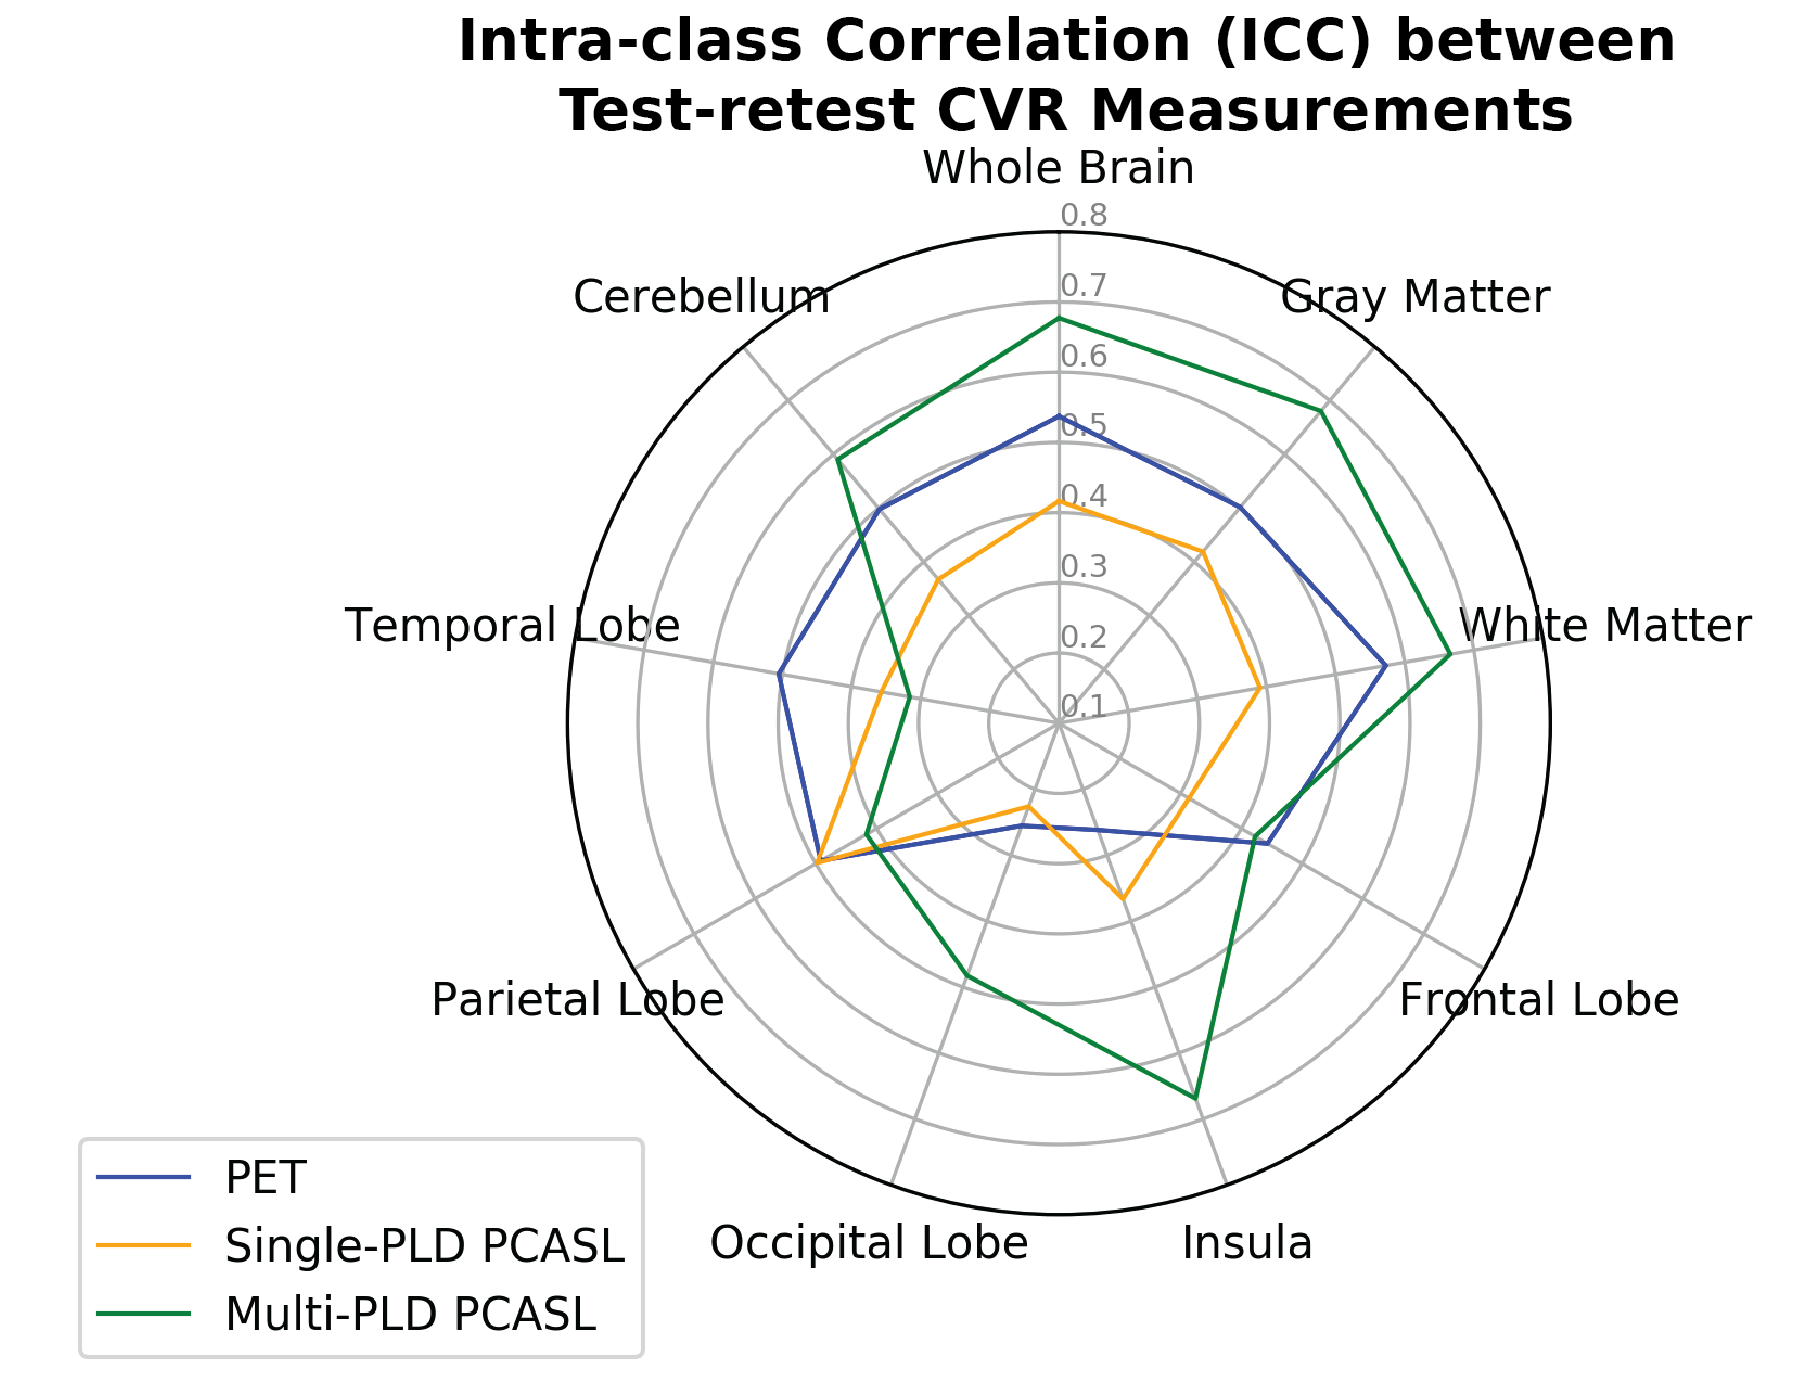
The reproducibility of CVR in different regions of the brain was assessed by computing the within-subject coefficient of variation (CV) and intra-class correlation (ICC) of the estimated CVR for PET, single-PLD and multi-PLD PCASL. CV was derived as the ratio between the standard deviation of the difference between the repeated measurements to the mean of the repeated measurements. ICC was calculated for the absolute agreement between repeated measurements. A low CV or high ICC value indicates a high repeatability.
Results
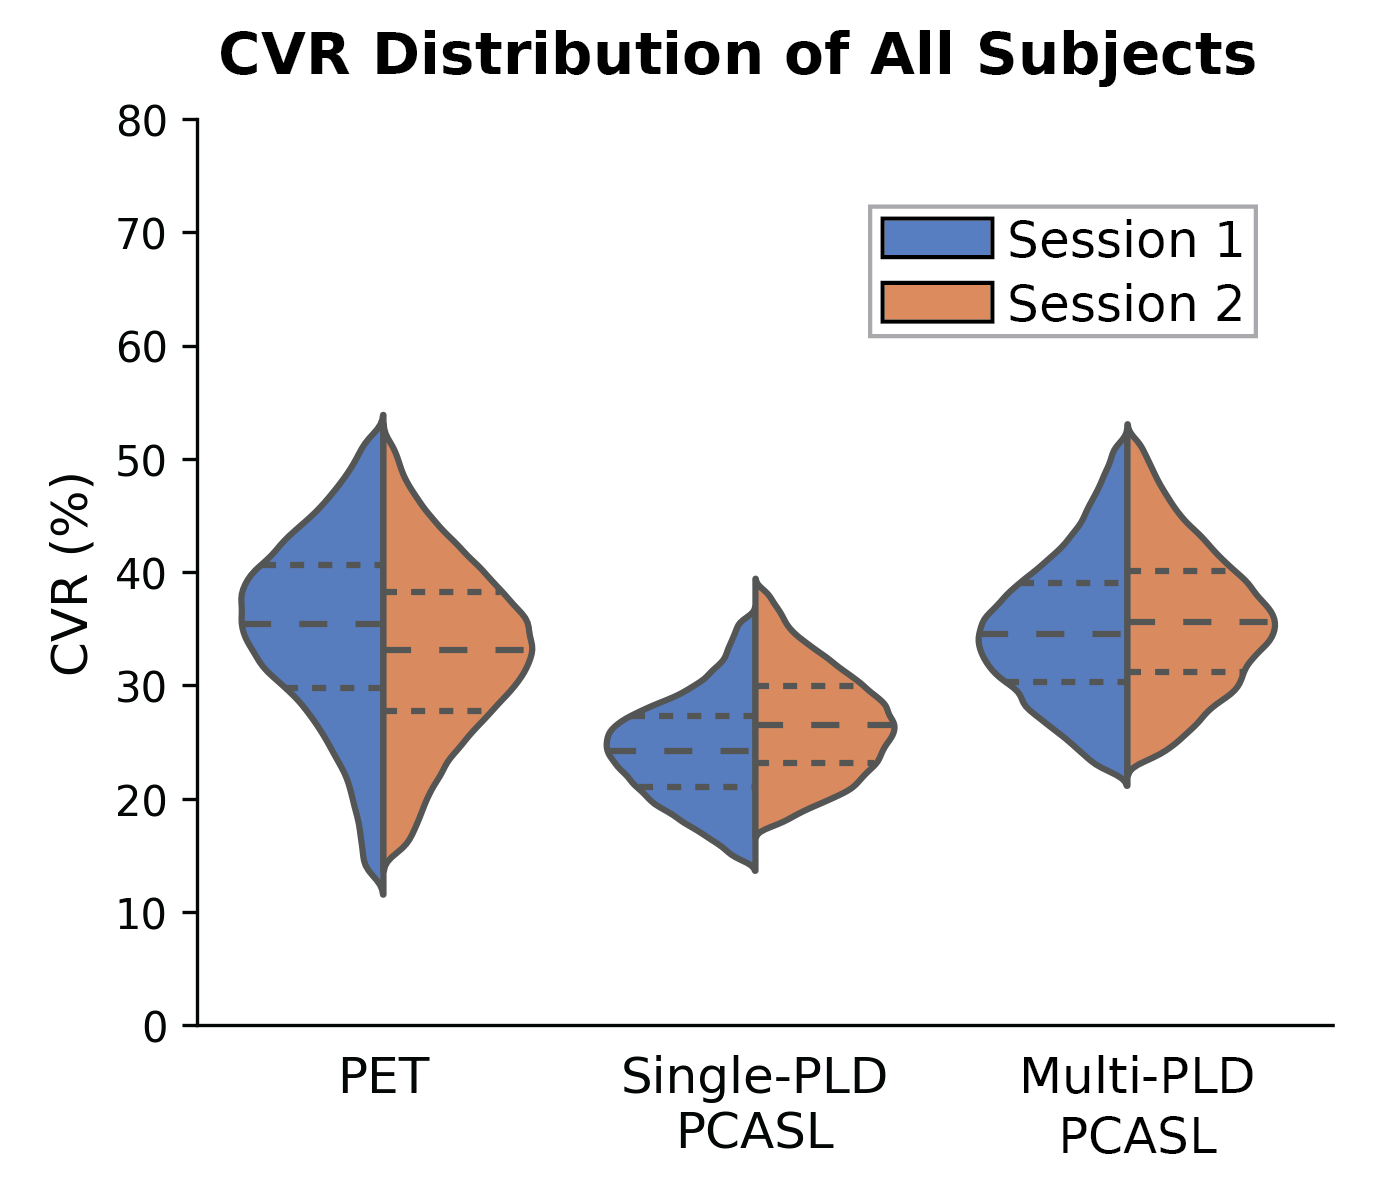
Figure 2 shows the distribution of all CVR measurements by PET and ASL in the test-retest sessions. Figure 3 shows the CV of CVR measurements in different regions of the brain measured by PET and ASL in the test-retest sessions. Figure 4 shows the ICC of CVR in different regions of the brain measured by PET and ASL in both sessions. The CVR measured by single-PLD PCASL was consistently lower than the results obtained by PET and multi-PLD PCASL in both sessions. Another distinctive feature in Figure 2 is that CVR measured by PET demonstrated higher standard deviation than the CVR distribution of ASL. The CV values of CVR in different regions in Figure 3 reveal that PET was the most reproducible technique. However, the ICC results in Figure 4 imply that multi-PLD PCASL was the most reproducible in all brain regions except temporal and parietal lobes.Discussion
The novelty of this work was to compare the reproducibility of CVR measured by single-PLD and multi-PLD PCASL using the gold standard 15O-water PET as the reference in normal subjects. The observed CV and ICC of the whole brain CVR were within the range reported in studies using BOLD MRI [7]. Comparing the two ASL techniques, the lower CV and higher ICC of multi-PLD PCASL suggested higher repeatability than that of single-PLD PCASL. Judging by the inter-session CVR difference, similar results can be observed that multi-PLD PCASL was more reproducible than single-PLD PCASL for CVR measurements. The mean CVR values of this cohort were between 10% and 50% for both sessions, which may reflect the normal range of CVR in healthy individuals. Other factors such as age and sex may potentially affect the normal CVR values and impact the interpretation of CVR in assessing the health of vascular hemodynamics, which is an area of ongoing investigation.Acknowledgements
This work is supported by the American Heart Association Grant 826254 and NIH grant R01EB025220-02.References
[1] A. P. Fan et al., “Long-Delay Arterial Spin Labeling Provides More Accurate Cerebral Blood Flow Measurements in Moyamoya Patients: A Simultaneous Positron Emission Tomography/MRI Study,” Stroke, 2017, doi: 10.1161/STROKEAHA.117.017773.
[2] Fan Audrey P. et al., “Identifying Hypoperfusion in Moyamoya Disease With Arterial Spin Labeling and an [15O]-Water Positron Emission Tomography/Magnetic Resonance Imaging Normative Database,” Stroke, vol. 50, no. 2, pp. 373–380, Feb. 2019, doi: 10.1161/STROKEAHA.118.023426.[3] M. Y. Zhao et al., “Cerebrovascular reactivity measurements using simultaneous 15O-water PET and ASL MRI: Impacts of arterial transit time, labeling efficiency, and hematocrit,” NeuroImage, vol. 233, p. 117955, Jun. 2021, doi: 10.1016/j.neuroimage.2021.117955.
[4] M. A. Chappell, A. R. Groves, B. Whitcher, and M. W. Woolrich, “Variational Bayesian Inference for a Nonlinear Forward Model,” IEEE Trans. Signal Process., vol. 57, no. 1, pp. 223–236, 2009, doi: 10.1109/TSP.2008.2005752.
[5] M. M. Khalighi et al., “Image-derived input function estimation on a TOF-enabled PET/MR for cerebral blood flow mapping,” J. Cereb. Blood Flow Metab., vol. 38, no. 1, pp. 126–135, 2018, doi: 10.1177/0271678X17691784.
[6] M. Jenkinson, C. F. Beckmann, T. E. J. Behrens, M. W. Woolrich, and S. M. Smith, “FSL,” NeuroImage, vol. 62, no. 2, pp. 782–790, 2012, doi: 10.1016/j.neuroimage.2011.09.015.
[7] M. G. Bright and K. Murphy, “Reliable quantification of BOLD fMRI cerebrovascular reactivity despite poor breath-hold performance,” NeuroImage, 2013, doi: 10.1016/j.neuroimage.2013.07.007.
Figures