2568
7T spin-echo dynamic susceptibility contrast MRI to assess cerebral microvascular perfusion1Radiology & Nuclear Medicine, Maastricht University Medical Center +, Maastricht, Netherlands, 2School for Mental Health and Neuroscience, Maastricht University, Maastricht, Netherlands, 3Neurology, Maastricht University Medical Center +, Maastricht, Netherlands, 4School for Cardiovascular Diseases, Maastricht University, Maastricht, Netherlands, 5Internal Medicine, Maastricht University Medical Center +, Maastricht, Netherlands, 6Electrical Engineering, Eindhoven University of Technology, Eindhoven, Netherlands
Synopsis
Keywords: Contrast Mechanisms, Perfusion
Ultra-high-field exploits the possibilities of MRI techniques, which are less sensitive at lower field strength, such as spin-echo (SE) perfusion MRI. We assessed the feasibility of SE dynamic susceptibility contrast MRI at 7T and investigated the ability to measure variations in perfusion in an elderly, partially hypertensive, population (n=36). Microvascular cerebral blood flow (CBF) was higher in grey matter compared to white matter, corresponding with biological expectations, serving as a first validation step. Furthermore, CBF significantly decreased with age.Introduction
The assessment of cerebral perfusion is an important clinical measurement that is mainly used for the diagnosis of several cerebrovascular diseases and for outcome prediction in neuro-oncology1.The most commonly used way to measure cerebral perfusion is by acquiring dynamic MR images after administration of a contrast agent (CA) bolus. The susceptibility changes due to the CA can be measured by the T2*-decay using a gradient-echo (GE) sequence, or alternatively, by the T2-decay using a spin-echo (SE) sequence. Consensus is the use of a GE sequence2, as it has a higher sensitivity, and therefore only requires half the amount of CA to achieve equal SNR compared to a SE sequence.
With the development of ultra-high-field MRI (≥7T), a higher spatial resolution and/or SNR can be achieved. The use of SE dynamic susceptibility contrast (DSC) MRI may become more attractive as a lower CA dose can be used and the physiological spatial resolution is narrowed by the lower extravascular (blooming) effect of SE images.
Previous studies showed that SE measurements are particularly sensitive to small vessels (up to ~10μm diameter)3,4, making this technique optimal for studying the (patho)physiology of the small vessels in the brain.
To our knowledge, the use of SE single-shot echo-planar-imaging (EPI) DSC-MRI at ultra-high-field has not yet been reported. Therefore, we investigated the feasibility of SE perfusion at 7T to assess cerebral microvascular hemodynamics in a population with and without hypertension.
Methods
Subjects:Thirty-six elderly volunteers with and without hypertension (n=18) were included. None of the subjects had neurological or neurovascular diseases (Table 1).
Image acquisition:
MR images (Table 2) were obtained using a 32-channel phased-array head coil at 7T (Siemens Healthineers, Erlangen, Germany). T1-weighted MP2RAGE and T2-weighted FLAIR sequences were acquired for anatomical reference. A precontrast bolus was administered (3 mL 1M Gadobutrol). Thereafter, a 2D SE multi-slice single-shot EPI DSC-MRI sequence was performed during the administration of a subsequent CA bolus (7 mL 1M Gadobutrol).
Data analysis:
DSC-MRI:
Images were corrected for EPI distortions (FSL topup5), and motion (FSL mcflirt6). Arterial input function (AIF) voxels were selected semi-automatically in the middle cerebral arteries based on peak height and time-to-peak signal curve characteristics.
The cerebral blood flow (CBF) was obtained according to $$$C_{t}(t)=CBF \cdot R(t) \circledast C_{AIF}(t)$$$2, using a block-circulant SVD singular value decomposition method. The cerebral blood volume (CBV) was obtained according to $$$CBV=\frac{\kappa}{\rho} \cdot \frac{\int_0^\infty C(t)dt}{\int_0^\infty C_{AIF}(t)dt}$$$2.
Signal contamination of the 10% largest blood vessels was excluded from the analysis. Perfusion maps were scaled to realistic quantitative levels, using a scaling factor based on the normalization of the perfusion measures in the white matter (WM) of controls to a reference value7.
Segmentations:
The cortical gray matter (CGM), deep gray matter (DGM), and WM were automatically segmented using Freesurfer (v6.0.5)8, followed by manual corrections, with the T1-weighted MP2RAGE and T2-weighted FLAIR images as input. Region masks were co-registered to the DSC image space (FSL flirt6).
Statistics:
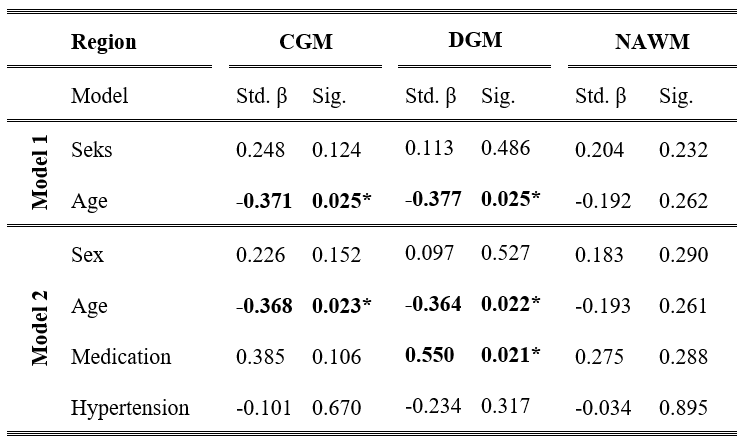
CBF ratios between CGM/WM and DGM/WM were compared with GM/WM ratios from the literature, and a one-sample t-test was performed to test whether the GM significantly differed from the WM. Additionally, multivariable linear regression analyses were performed to assess the relation of CBF with age. Finally, this analysis was adjusted for hypertension status (yes/no) and medication usage (yes/no) to investigate the feasibility of measuring pathophysiological conditions and to assess the effect of antihypertensive medication. All analyses were adjusted for sex.
Results
Higher CBF was found in CGM and DGM compared to WM (CGM/WM CBF = 1.60±0.18, p<0.001; DGM/WM CBF = 1.67±0.22, p<0.001). Both CBFCGM and CBFDGM showed a negative association with age, even after adding hypertension status and medication usage to the analysis (Figure 2, Table 3). CBF was lower in subjects with hypertension and higher when using antihypertensive medication. Though all regions showed the same dependence, only the association between medication and CBFDGM was highly significant. No associations were found in the WM.Discussion
We assessed the feasibility of SE-EPI DSC-MRI at ultra-high-field strength (7T) and investigated the ability to measure pathophysiological variations in a partially hypertense population.The higher perfusion in the CGM and DGM compared to WM agreed with literature reporting CBF ratios using GE DSC-MRI (GM/WM CBF = 1.93–3.3)9,10, suggesting our measurement method is valid. The ratios we found using SE DSC-MRI were lower compared to these studies. An explanation could be the reduced sensitivity of SE to relatively large vessels, which particularly influences the GM/WM ratio as most of them reside in the GM.
CBF was found to decrease with age, which agreed with our expectations based on literature11,12. Our study looking into pathophysiological changes in the cerebral microvasculature revealed no effect of hypertension status on the CBF, but showed a positive effect on antihypertensive medication in the DGM. Further research in a larger, more severely diseased population should be performed to further evaluate the ability of SE DSC-MRI pathophysiological purposes.
Conclusion
We showed the feasibility of 2D SE multi-slice single-shot EPI DSC-MRI at 7T to measure cerebral microvascular perfusion. Our results demonstrate that SE perfusion decreases with age in the GM, and furthermore, increases in the DGM with respect to medication usage in hypertensive subjects.Acknowledgements
This work was supported by the Stichting de Weijerhorst Foundation, and is part of the program Translational Research 2 with project number 446002509, funded by ZonMw/Epilepsiefonds.References
1. Petrella JR, Provenzale JM. MR Perfusion Imaging of the Brain. Am J Roentgenol. 2000;175(1):207-219.
2. Østergaard L. Principles of cerebral perfusion imaging by bolus tracking. J Magn Reson Imaging. 2005;22(6):710-717.
3. Boxerman J, Hamberg L, Rosen B, Weisskoff R. Mr contrast due to intravascular magnetic susceptibility perturbations InterEditions/CNRS Editions, Paris, InterEditi. Magn Reson Med. 1995;34:555–566.
4. Schmiedeskamp H, Straka M, Newbould RD, et al. Combined spin- and gradient-echo perfusion-weighted imaging. Magn Reson Med. 2012;68(1):30-40.
5. Andersson JLR, Skare S, Ashburner J. How to correct susceptibility distortions in spin-echo echo-planar images: application to diffusion tensor imaging. Neuroimage. 2003;20(2):870-888.
6. Jenkinson M, Bannister P, Brady M, Smith S. Improved Optimization for the Robust and Accurate Linear Registration and Motion Correction of Brain Images. Neuroimage. 2002;17(2):825-841.
7. Kellner E, Breyer T, Gall P, et al. MR evaluation of vessel size imaging of human gliomas: Validation by histopathology. J Magn Reson Imaging. 2015;42(4):1117-1125.
8. Fischl B, Salat DH, Busa E, et al. Whole brain segmentation: Automated labeling of neuroanatomical structures in the human brain. Neuron. 2002;33(3):341-355.
9. Grandin CB, Bol A, Smith AM, Michel C, Cosnard G. Absolute CBF and CBV measurements by MRI bolus tracking before and after acetazolamide challenge: Repeatabilily and comparison with PET in humans. Neuroimage. 2005;26(2):525-535.
10. Bjørnerud A, Emblem KE. A fully automated method for quantitative cerebral hemodynamic analysis using DSC-MRI. J Cereb Blood Flow Metab. 2010;30(5):1066-1078.
11. Braz ID, Fisher JP. The impact of age on cerebral perfusion, oxygenation and metabolism during exercise in humans. J Physiol. 2016;594(16):4471-4483.
12. Tarumi T, Zhang R. Cerebral blood flow in normal aging adults: cardiovascular determinants, clinical implications, and aerobic fitness. J Neurochem. 2018;144(5):595-608.
Figures
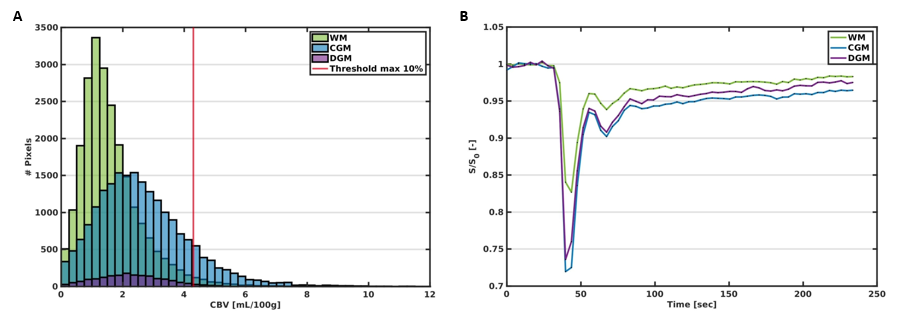
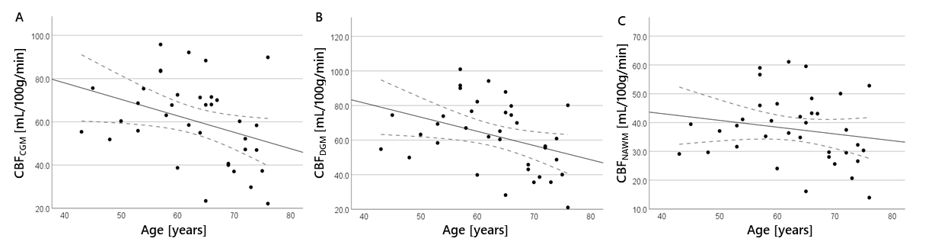
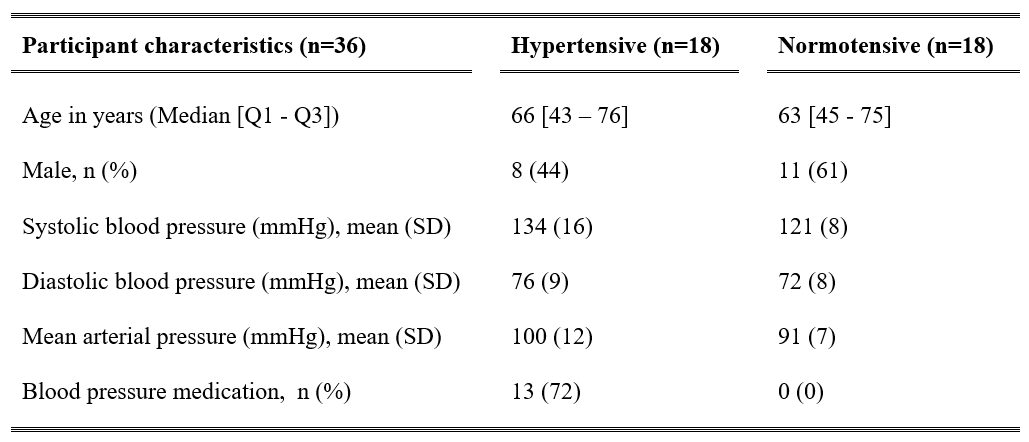
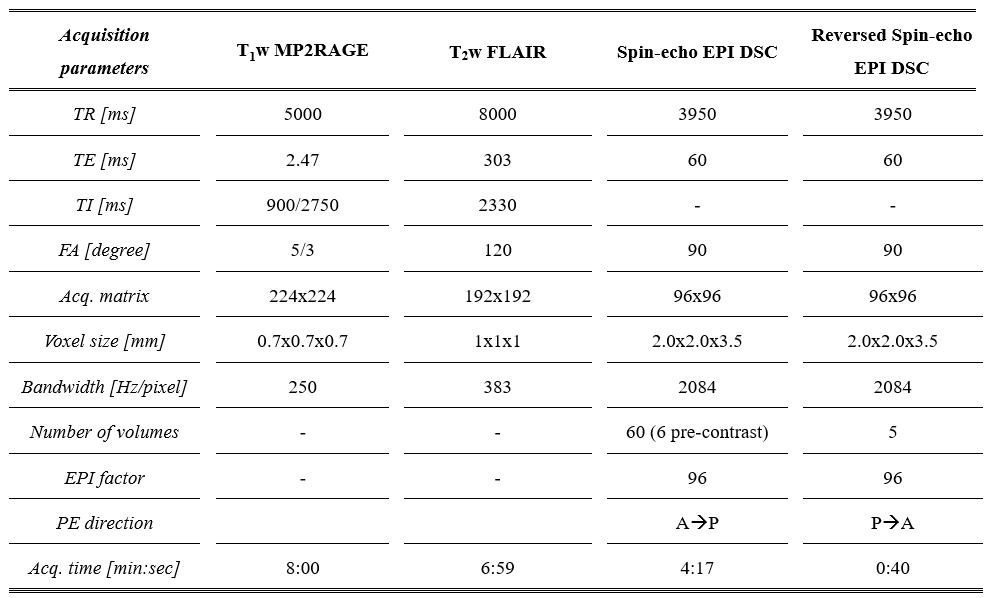
Table 2: Acquisition parameters of the imaging protocol.
*MP2RAGE, magnetization-prepared 2 rapid acquisition gradient echo; FLAIR, fluid attenuated inversion recovery; DSC, dynamic susceptibility contrast; EPI, echo planar imaging; TR, repetition time; TE, echo time; TI, inversion time; FA, flip angle; PE, phase encoding; P, posterior; A, anterior.