2567
Longitudinal assessment of variability in a multicenter MRI QC program using the CaliberMRI breast phantom: protocol adherence and ADC values1University of California San Francisco, San Francisco, CA, United States, 2CaliberMRI, Boulder, CO, United States, 3National Institute of Standards and Technology, Boulder, CO, United States, 4Oregon Health & Science University, Portland, OR, United States, 5Moffitt Cancer Center, Tampa, FL, United States, 6Columbia University Medical Center, New York, NY, United States, 7University of California San Diego, San Diego, CA, United States, 8University of Minnesota Medical School, Minneapolis, MN, United States, 9University of Michigan Health System, Ann Arbor, MI, United States, 10Boulder Labs, Boulder, CO, United States
Synopsis
Keywords: Breast, Diffusion/other diffusion imaging techniques
CaliberMRI’s multiparametric quantitative breast MRI phantom was scanned with a standard protocol, including DWI, at seven clinical sites as part of a quality control program. Protocol adherence was assessed. ADC values for fibroglandular and malignant breast tissue DWI mimics were calculated and corrected for temperature using the qCal software, and summary reports were generated. Inter- and intra-site variations in ADC derived from DWI phantom scans acquired longitudinally over the last 16 months provided information that can be used to troubleshoot imaging acquisition issues with sites and vendors as part of a phantom-based QC program.Background
Quantitative MRI biomarkers measured from diffusion-weighted imaging (DWI), including the apparent diffusion coefficient (ADC), show promise for predicting treatment response in studies of neoadjuvant therapy for breast cancer1. A challenge with breast DWI is acquiring artifact-free images with sufficient SNR for accurate ADC measurements. This is exacerbated in multicenter clinical trials, where scans may be performed at different field strengths, on scanners manufactured by different vendors and using different breast RF coils. Quantitative MRI phantoms allow standardized measurements to be compared longitudinally across sites and vendors2.A breast phantom-based quality control (QC) program using the CaliberMRI Breast Standard Model 131 (CaliberMRI, Boulder CO) was implemented in the I-SPY2 trial, a multicenter clinical trial for breast cancer patients using MRI to assess treatment response. The phantom, developed in collaboration with UCSF and NIST3, includes T1 and diffusion subunits (Figure 1) for assessing the accuracy of multiple quantitative MRI measurements, including ADC measurements from DWI. An MRI-readable liquid crystal (LC) thermometer integrated in the DWI subunit allows the internal temperature to be measured during data acquisition. This enables correction for the temperature dependence of the ADC values of tissue mimics, which span the range from fibroglandular to malignant breast tissue. The corrected ADCs are compared to National Institute of Standards and Technology (NIST)-certified reference values4.
This study evaluated protocol adherence and variability in ADC measurements for phantom scans performed as part of a multicenter phantom-based QC program.
Methods
Seven sites performed phantom MRI QC studies over a 16-month period. The I-SPY2 patient MRI acquisition protocol was modified for the phantom scans. Sites scanned the phantom at ambient temperature in the same breast coil used for patient scans and acquired T1-weighted images and DWI (b=0,800), repeated four times. Non-fat-suppressed T1-weighted images were used to visualize the internal LC thermometer. Phantom external temperature was also recorded.Scans were reviewed for protocol adherence. Phantom images were analyzed using CaliberMRI’s cloud-based qCal software, which automatically calculated temperature-corrected ADC values and percent bias (%-bias) relative to NIST reference values for all tissue mimics4. ADC values for the fibroglandular tissue mimic (polyvinylpyrrolidone, PVP10, higher ADC, four tubes), the malignant tissue mimic (PVP25, lower ADC, two tubes), and distilled water (highest ADC, one tube) were evaluated.
Results
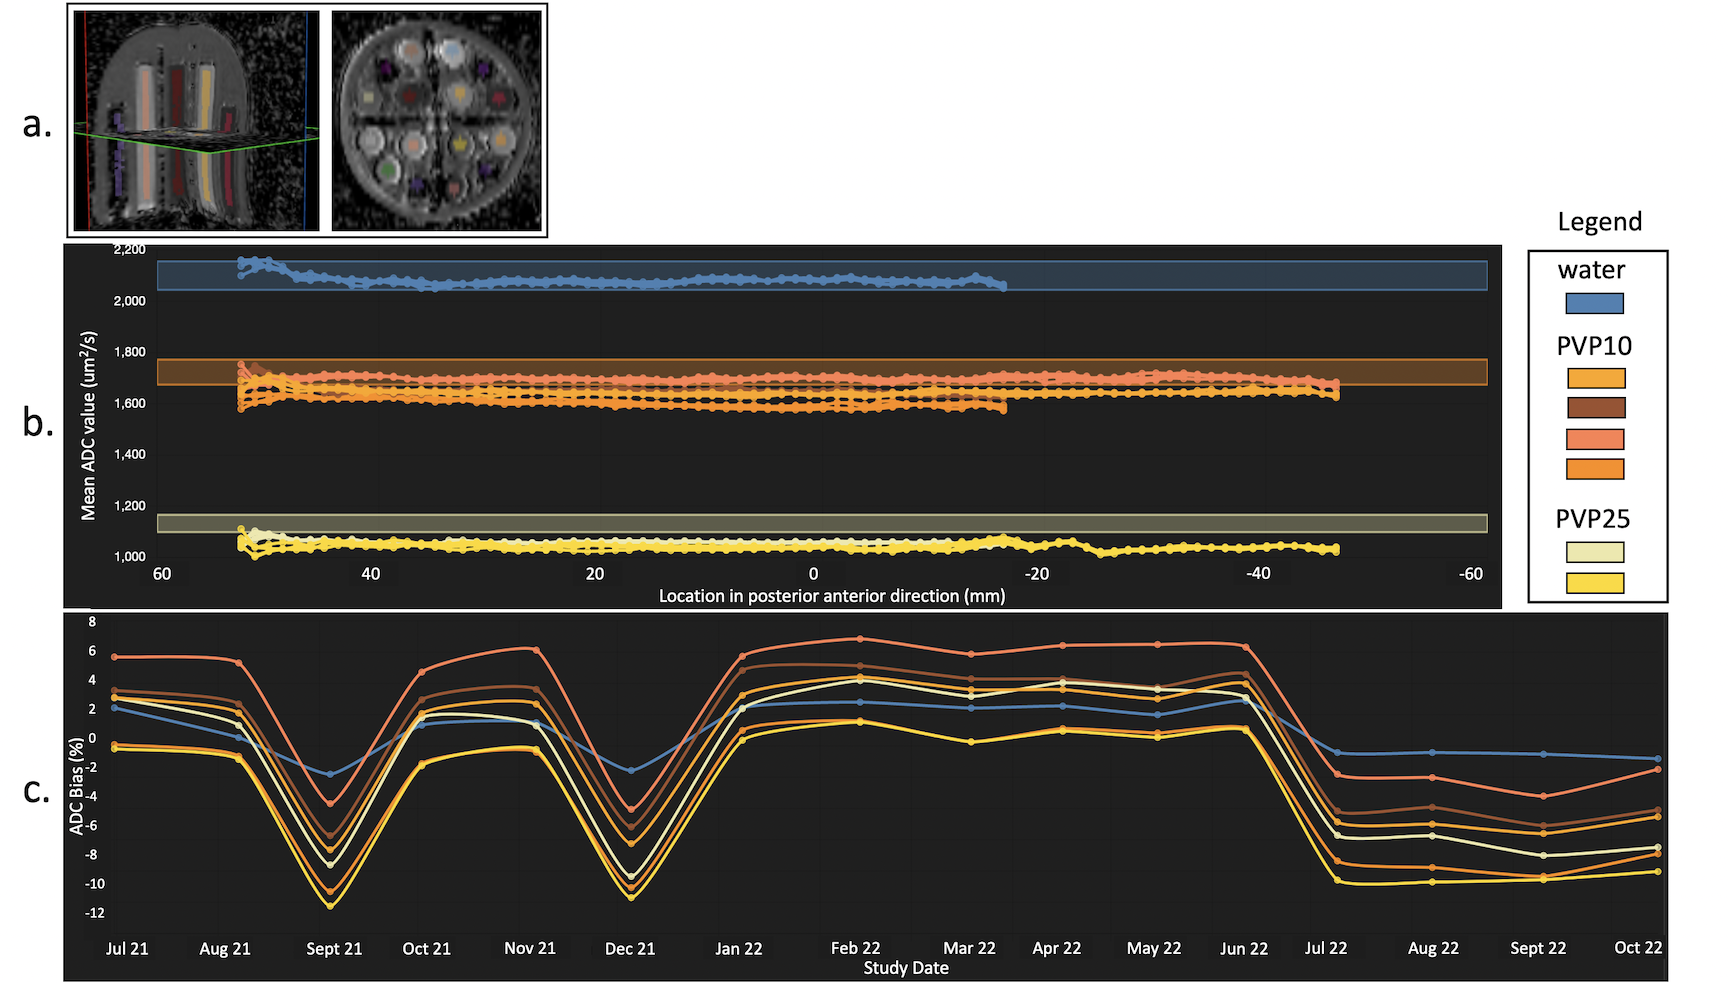
Seven sites submitted a total 44 phantom scans representing three scanner vendors (GE, Philips, Siemens), acquired at either 1.5T or 3T. The number of scans submitted by each site varied from one to a maximum of 16, with two sites performing monthly calibration scans (16 scans Site B, 15 scans Site D). Protocol adherence was ≥95% for 12 of 16 scan parameters (Table 1). Parameters with adherence rate <95% were: frequency direction (86%), phase direction (86%), matrix in frequency direction (89%), and number of slices (64%).ADC %-bias varied between sites. Figure 2 shows images and plots for Site B, which demonstrated tight clustering of ADC values for repeat measurements in PVP10 and PVP25 tubes. Figure 2a shows DWI images and regions of interest (ROIs) generated in qCal. Figure 2b shows mean ADC values plotted for one phantom scan moving in the posterior to anterior direction for the subset of tubes containing tissue mimics and water. ADC values show minimal spatial variation in the AP direction relative to scanner isocenter. Longitudinal data (Figure 2c) show ADC %-bias (ranging from -10% to +7%) for tissue mimics and water for all phantom scans submitted by Site B.
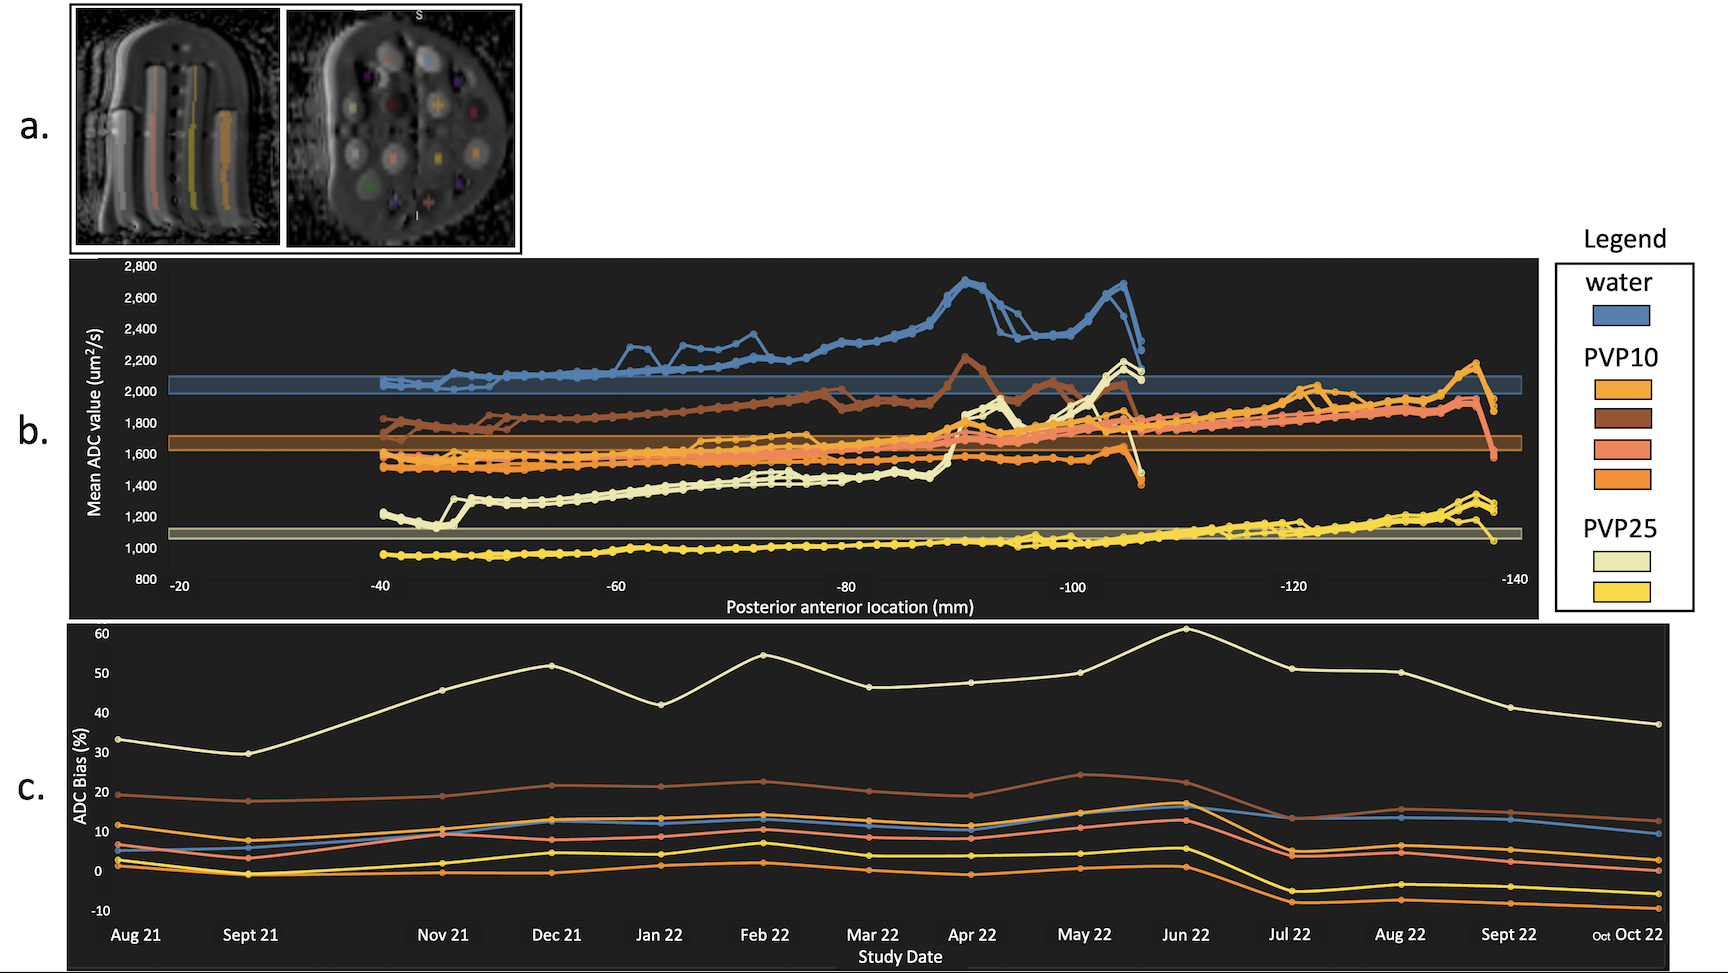
Figure 3a shows DWI images from Site D. This site showed greater variation in ADC %-bias. Figure 3b shows spatial variation in the AP direction for one phantom scan. Figure 3c shows longitudinal variation for all scans submitted by Site D, with %-bias ranging from -7% to +60% for tissue mimics and water. One PVP25 tube (tumor mimic) showed a wider %-bias range (+30% to +60%) compared to other mimics, which had a combined range of (-7% to +25%).
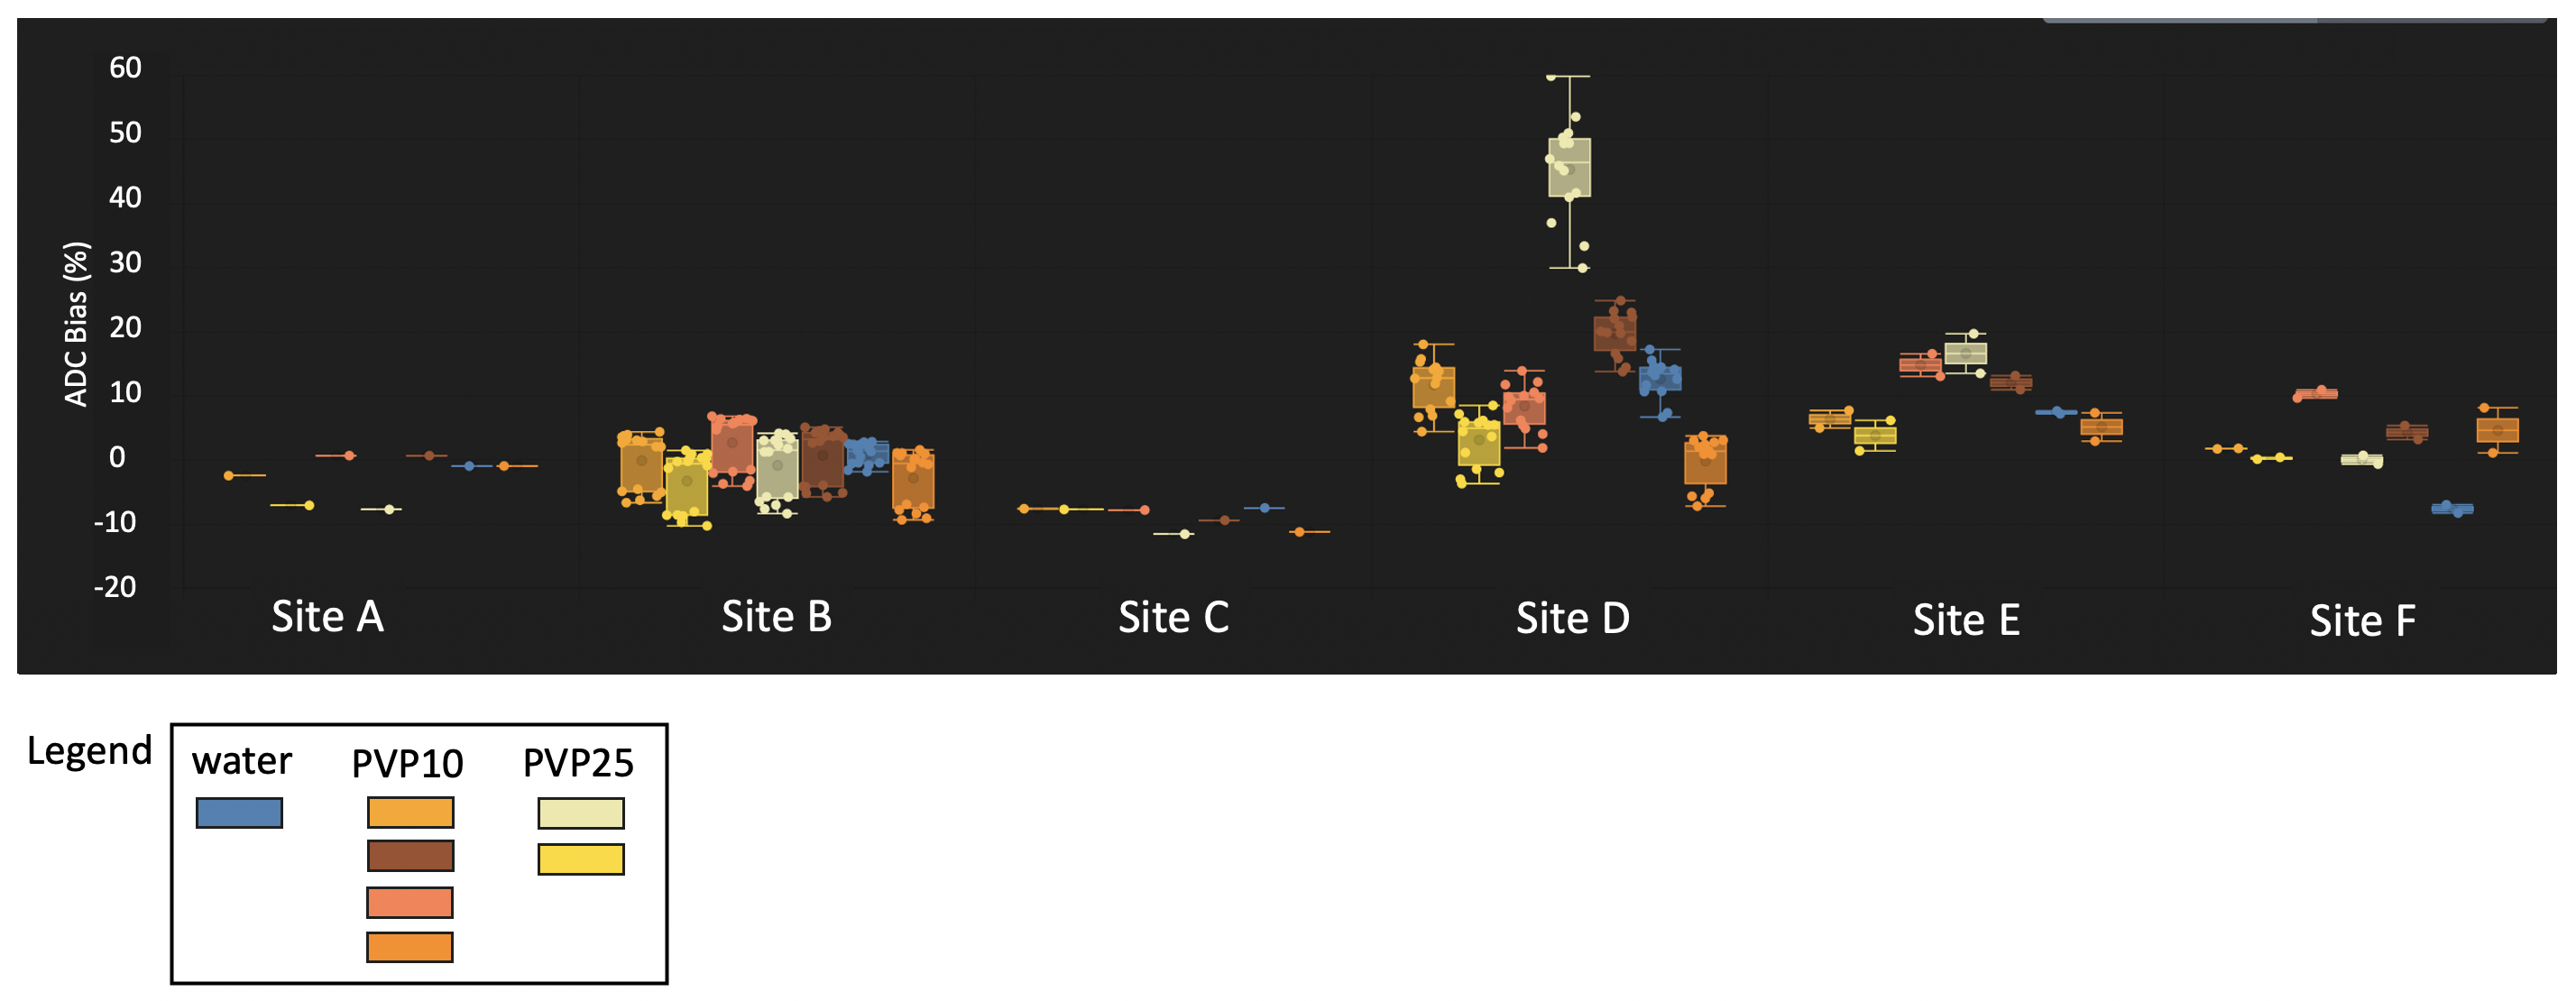
Figure 4 shows ADC %-bias for six I-SPY2 clinical sites. Data from one site could not be analyzed due to signal saturation on DWI images. Percent bias is summarized for tubes containing PVP10, PVP25 and water for the phantom scans processed for each site to date, with %-bias ranging from -12% to +60%.
Discussion
Overall adherence to the standardized scan protocol was high. The longitudinal data provided information on variability in ADC %-bias between sites and over time. While site B had minimal bias in ADC, small fluctuations (less than +/- 10%) between positive and negative bias at different time points were observed. ADC spatial variations in the AP direction for site D may be due to correctable scanner gradient non-linearity effects5. Temperature calibration errors or DWI distortion due to eddy currents or B0 inhomogeneity may also have contributed to bias at sites.Conclusion
Variations in accuracy of ADC measurements between and within sites were observed although protocol adherence was high. This illustrates the need for monitoring and troubleshooting of scanner- and sequence-specific issues to reduce bias and variability that could impact clinical ADC measurements and evaluation of treatment response. Expansion of the phantom QC program to additional I-SPY2 sites is underway.Acknowledgements
National Institutes of Health Grants: U01CA225427, 1R44CA235820, R01CA190299References
1. Partridge SC, Zhang Z, Newitt DC, et al. Diffusion-weighted MRI Findings Predict Pathologic Response in Neoadjuvant Treatment of Breast Cancer: The ACRIN 6698 Multicenter Trial. Radiology. 2018;289(3):618-627. doi:10.1148/radiol.2018180273.
2. Keenan, K. E. et al. Quantitative magnetic resonance imaging phantoms: A review and the need for a system phantom. Magn. Reson. Med. 79, 48–61 (2018).
3. Keenan KE, Wilmes LJ, Aliu SO, Newitt DC, Jones EF, Boss MA, Stupic KF, Russek SE, Hylton NM. 2016. Design of a breast phantom for quantitative MRI. Journal of Magnetic Resonance Imaging, 44(3):610-619.
4. Imaging Phantoms and Software for qMRI Standardization- CaliberMRI. https://qmri.com/.
5. Malyarenko, D.I. et al. QIN DAWG Validation of Gradient Nonlinearity Bias Correction Workflow for Quantitative Diffusion-Weighted Imaging in Multicenter Trials. Tomography. 2016 Dec;2(4):396-405.
Figures
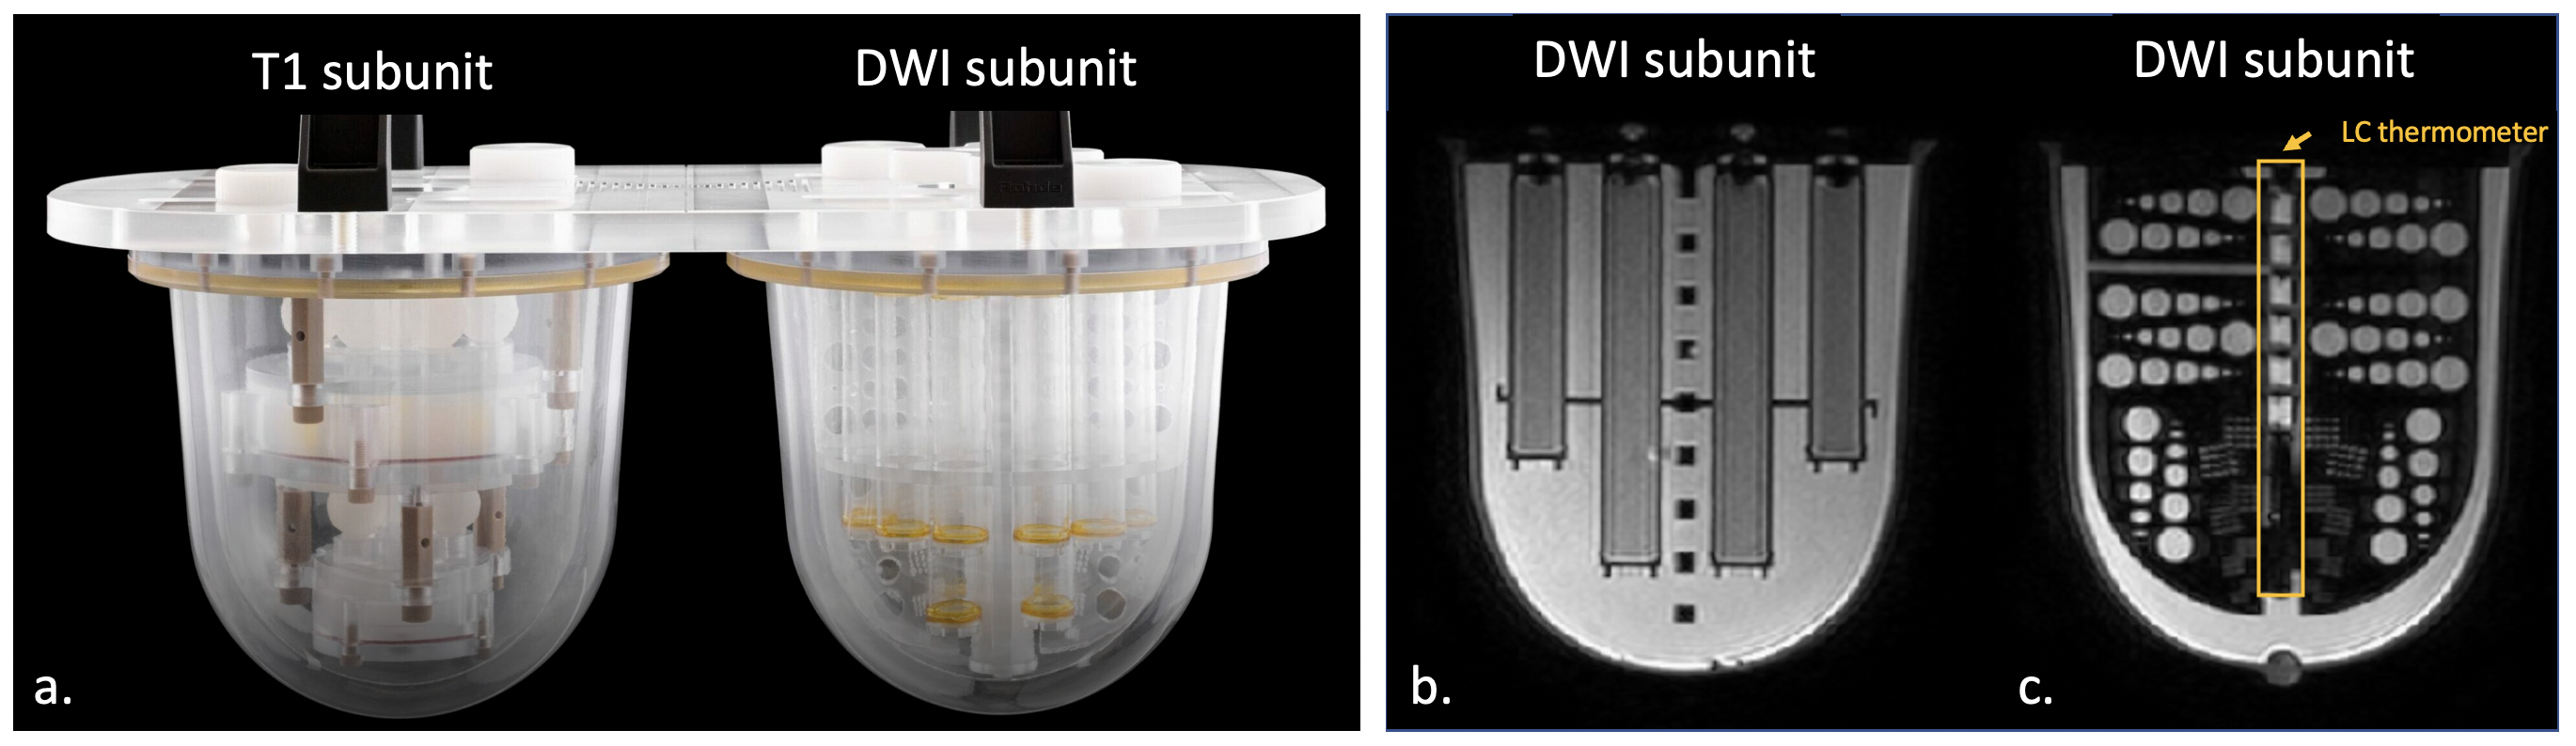
Figure 1. CaliberMRI breast phantom showing T1 subunit and DWI subunit. T1-weighted axial images of DWI subunit showing b) tubes containing various PVP concentration tissue mimics and c) the central slice containing the distortion plate and internal LC MR-readable thermometer (yellow rectangle). In this example, 6 out of 10 LC cells are visible, indicating a phantom temperature of 20.9°C (+/- 1°C).
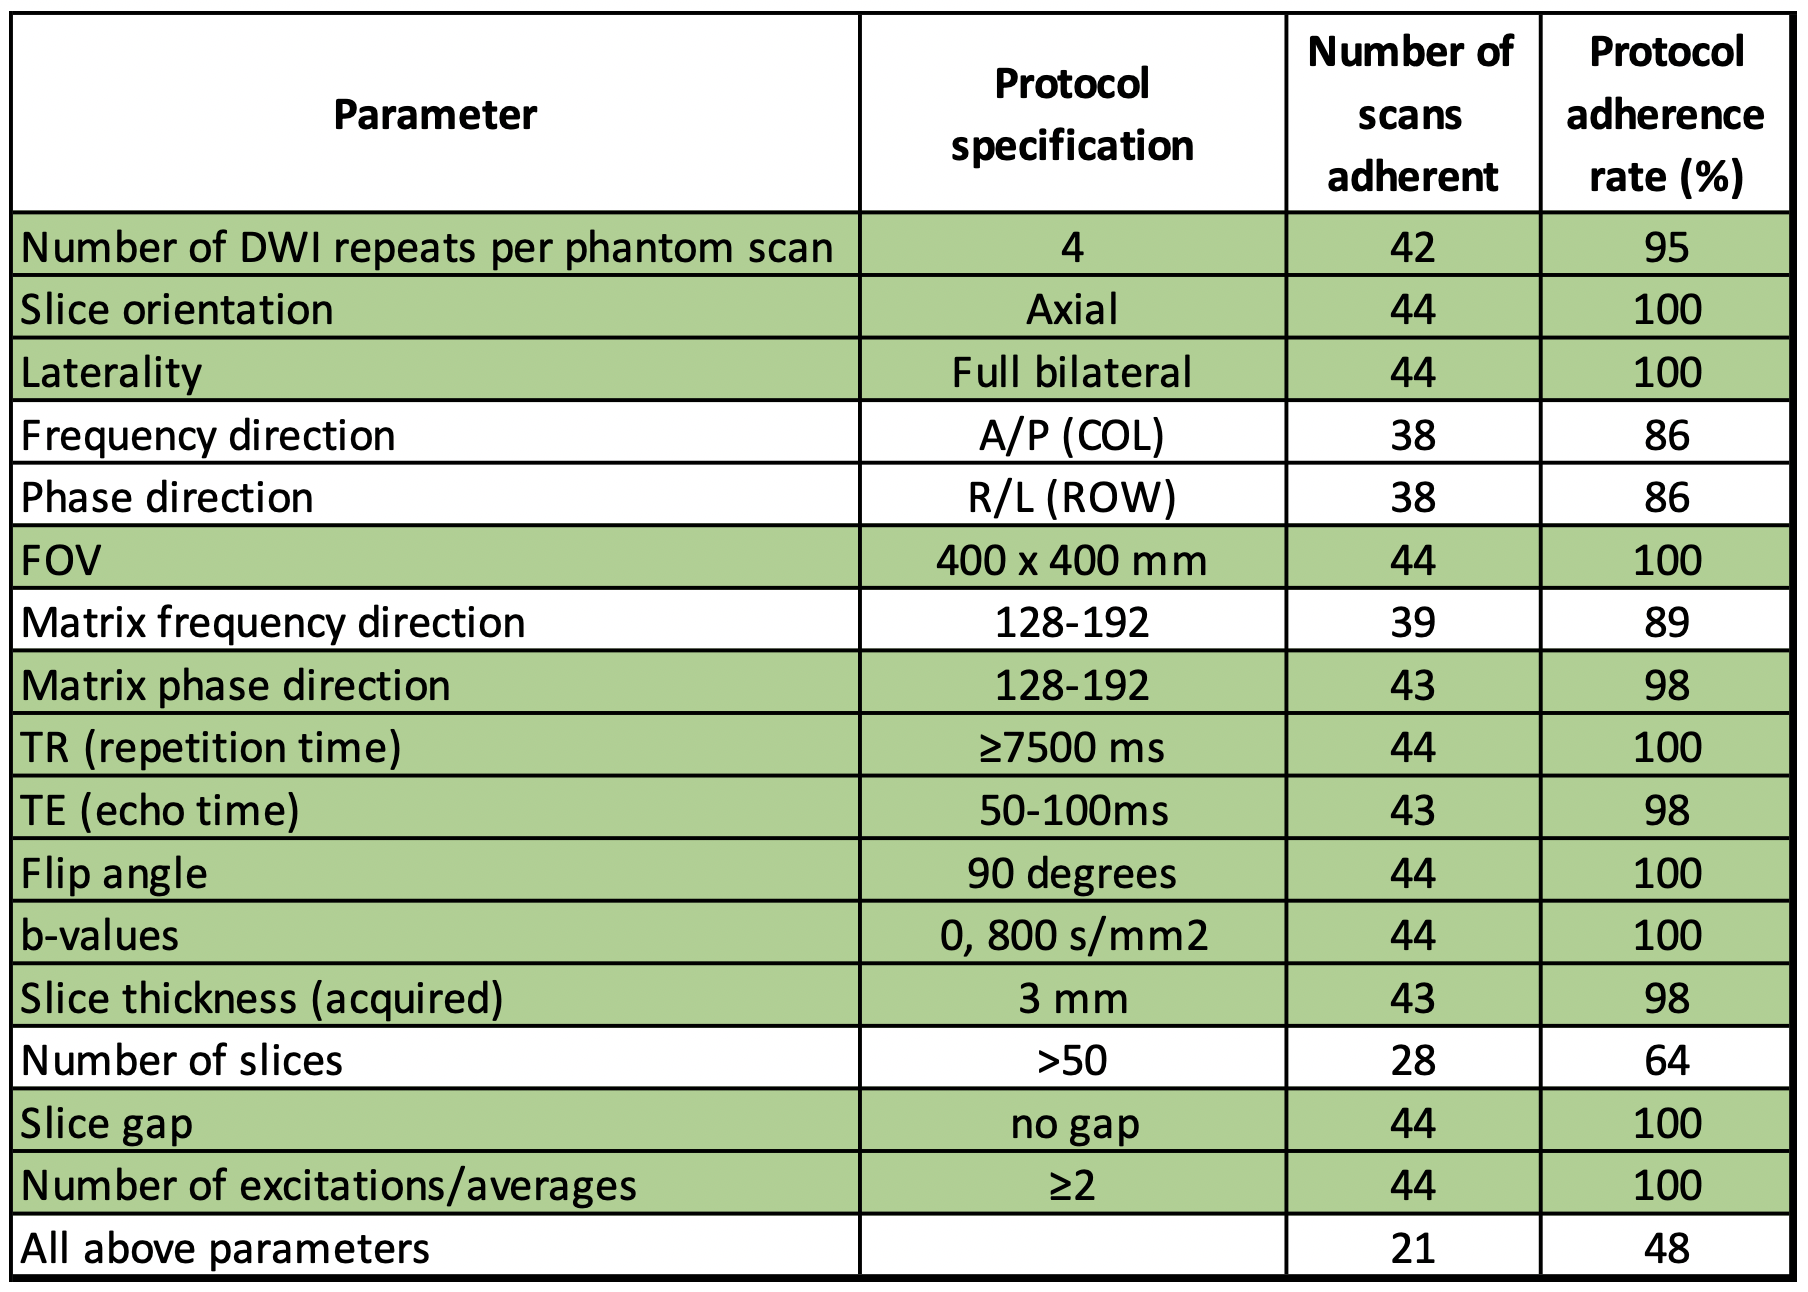
Table 1. Adherence to standard DWI scan protocol for 44 phantom scans submitted by seven sites. 21 scans were fully protocol adherent for all parameters in the table. 12 of 16 parameters (shaded green) had adherence rates ≥95%. Number of slices, specified as >50 per protocol, was adherent in 64% of scans. For 42 scans (98%), the number of slices was ≥47 slices.