2565
Image quality ranking for breast diffusion-weighted MRI in a multi-center clinical trial
Wen Li1, Julia Carmona-Bozo1, Lisa J Wilmes1, Natsuko Onishi1, Jiachao Liang1, Jessica E Gibbs1, Nu N Le1, Judith Zimmermann1, David C Newitt1, Bonnie N Joe1, John Kornak1, Savannah C Partridge2, Patrick Bolan3, I-SPY 2 Investigator Network4, I-SPY 2 Imaging Working Group1, and Nola M Hylton1
1University of California, San Francisco, San Francisco, CA, United States, 2University of Washington, Seattle, WA, United States, 3University of Minnesota, Minneapolis, MN, United States, 4Quantum Leap Healthcare, San Francisco, CA, United States
1University of California, San Francisco, San Francisco, CA, United States, 2University of Washington, Seattle, WA, United States, 3University of Minnesota, Minneapolis, MN, United States, 4Quantum Leap Healthcare, San Francisco, CA, United States
Synopsis
Keywords: Breast, Cancer
Acquiring breast diffusion-weighted MRI (DWI) with adequate image quality is a challenge in multi-center clinical trials. The most common issues are inadequate fat suppression, image artifacts, and poor signal-to-noise ratio (SNR). We developed and evaluated a DWI quality ranking system for identifying data with quality issues while preserving analyzable data. The identification of artifacts and adequate SNR had the highest and lowest inter-reader agreement, respectively. Removing inferior quality data improved prediction of pathologic outcome following neoadjuvant treatment in a multi-center clinical trial. The quality ranking system standardizes identification of poor quality data and informs recommendations for improvement to clinical sites.Introduction
The ACRIN 6698 multi-center clinical trial demonstrated that apparent diffusion coefficients (ADCs) calculated for breast tumors in diffusion-weighted MRI (DWI) are predictive of pathologic complete response (pCR) for patients undergoing neoadjuvant chemotherapy1. However, acquiring breast DWI with adequate image quality is a challenge, especially if quality assurance (QA) and quality control (QC) are not in place for multi-center studies. This retrospective study presents a reader study of a quality ranking system designed for breast DWI and evaluates the impact of image quality on predictive performance of tumor ADC using I-SPY 2 data.Methods
In I-SPY 2, patient MRI data are acquired before and at multiple time points during neoadjuvant therapy for breast cancer. In this retrospective study, two readers independently ranked DWI studies acquired at pretreatment (T0) and early treatment (T1) time points based on DWI image quality. The cohort included 249 patients (2 time points x 249 = 498 studies) enrolled in the I-SPY 2 TRIAL between November 26, 2015 and November 5, 2016 who were randomized to paclitaxel + an experimental agent or paclitaxel only2. MRI (DWI and DCE) exams were performed using 1.5T or 3T scanners with dedicated breast coils from various vendors at participating sites. DWI were acquired with fat-suppressed, DW spin echo prepared, echo planar imaging (DW SE-EPI), per scan protocol 1,3. ADC maps were calculated based on 2 b-values, b=0 s/mm2 and b=800 s/mm2, using in-house using software developed in IDL (L3Harris Geospatial, Broomfield, CO, USA). Tumor regions-of-interest (ROIs) were manually drawn on the most diffusion restricted tumor regions4, and tumor ADC was calculated as the mean over all ROIs in the DWI study. The tumor ADC predictor for pCR was the percent change between T0 and T1: (ADC_T1–ADC_T0)/ADC_T0 x 100%. DWI quality ranking criteria were designed to rate each DWI study based on the quality of fat suppression, presence of artifacts, and quality of SNR (Table 1). A score of 1, 2, or 3 was assigned to each category by each reader, with 3 indicating the highest quality. An overall 2-group ranking of “superior” or “inferior” was assigned to each DWI study based on the three-category scores. “Inferior” quality was assigned to patients having a score of “1” in at least one category at either T0 or T1. “Superior” quality was assigned to patients with no “1” scores at either T0 or T1. Intra-reader agreement on the quality ranking was assessed by weighted Kappa coefficient. Squared weights (disagreements were weighted according to their squared distance from perfect agreement) were applied when Kappa coefficients were estimated to add extra penalty to errors that were greater than 1. Percentage agreement was used to evaluate 2-group ranking. The area under the receiver operating characteristic (ROC) curve (AUC) was used to assess the predictive performance of percent change in mean tumor ADC for pCR.Results
In a total of 498 DWI studies, the weighted Kappa between the 2 readers was 0.676 for fat suppression, 0.713 for artifact, and 0.603 for SNR. When the 3-category ranking was consolidated into a final 2-group ranking: “superior” or “inferior,” the percentage agreement between the two readers was 81.5%. A total of 207 patients had tumor ADC measurements performed at both T0 and T1 (414 total DWI studies). Of the full cohort of 207 patients, 90 had studies ranked “superior” quality and 117 “inferior” quality. The AUC for predicting pCR estimated in the full cohort (n=207) was 0.64 (95% CI: [0.55, 0.74]). When the full cohort was split into sub-cohorts based on the 2-group ranking, a higher AUC (0.69, 95% CI: [0.55, 0.83]) was observed in the “superior” quality sub-cohort (n=90) compared to the AUC (0.63, 95% CI: [0.48, 0.77]) in the “inferior” quality sub-cohort (n=117). ROC curves are shown in Figure 1. Examples with “superior” and “inferior” image quality can be found in Figure 2.Discussion and conclusion
Level of agreement was assessed between two readers in our study when readers were asked to rank DW image quality in three separate categories of fat suppression, artifact, and SNR. A slightly higher AUC was observed by eliminating patients with “inferior” quality DWI but further verification was required. This multi-center, retrospective study indicated that the predictive performance of tumor ADC was potentially affected by image quality of DWI in the assessment of treatment response for breast cancer undergoing neoadjuvant chemotherapy. For utilization of ADC as a biomarker of response, a systematic quality evaluation process is needed to help to flag poor quality data to be excluded from quantitative analysis. While this study gives a snapshot of image quality in a multi-center clinical trial, this ranking system will be used to provide specific recommendations for necessary improvements to the DWI acquisitions.Acknowledgements
NIH/NCI R01 CA132870, U01 CA225427, P01 CA210961, R01 CA255442, R01 CA190299.References
- Partridge SC, Zhang Z, Newitt DC, et al. Diffusion-weighted MRI Findings Predict Pathologic Response in Neoadjuvant Treatment of Breast Cancer: The ACRIN 6698 Multicenter Trial. Radiology. 2018;289(3):618-627. doi:10.1148/radiol.20181802732.
- Li W, Newitt DC, Wilmes LJ, et al. Additive value of diffusion-weighted MRI in the I-SPY 2 TRIAL. J Magn Reson Imaging. Published online April 26, 2019. doi:10.1002/jmri.267703.
- Le NN, Li W, Onishi N, et al. Effect of Inter-Reader Variability on Diffusion-Weighted MRI Apparent Diffusion Coefficient Measurements and Prediction of Pathologic Complete Response for Breast Cancer. Tomogr (Ann Arbor, Mich). 2022;8(3):1208-1220. doi:10.3390/tomography8030099.
Figures
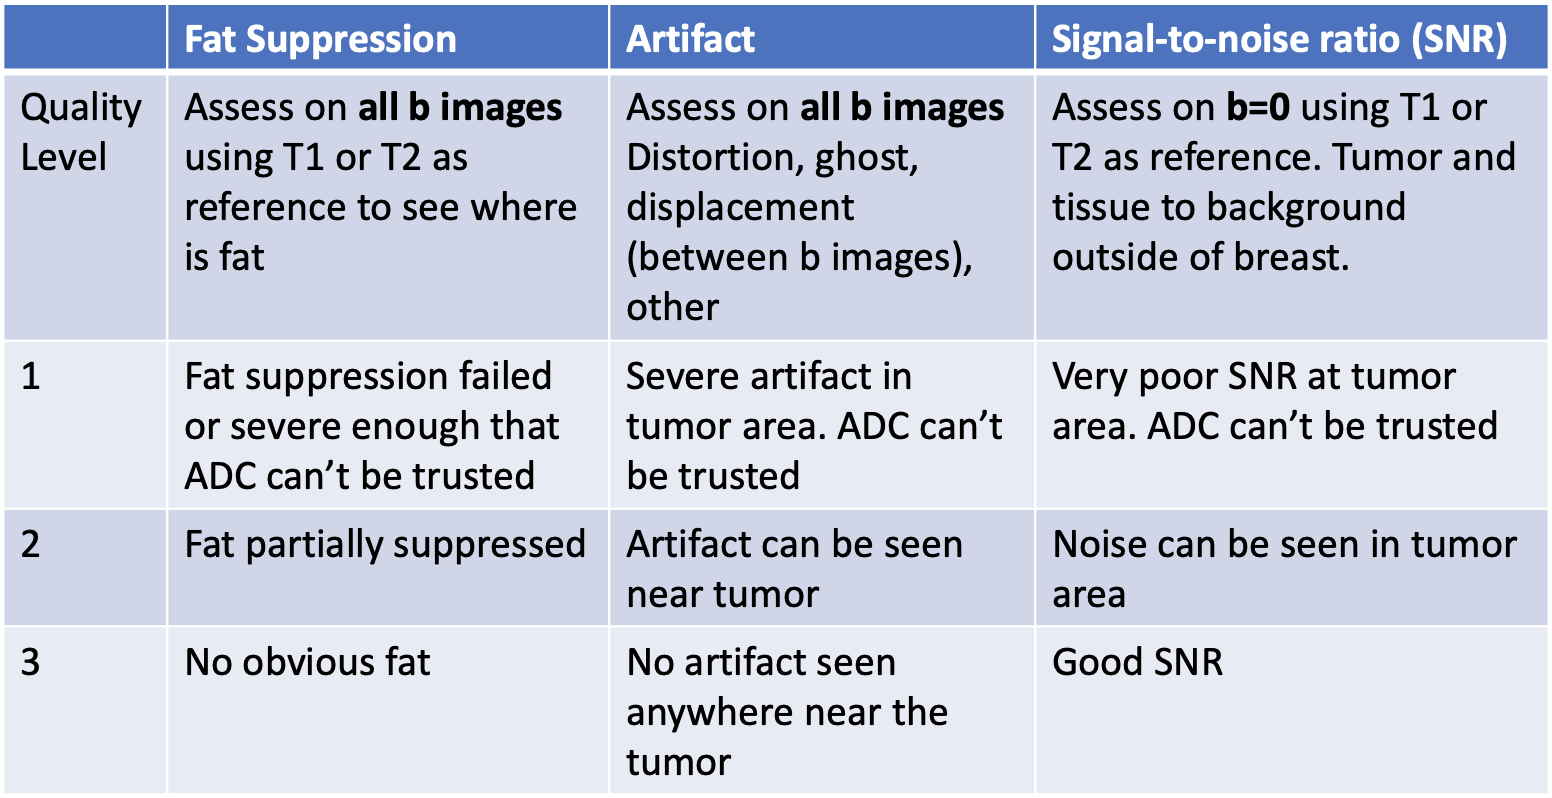
Table 1 Quality ranking criteria. The image quality of each DWI study was rated in each of the 3 categories: fat suppression, artifact, and signal-to-noise ratio (SNR). A score of 1, 2, or 3 was given to each category: 1 poor; 2 acceptable; 3 good. T1: T1-weighted MRI; T2: T2-weighted MRI.
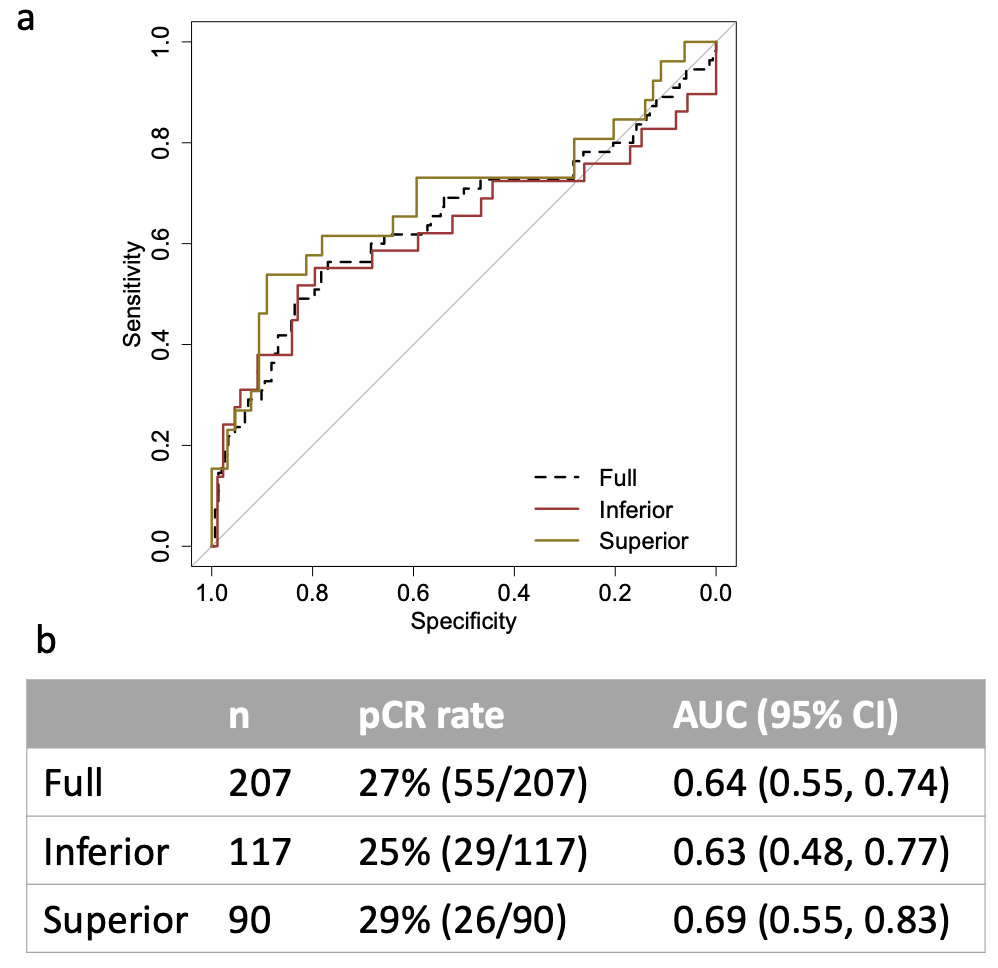
Figure 1 Area under the receiver operating characteristic (ROC) curves (AUCs) of using percent change ADC to predict pCR. (a) ROC curves of the full, “Superior”, and “Inferior” cohorts. (b) Table containing the corresponding cohort sizes and AUCs with 95% confidence interval (CI).
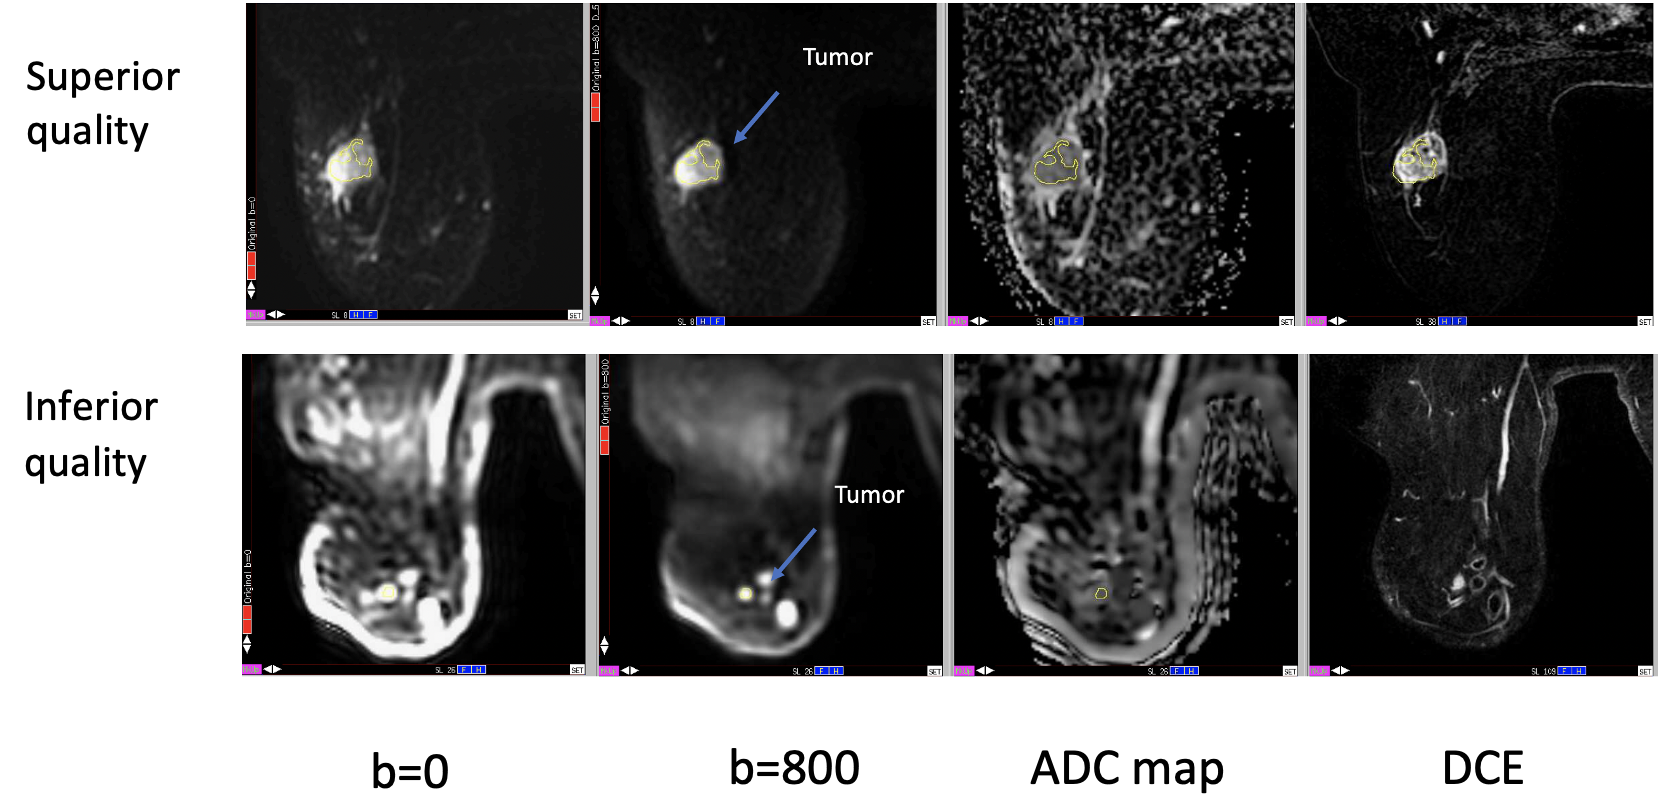
Figure 2 Example MR images from two different patients. DW images (b=0, 800 s/mm2) shown in the upper row are ranked as having “superior” quality while DW images shown in the lower row are ranked as having “inferior” quality. From left to right, the example images are axial slices from approximately the same inferior-superior location of each patient. Images in the “DCE” column are subtracted images from early post enhanced to pre-contrast. Best effort was applied to manually delineate region-of-interests in the most diffusion restricted area of the tumors.
DOI: https://doi.org/10.58530/2023/2565