2564
An ADC-based Radiomics model: differential diagnosis of mucinous breast carcinoma from similar morphological invasive ductal breast carcinoma
yuanfei li1, ning ning1, lina zhang1, qi wu1, siqi zhao1, ailian liu1, qinhe zhang1, jianzhou chen2, jingjing cui2, and lizhi xie3
1The First Affiliated Hospital of Dalian Medical University, Dalian, China, 2Shanghai United Imaging Intelligence, Co., Ltd., Shanghai, China, 3GE Healthcare, Beijing, China
1The First Affiliated Hospital of Dalian Medical University, Dalian, China, 2Shanghai United Imaging Intelligence, Co., Ltd., Shanghai, China, 3GE Healthcare, Beijing, China
Synopsis
Keywords: Breast, Radiomics
Mucinous breast carcinomas (MBCs) always have similar morphological manifestations with invasive ductal breast carcinomas (IDCs) on conventional MRI. MBCs have a better prognosis and early treatment can achieve good results. Radiomics is a novel tool automated data feature extraction algorithms,which has the potential to uncover disease characteristics that are difficult to identify by human vision alone. We develop a radiomics model for explore the preoperative differentiation of combining the intratumoral signal intensity (SI) on T2WI and ADC derived from DWI in MBCs and IDC. The results confirm that the model has potential in the differential diagnosis of MBCs and IDC.Introduction
Differential diagnosis of MBCs and IDC now mainly depends on the results of the pathology after operation[1]. Radiomics could extract quantitative image features and mine hidden information in images through computer algorithms[2-4]. T2WI derived from MRI mainly reflect the imaging of T2 characteristic parameters between tissues which is conducive to the observation of affected tissue[5, 6]. DWI can reflect information on the diffusion motion of water molecules in tissues and the net movement of water molecules can be described by the apparent diffusion coefficient (ADC), thus is sensitive to diseases with organic changes[7, 8]. However, Based on our review of the literature found few studies utilizing T2 and DWI quantitative parameters (ADC) radiomics model about preoperative differential diagnosis in different pathological types of breast cancers. In this study, we explore the differential diagnostic value of establishing omics models based on MRI combined with relevant imaging in similar morphological MR manifestations of MBCs and IDC.Materials and Methods
This study was approved by the local IRB. A total of 45 patients were included in the analysis. The patients were categorized into the MBC group (n=15) and IBC (n=30) according to pathology results. All the patients underwent preoperative 3.0T MRI (GE Signa HDxt 3.0T MR, GE Healthcare, USA) with a 8-channel breast coil. MR protocols included T2 STIR, and DWI. The detailed scan parameters are listed in Table 1. The region of interest (ROI) rendering, radiomics feature extraction, feature selection and machine learning models building were established on the uAI Research Portal V1.1 (Shanghai United Imaging Intelligence, Co., Ltd.). The largest lesion was manually drawn layer by layer on the enhanced image as the ROI, and then the ROIs was copied to T2 and ADC images. The ROIs was checked by two radiologist (Figure 1)who one had diagnosed breast disease for more than 18 years. A total of 2,264 features extracted and preprocessed by Z-score normalization method. ANOVA and LASSO algorithms was used for feature selection to select the most valuable radiomics features based on the combination of T2 and ADC. 5 fold cross-validation was used to evaluate the performance of the model. A Random Forest model was constructed using the features selected. Receiver operating characteristic curve (ROC) was used to analyze the predictive efficiency of joint model. Statistical analysis of the clinical data and laboratory indicators was performed using SPSS 25.0.Results
The representative T2,ADC and DWI images were shown in Figure 1. The ROI in Figure 1 were used to get extract features. The measurement consistency between the two radiologists was good (ICC> 0.75, data not shown). Comparisons with the clinicopathological data, ADC values between MBCs and IBC was shown in Table 2. The combination method L2_normalization with Random Forest is optimal for the joint model. The mean AUC of training group and test group based on the combined T2 and ADC model were 0.961 and 0.841, respectively. (Figure2,Figure3)Discussion
Radiomics could deeply excavate the biological nature of images, extract microscopic characteristics of images, obtain potential image associations with pathology and clinical, Thus extending the clinical value of traditional imaging diagnosis. Both T2 and DWI are sensitive to the contents of tissues. When cancer happens, the protein synthesis and cell proliferation elevated significantly. The increased cell density restricts water molecular motion and thus low ADC values, which is also confirmed by our results. What’s more, a moderate combined model has a certain diagnostic efficacy, which implies a combination of T2 and DWI might be a promising method for differential diagnosis of MBCs and IDC withe similar morphological MR manifestations.Conclusion
In conclusion, ADC values were higher in the mucinous breast carcinoma compared with invasive ductal breast carcinomas. In this study, establishing a logistic regression model by enhancing the Radiomics features of MRI images could potentially provide a non-invasive tool for the similar morphological manifestations with MBCs and IDC identification.Acknowledgements
No acknowledgement found.References
[1] HASHMI A A, ZIA S, YAQEEN S R, et al. Mucinous Breast Carcinoma: Clinicopathological Comparison With Invasive Ductal Carcinoma [J]. Cureus, 2021, 13(3): e13650.[2] ZHANG Y, ZHU Y, ZHANG K, et al. Invasive ductal breast cancer: preoperative predict Ki-67 index based on radiomics of ADC maps [J]. Radiol Med, 2020, 125(2): 109-16.[3] ZHANG R, WEI W, LI R, et al. An MRI-Based Radiomics Model for Predicting the Benignity and Malignancy of BI-RADS 4 Breast Lesions [J]. Front Oncol, 2021, 11: 733260.[4] LI Y, YANG Z L, LV W Z, et al. Non-Mass Enhancements on DCE-MRI: Development and Validation of a Radiomics-Based Signature for Breast Cancer Diagnoses [J]. Front Oncol, 2021, 11: 738330.[5] KIM K W, KUZMIAK C M, KIM Y J, et al. Diagnostic Usefulness of Combination of Diffusion-weighted Imaging and T2WI, Including Apparent Diffusion Coefficient in Breast Lesions: Assessment of Histologic Grade [J]. Acad Radiol, 2018, 25(5): 643-52.[6] QU N, LUO Y, YU T, et al. Differentiation between Pure Mucinous Breast Carcinomas and Fibroadenomas with Strong High-Signal Intensity on T2-Weighted Images from Dynamic Contrast-Enhanced Magnetic Resonance Imaging [J]. Breast Care (Basel), 2018, 13(1): 32-7.[7] ROKNSHARIFI S, FISHMAN M D C, AGARWAL M D, et al. The role of diffusion weighted imaging as supplement to dynamic contrast enhanced breast MRI: Can it help predict malignancy, histologic grade and recurrence? [J]. Acad Radiol, 2019, 26(7): 923-9.[8] GUO Y, KONG Q C, ZHU Y Q, et al. Whole-lesion histogram analysis of the apparent diffusion coefficient: Evaluation of the correlation with subtypes of mucinous breast carcinoma [J]. J Magn Reson Imaging, 2018, 47(2): 391-400.Figures
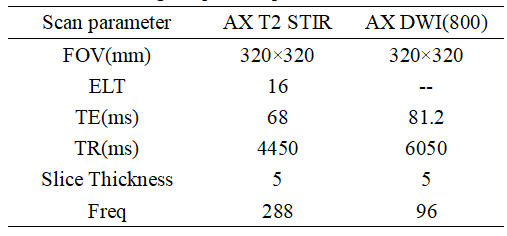
Table 1 MRI image acquisition parameters
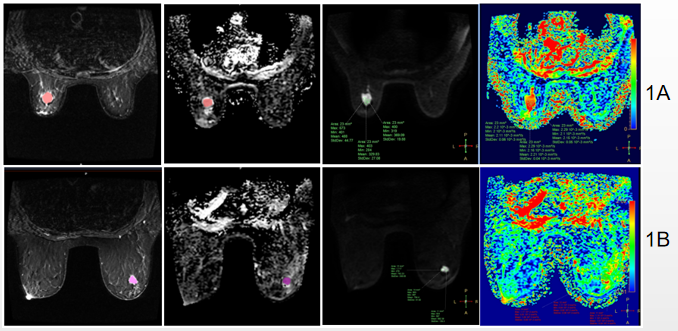
(Fig.1)1A: Female, 53y, MBC with a maximum axial diameter of approximately 2cm, T2;Multiple ADC; DWI;Single ADC. Red area is the area of interest (ROI) of the largest level of the lesion. 1B: Female, 40y IBC with maximum axial diameter of approximately 1.8cm, T2; Multiple ADC; DWI;Single ADC. Purple area is the area of interest (ROI) of the largest level of the lesion.
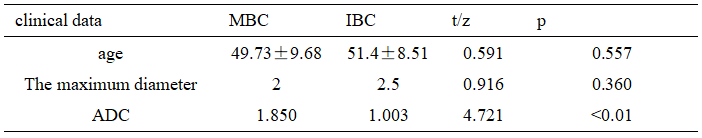
Table 2 Clinical data characteristics of patients
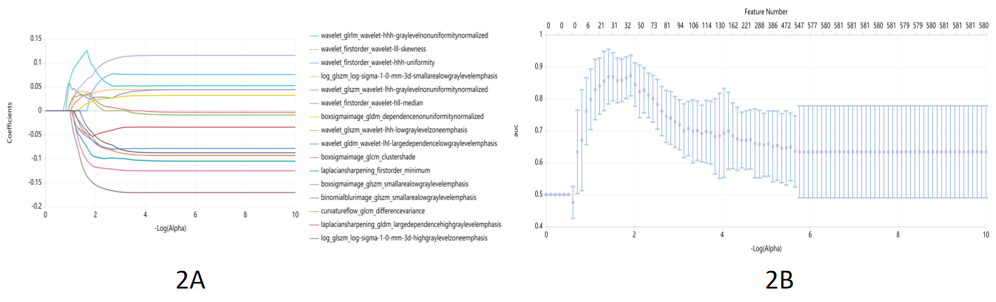
Fig. 2 Imaging features related to Joint model of T2 with ADC in breast cancer. 2A shows the change of the feature coefficient under each Alpha, the abscissa log (Alpha), and the ordinate feature coefficient value. 2B represents the AUC results under different Alpha. The abscissa is log (Alpha), the ordinate is mean AUC, and the blue represents the standard deviation.
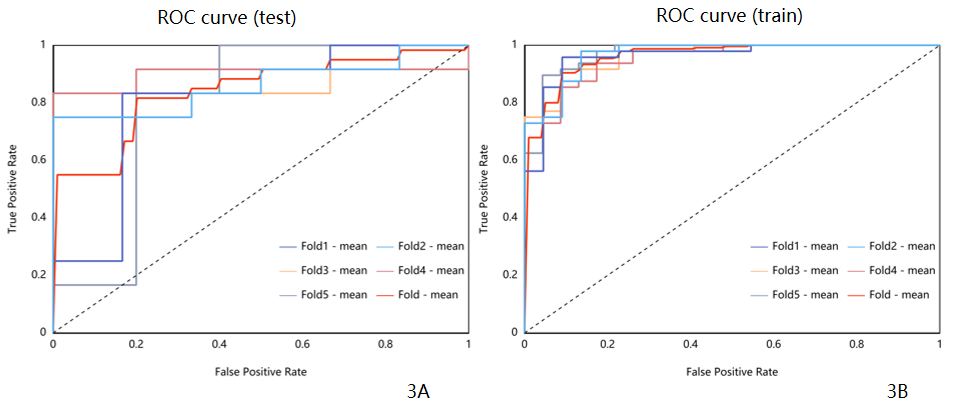
Fig. 3 The receiver operating characteristic curve and area under the curve of radiomics combined model. 3A represents the training set, and 3B represents the test set where the red color represents the average fold.The AUC was 0.961,0.963,0.955,0.972,0.961 for the training set, and the 5 fold AUC was 0.806,0.861,0.847,0.90,0.80,0.841 for the test set.
DOI: https://doi.org/10.58530/2023/2564