2562
Predicting Molecular Subtypes and Prognostic Factors of Breast Cancer Using Integrated Diffusion MRI1Center for MR Research, University of Illinois at Chicago, Chicago, IL, United States, 2Department of Biomedical Engineering, University of Illinois at Chicago, Chicago, IL, United States, 3The First School of Clinical Medicine of Zhejiang Chinese Medical University, Hangzhou, China, 4The First Affiliated Hospital of Zhejiang Chinese Medical University, Hangzhou, China, 5Departments of Radiology and Neurosurgery, University of Illinois at Chicago, Chicago, IL, United States
Synopsis
Keywords: Breast, Breast, molecular subtype prediction, heterogeneity, high-b-value diffusion MRI
Breast cancer exhibits a wide spectrum of molecular subtypes and, which has important implications in treatment strategies. In this study, we used an integrated diffusion-weighted imaging approach for simultaneous assessment of tissue cellularity, vascularity, and heterogeneity – DISMANTLE – to predict molecular subtypes and prognostic factors of breast cancer. We investigated the feasibility of using the histogram features of the cellularity-, vascularity-, and heterogeneity-related parameters of DISMANTLE for differentiation between luminal-A and luminal-B and HER2+ and HER2- breast cancer.Introduction
Breast cancer is highly heterogeneous with multiple identified molecular subtypes and prognostic factors. Given the disease heterogeneity, breast cancer exhibits a wide spectrum of prognosis and, hence, treatment strategies are highly dependent on accurate identifying molecular subtypes1. Tissue sampling using immunohistochemistry as surrogate genetic testing is the gold standard to determine breast cancer subtype and prognostic factors. Due to the inherent sampling error and invasive nature of biopsies, there has been an increasing interest in developing imaging metrics for the prediction of breast cancer subtypes2. In this study, we use an integrated diffusion-weighted imaging (DWI) approach for simultaneous assessment of tissue cellularity, vascularity, and heterogeneity (DISMANTLE) for the prediction of molecular subtypes and prognostic factors of breast cancer. This approach is based on an intravoxel incoherent motion (IVIM) model3 with low-b-values and a non-Gaussian continuous-time random walk (CTRW) model with high-b-values, the latter of which can reflect microstructural heterogeneity4,5. We investigate whether the histogram features of the cellularity-, vascularity-, and heterogeneity-related parameters of DISMANTLE can differentiate between 1) luminal-A and luminal-B and 2) HER2+ and HER2- breast cancer.Methods
Patients: This study included 21 women with a total of 26 histologically confirmed malignant breast lesions. The ER, PR, and HER2 expressions for all lesions were distributed as follows: NER+ = 21 and NER- = 5; NPR+ = 20 and NPR- = 6; NHER2+ = 18 and NHER2-= 8. Four different molecular subtypes, luminal-A, luminal-B, triple negative (TN), and HER2-enriched, were present with the following distribution: Nluminal-A = 7, Nluminal-B = 13, NTN = 1, and NHER2-enriched = 4.Image Acquisition: All patients underwent MRI scans at 3T (GE Healthcare, Discovery MR750) with an 8-channel breast coil. DWI was performed with 11 b-values (01, 501, 1002, 3002, 5002, 8004, 11004, 15006, 20006, 25008, 30008 s/mm2 (subscripts denoting NEXs); TR/TE=7000/78ms; slice thickness=5mm; FOV=32cm×32cm; and matrix=256×256).
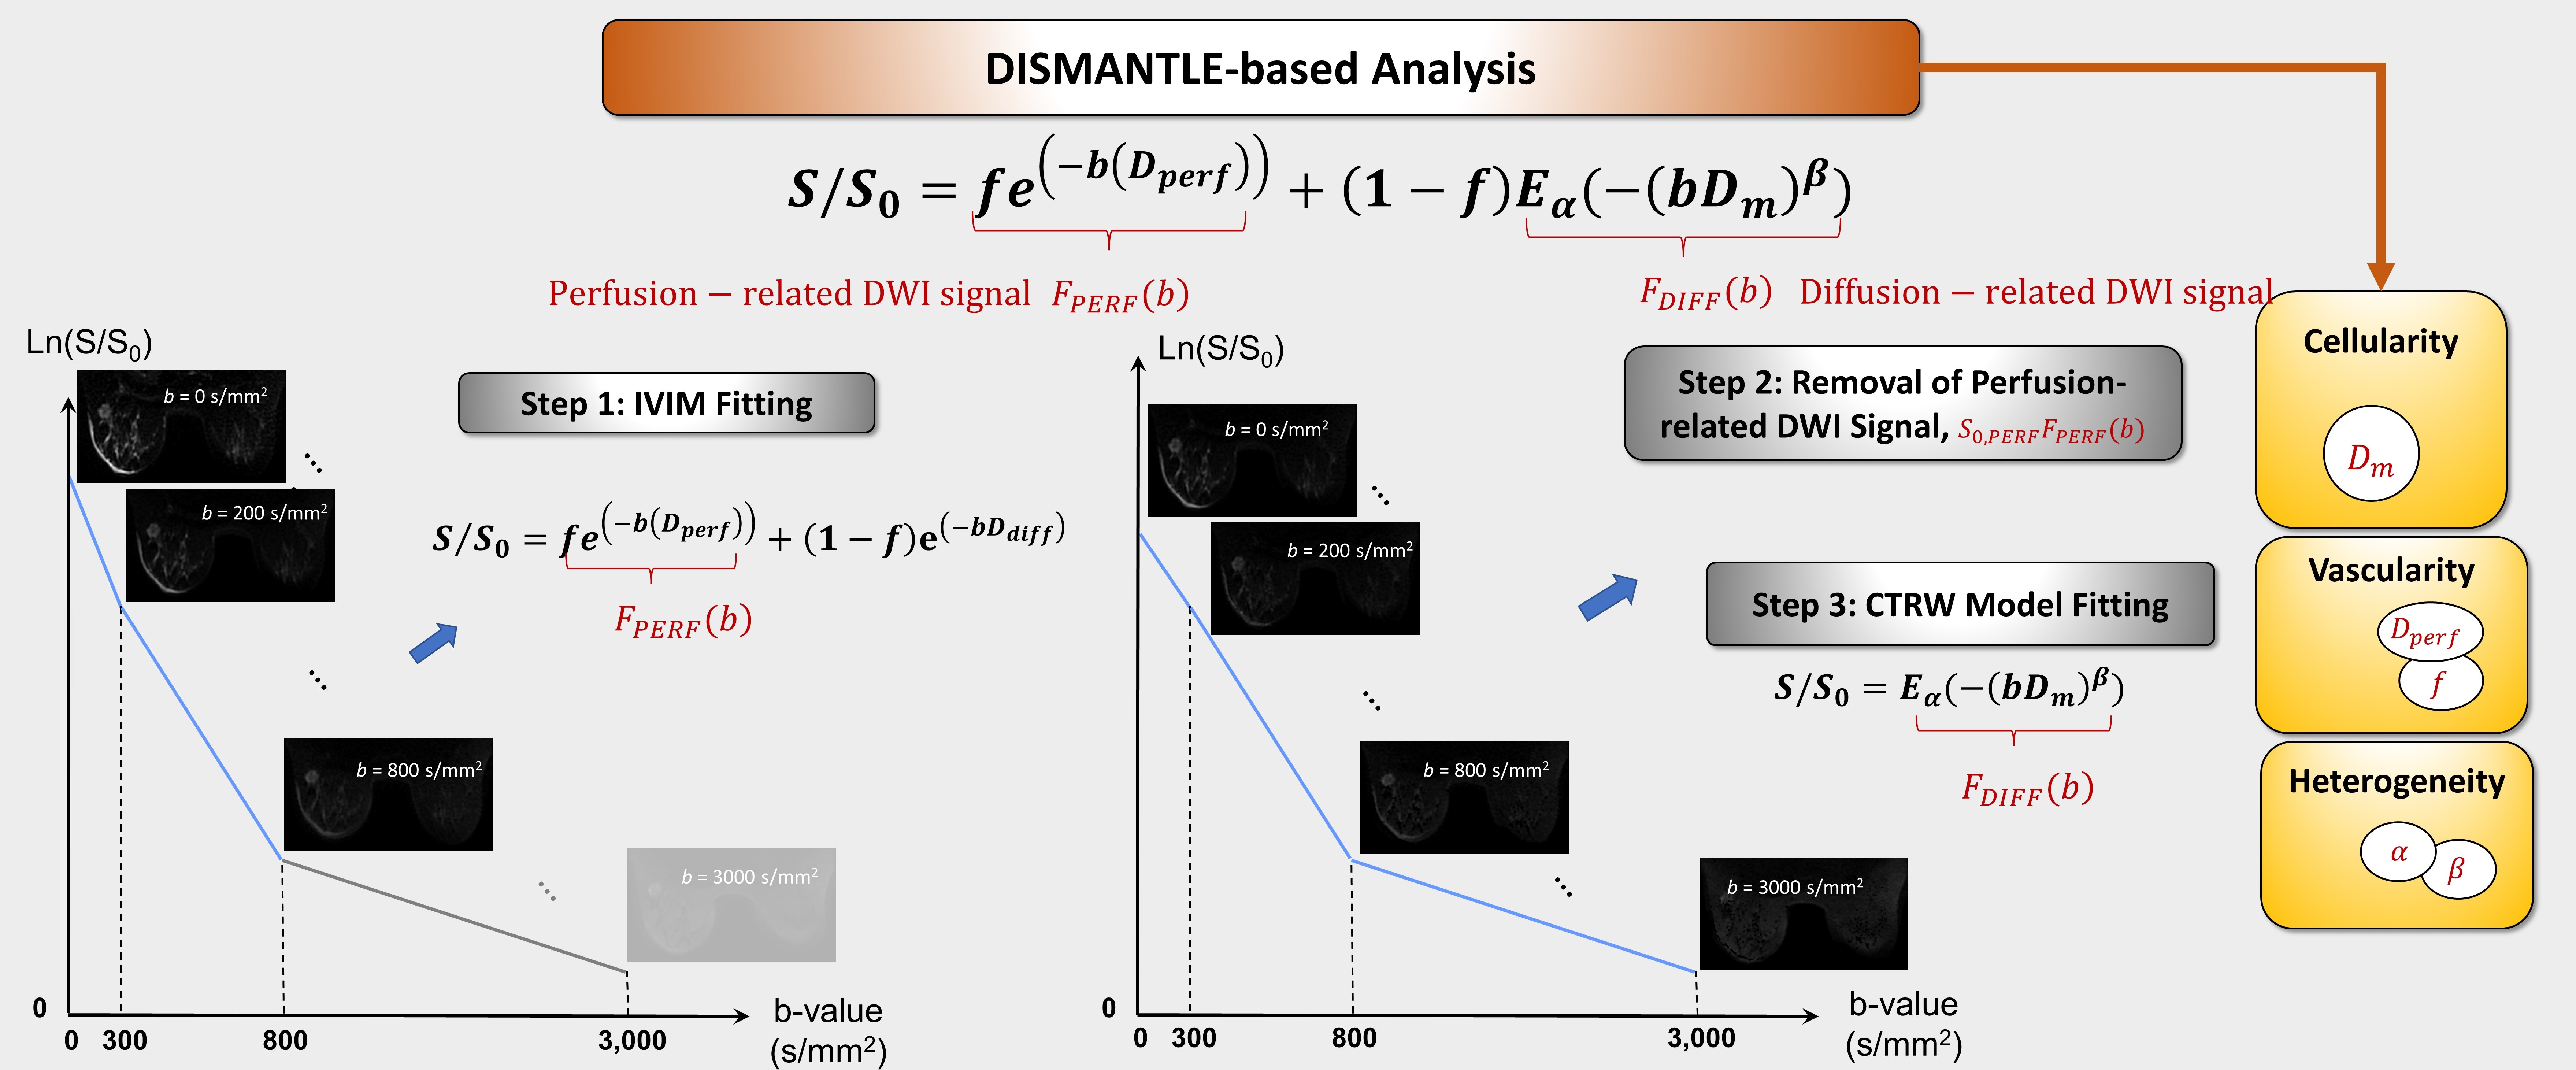
DWI Analysis: The trace-weighted diffusion-weighted images were analyzed using an integrated multi-b-value DWI approach (i.e. DISMANTLE6). It characterizes the diffusion-weighted signal attenuation based on IVIM7,8 and CTRW5 models, respectively:
$$$ S/S_0=fe^{-bD_{perf}}+(1-f) E_a (-(bD_m )^ß)$$$, (1)
where Eα is a Mittag-Leffler function. DISMANTLE in Eq. (1) produces three sets of parameters with a unified formulism: vascularity-related (IVIM’s perfusion fraction, f and pseudo-diffusion coefficient, Dperf), cellularity-related (CTRW’s diffusion coefficient, Dm), and heterogeneity-related (CTRW’s temporal and spatial diffusion heterogeneity, α and β) parameters. DISMANTLE was implemented through a multi-step approach by first analyzing the images in the low-b-value range (0-800 s/mm2) with an IVIM model8 using segmented fitting9, then removing the perfusion-related signal from the diffusion-weighted signal, and finally analyzing the remaining diffusion-related signal component over the entire-b-value range (0-3000 s/mm2) with a CTRW model5 as illustrated in Fig. 1.
Histogram-based Statistical Analysis: Nine histogram features were generated from each DISMANTLE parameter over tumor ROIs: mean, median, minimum, maximum, variance, kurtosis, skewness, first quartile (QR1), and third quartile (QR3). The DISMANTLE-based histogram features were compared for significant differences by using a Mann-Whitney U test to address two clinical questions: 1) differentiation between luminal-A and luminal-B molecular subtype groups; and 2) differentiation between HER2+ and HER2- groups. TN and HER2-enriched molecular subtypes were not included in the analysis due to the small sample size. The performance metrics of DISMANTLE features were evaluated by a receiver operating characteristic (ROC) analysis. The ROC analysis was performed with the use of the features that yielded statistically significant difference among the luminal-A vs. luminal-B and HER2+ vs. HER2- groups collectively using multivariate logistic regression.
Results
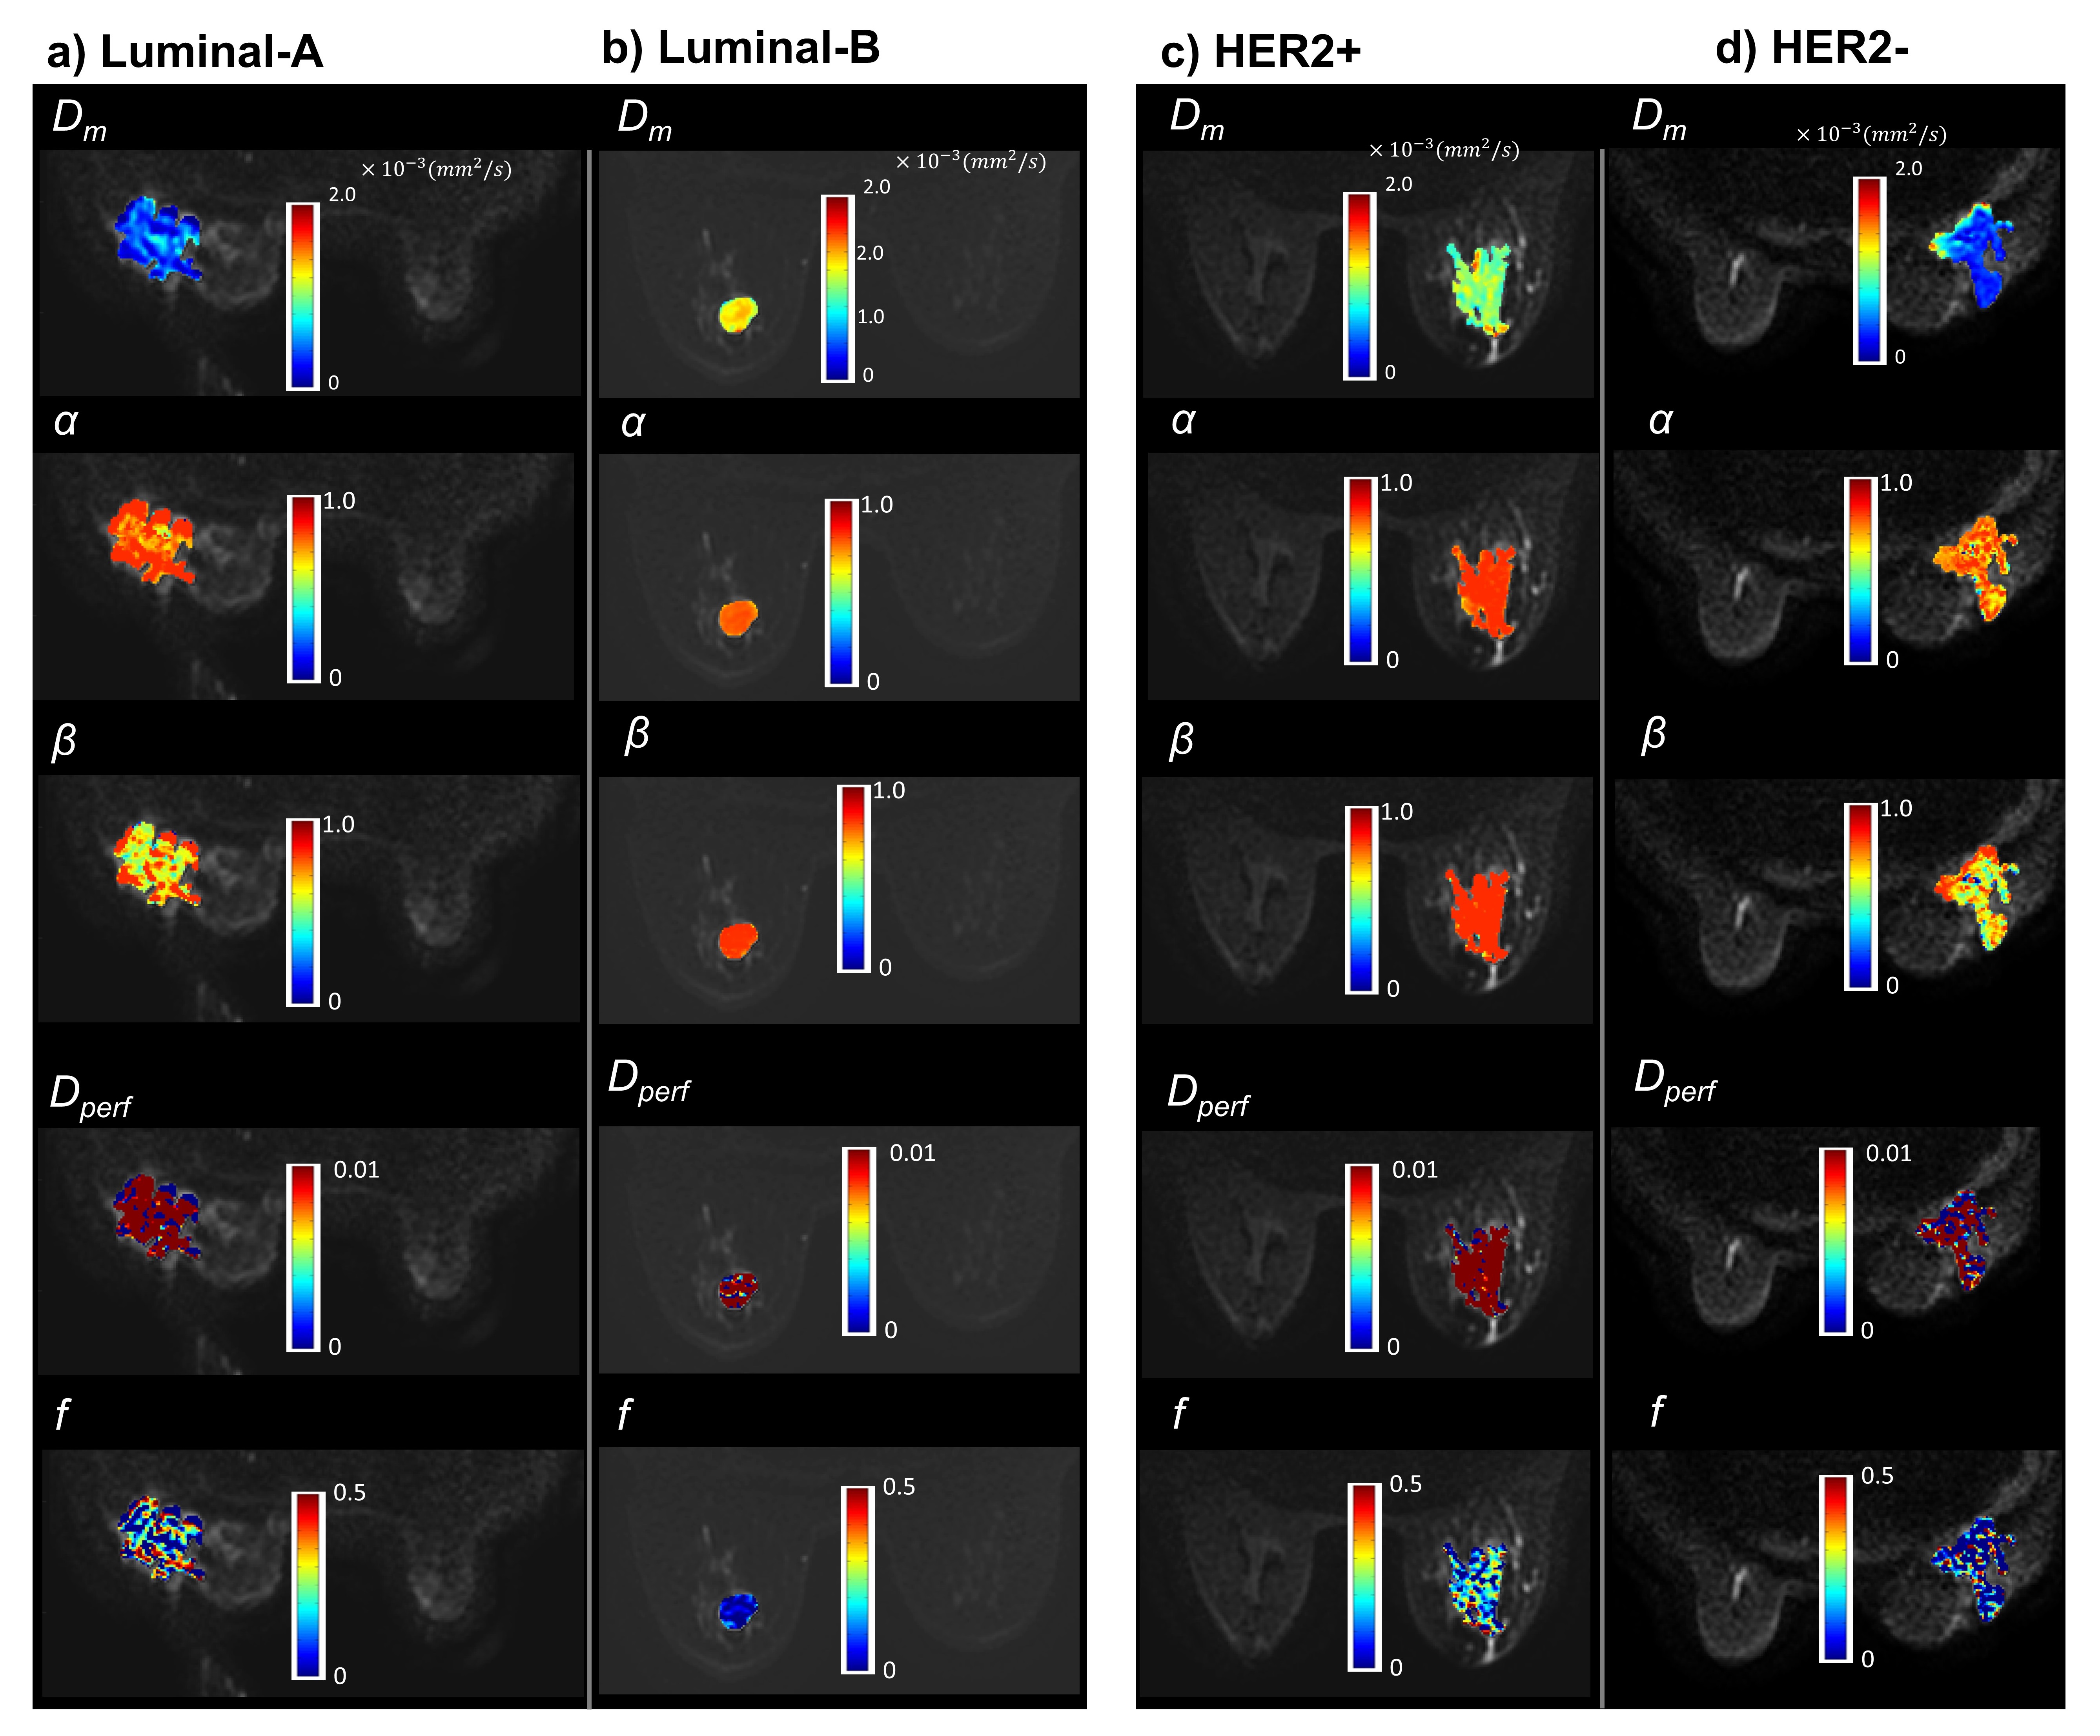
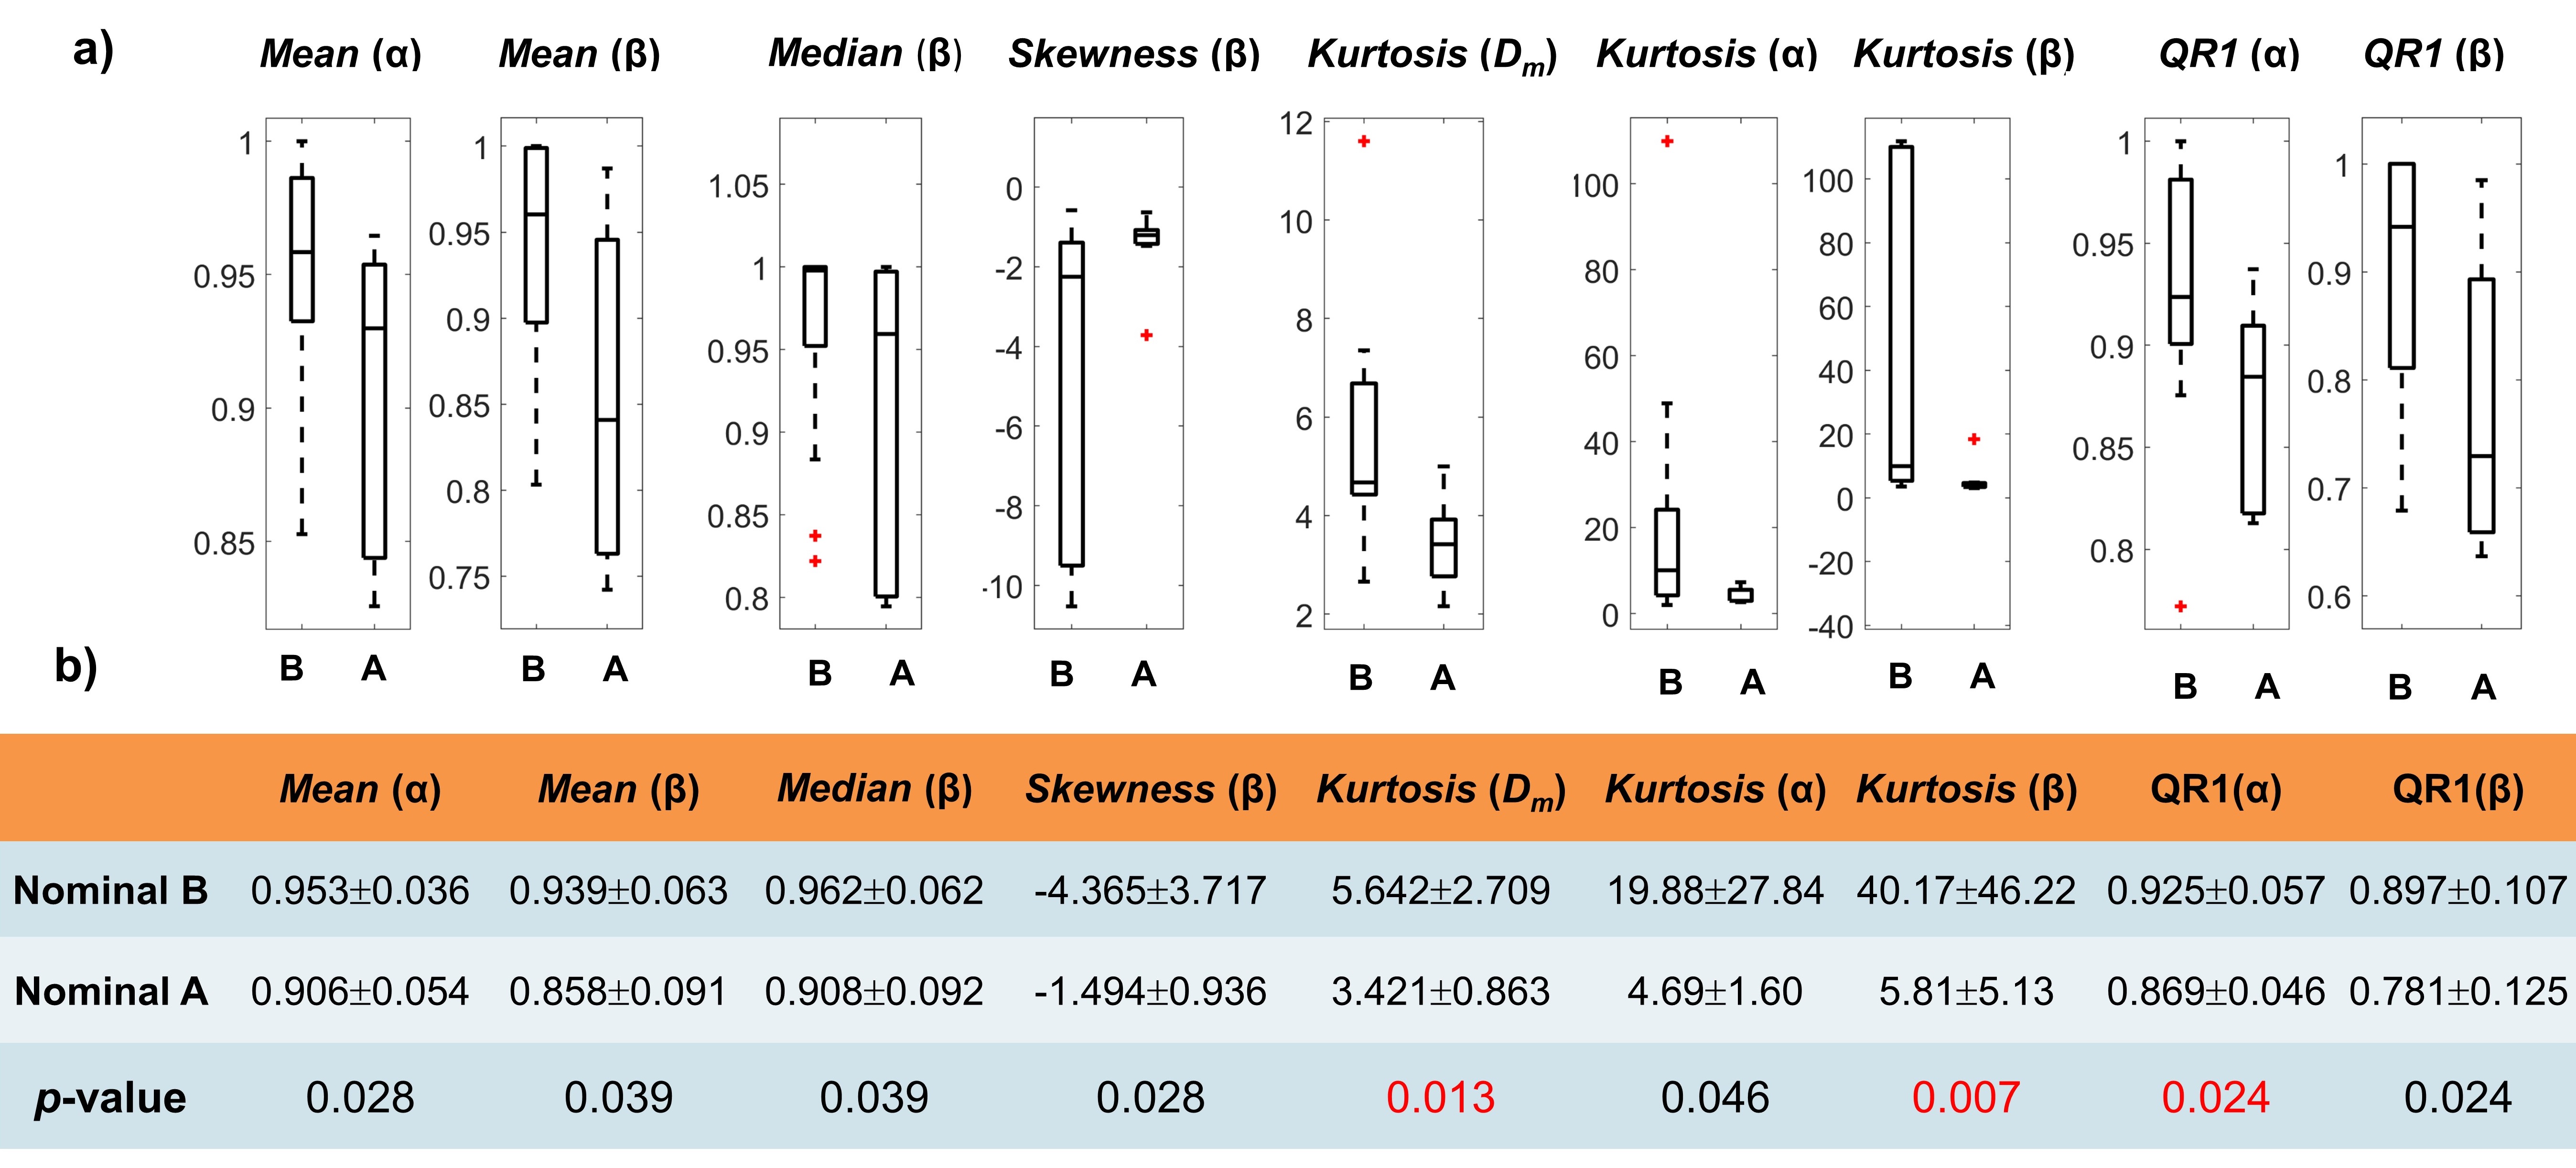
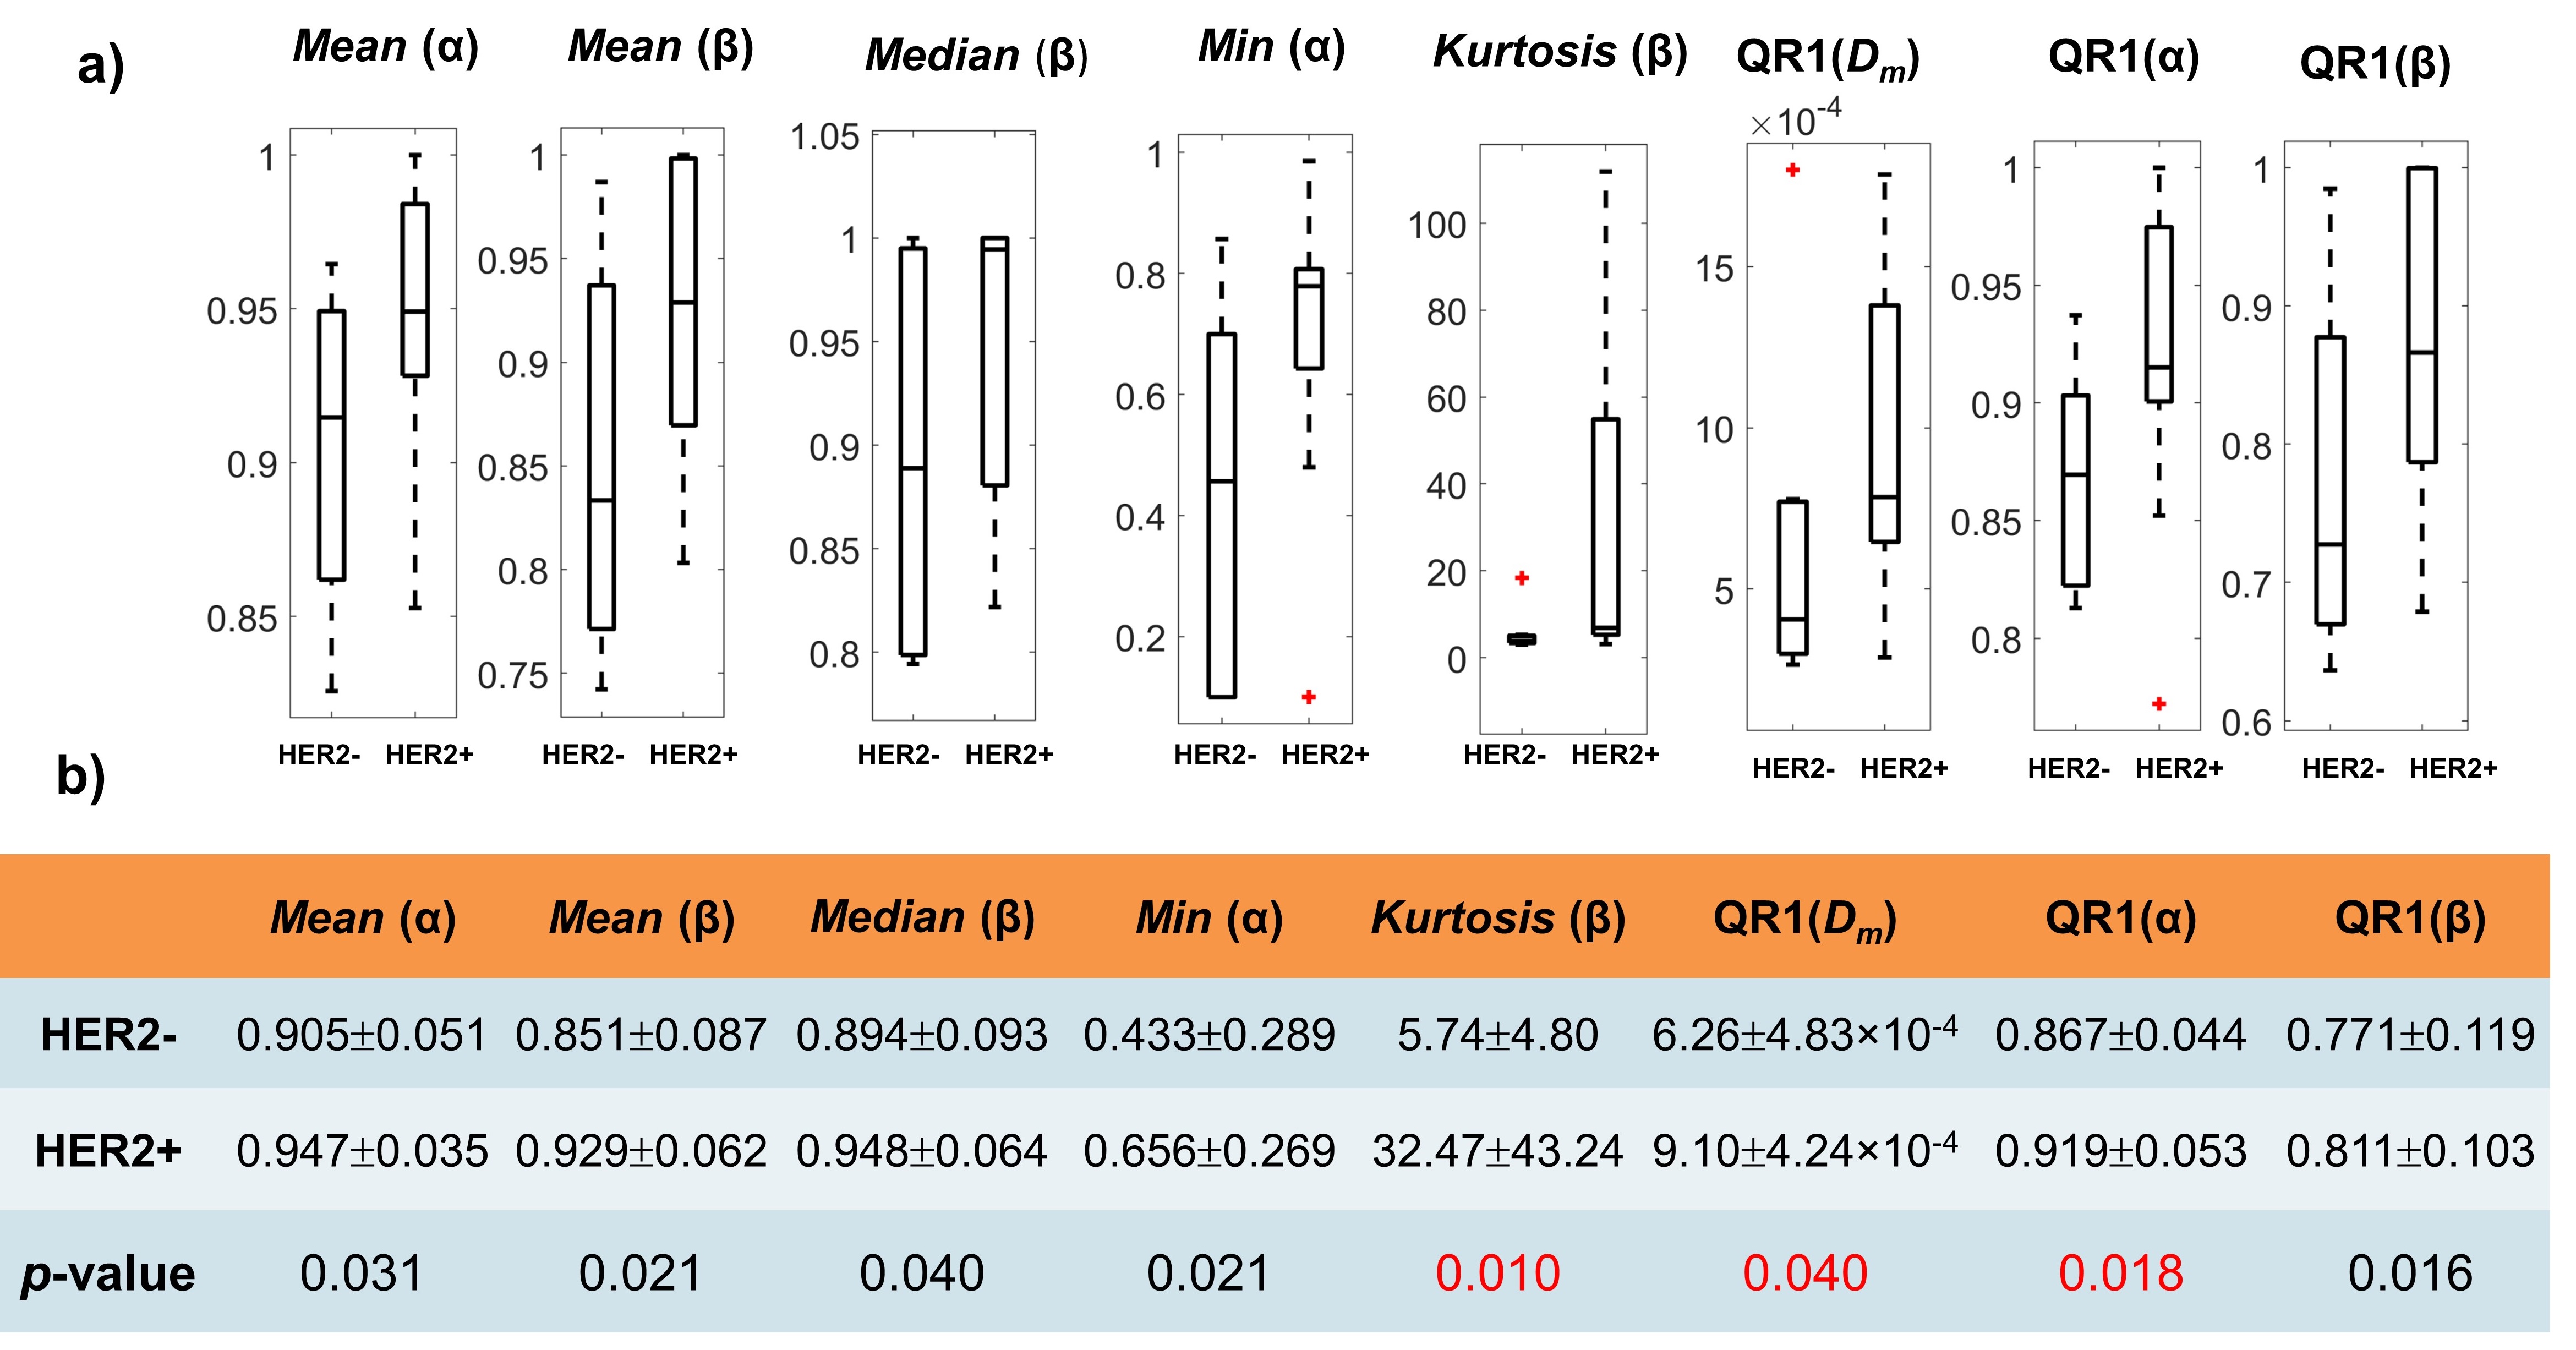
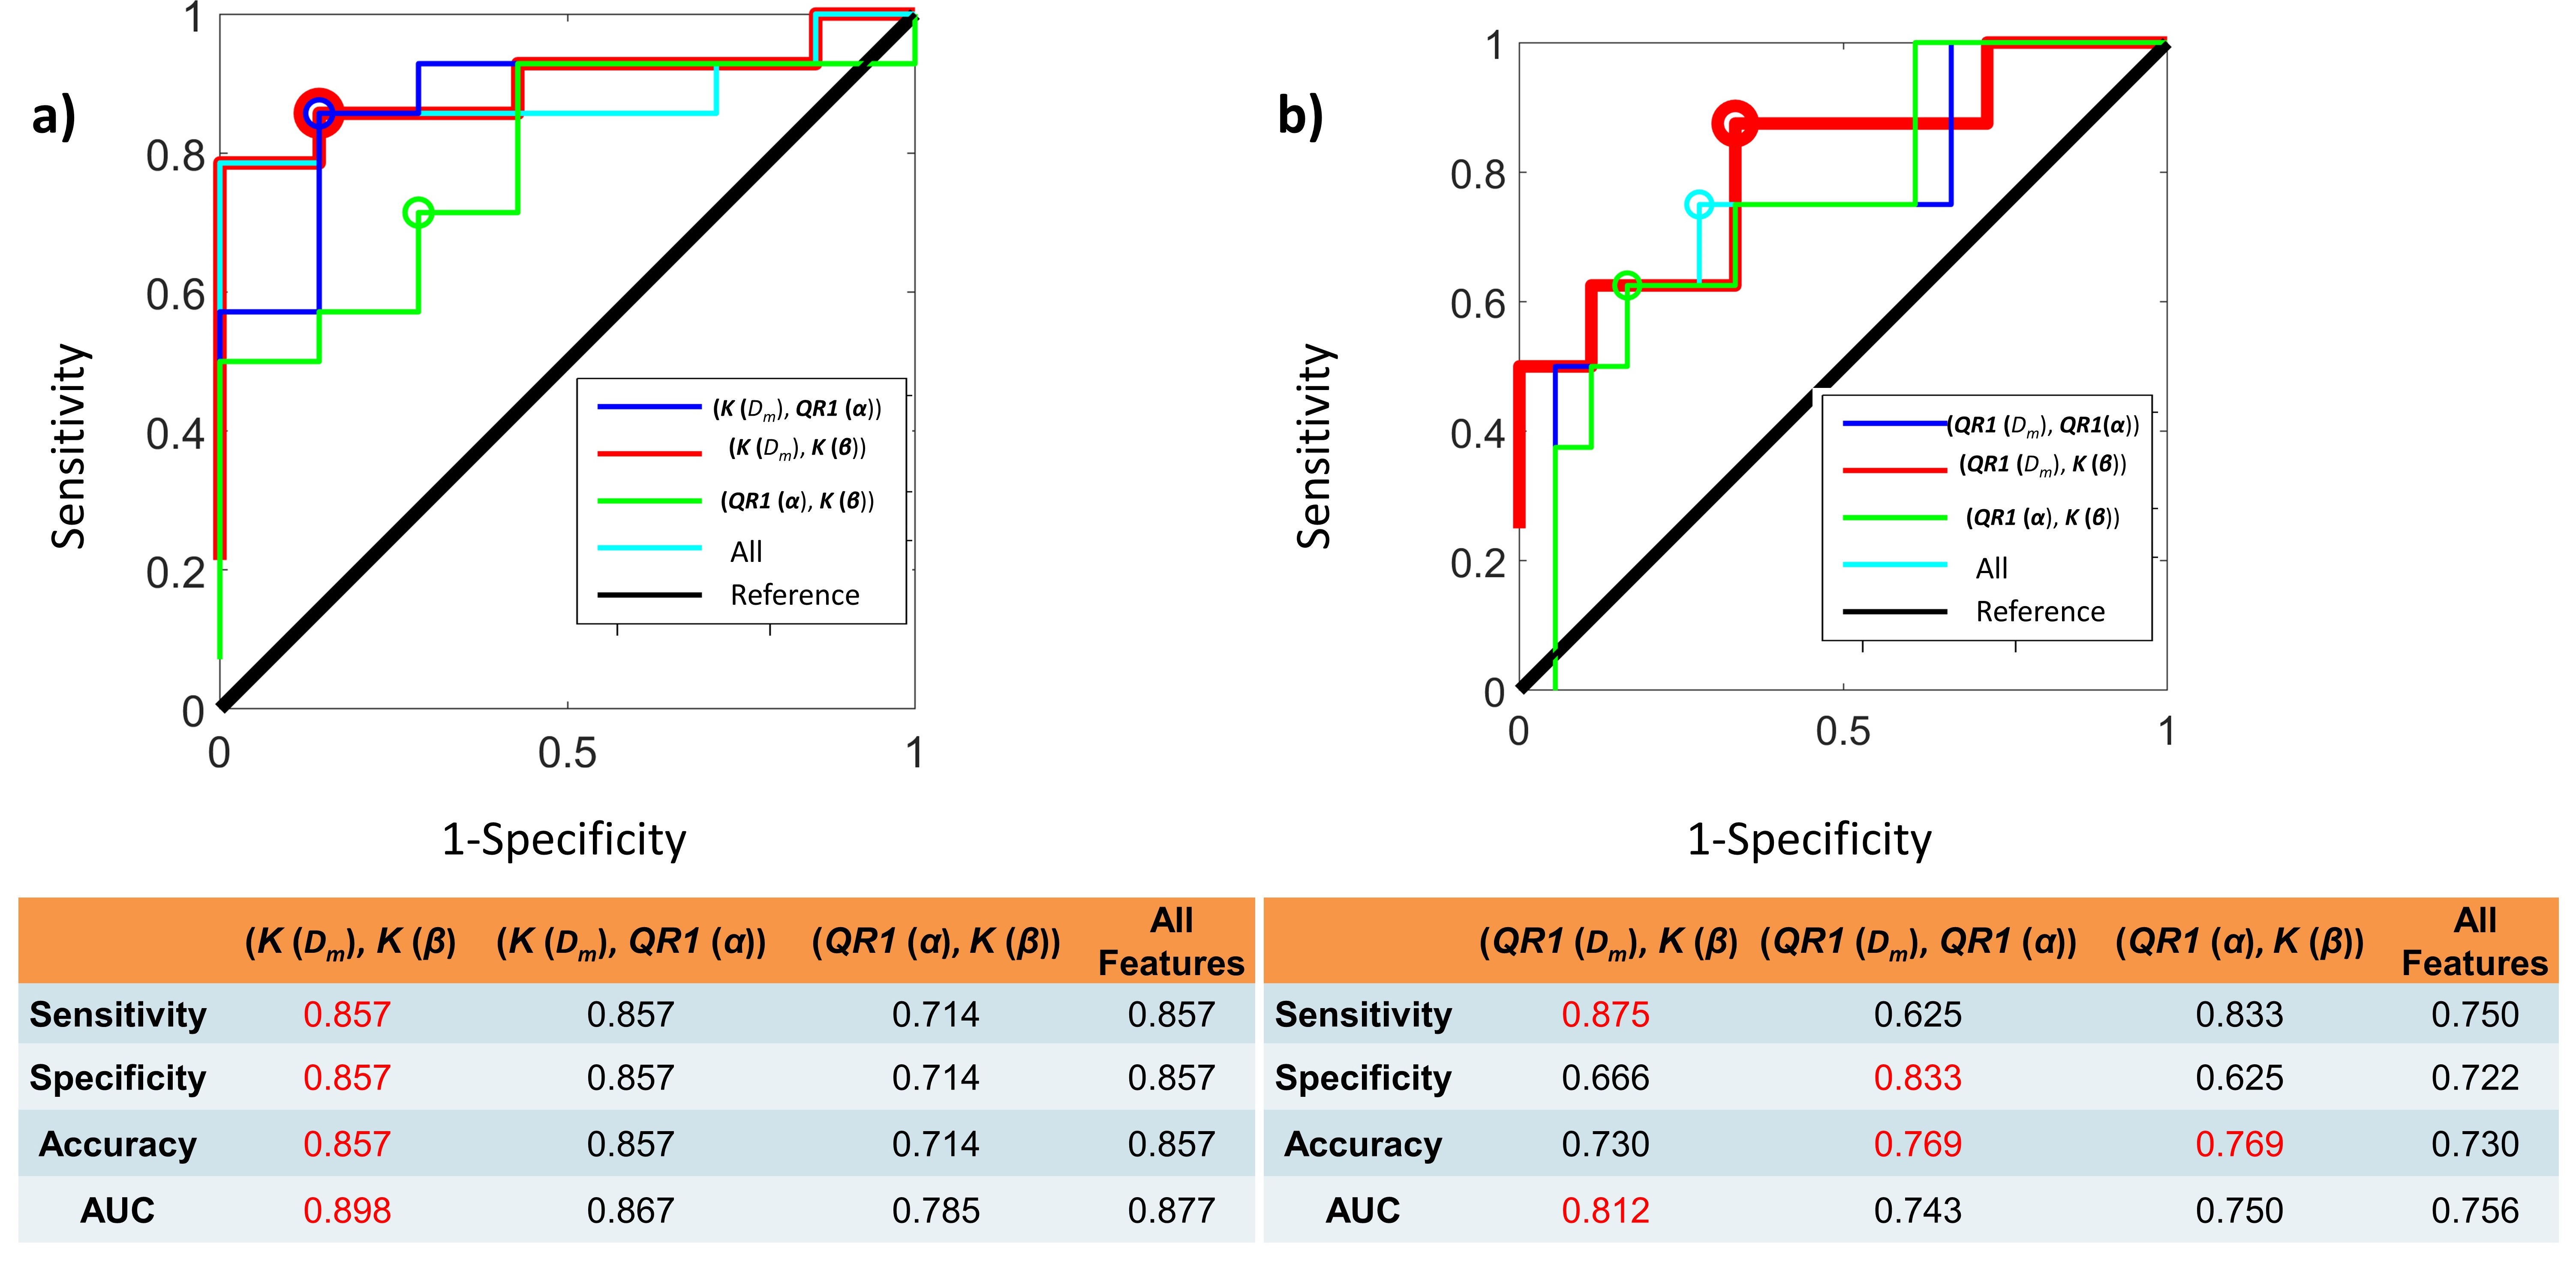
Figure 2 shows DISMANTLE parameters for representative luminal-A (Fig. 2a), luminal-B (Fig. 2b), HER2+ (Fig. 2c) and HER2- (Fig. 2d) patients. Dm, α, and β values were lower in the luminal-A tumor compared to the luminal-B tumor while f values were higher (Figs. 2a, 2b). The HER2+ lesion exhibited higher Dm, α, β, and f than the HER2- lesion. Multiple DISMANTLE-based histogram features, all derived from Dm, α, β, were found to be statistically significantly different between luminal-A and luminal-B, and HER2+ and HER2-groups (p < 0.05) as seen in the boxplots and the corresponding summary statistics in Figures 3 and 4, respectively. The combination of kurtosis of Dm (K(Dm)) and kurtosis of β (K(β)) produced the best overall performance with sensitivity, specificity, an accuracy values of 0.857 and area-under-the-curve (AUC) of 0.898 for luminal-A vs. luminal-B differentiation as summarized in Fig. 5a. For HER2+ vs HER2- differentiation (Fig. 5b), the combination of QR1(Dm) and K(β) yielded the highest sensitivity (0.875) and AUC (0.812) while QR1(Dm) and QR1(α) combination produced the highest specificity (0.833) and accuracy (0.769).Discussion and Conclusion
We have shown that histogram features extracted from DISMANTLE parameters can be correlated with breast cancer molecular subtypes and prognostic factors. Specifically, our results indicated that histogram features of DISMANTLE’s cellularity-, vascularity-, and heterogeneity-related parameters can differentiate between luminal-A and luminal-B and HER2+ and HER2- breast tumors with high sensitivity and specificity. Emphasizing the importance of comprehensive characterization of breast tissue, this study demonstrates the promising potential of an integrated diffusion MRI approach with a full b-value spectrum for non-invasive prediction of breast cancer molecular subtype classifications.Acknowledgements
No acknowledgement found.References
[1] Horvat JV, Bernard-Davila B, Helbich TH, et al. Diffusion-weighted imaging (DWI) with apparent diffusion coefficient (ADC) mapping as a quantitative imaging biomarker for prediction of immunohistochemical receptor status, proliferation rate, and molecular subtypes of breast cancer. J Magn Reson Imaging 2019;50(3):836-846.
[2] Cho N. Imaging features of breast cancer molecular subtypes: state of the art. J Pathol Transl Med. 2021;55(1):16-25.
[3] Le Bihan D, Breton E, Lallemand D, et al. MR imaging of intravoxel incoherent motions: application to diffusion and perfusion in neurologic disorders. Radiology. 1986;161(2):401-407.
[4] Ingo C, Magin RL, Colon-Perez L, Triplett W, Mareci TH. On random walks and entropy in diffusion‐weighted magnetic resonance imaging studies of neural tissue. Magn Reson Med. 2014;71:617–627.
[5] Karaman MM, Sui Y, Wang H, et al. Differentiating low- and high-grade pediatric brain tumors using a continuous-time random-walk diffusion model at high b-values. Magn Reson Med. 2016;76(4):1149-1157.
[6] Karaman MM, Bu Y, Dan G, et al. A hybrid DWI approach for simultaneous assessment of cellularity, vascularity, and heterogeneity of breast lesions. International Society for Magnetic Resonance in Medicine 28th Scientific Meeting, Virtual Meeting, 2021; 0139.
[7] Le Bihan D, Breton E, Lallemand D, et al. Separation of diffusion and perfusion in intravoxel incoherent motion MR imaging. Radiology. 1988: 168(2):497-505.
[8] Sigmund EE, Cho GY, Kim S, et al. Intravoxel incoherent motion imaging of tumor microenvironment in locally advanced breast cancer. Magn Reson Med. 2011;65:1437-1447.
[9] Cho GY, Moy L, Zhang JL, et al. Comparison of fitting methods and b-value sampling strategies for intravoxel incoherent motion in breast cancer. Magn Reson Med. 2015;74(4):1077-1085.
Figures