2561
Quantitative Assessment of Restriction Spectrum MR Imaging for the Diagnosis of Breast Cancer and Association with Prognostic Factors1Tongji Hospital, Tongji Medical College, Huazhong University of Science and Technology, Wuhan, China, 2MR Collaboration, Central Research Institute, United Imaging Healthcare, Shanghai, China
Synopsis
Keywords: Breast, Cancer
This study aimed to assess the diagnostic performance of restriction spectrum imaging (RSI)-derived parameters for distinguishing benign from malignant breast lesions compared to conventional DWI values and further evaluate the associations between RSI-derived parameters and prognostic factors of breast cancer. The results indicated the RSI-derived parameters (f1, f3, and f1f2) may facilitate the differential diagnosis between benign and malignant breast lesions.Introduction
Diffusion-weighted imaging (DWI) is a valuable tool that shows great potential in detecting and characterizing breast cancer [1]. Conventional DWI reflects the Brownian movement of water molecules in tissues by calculating ADC value, which non-specifically estimates tumor cellularity based on the Gaussian distribution [2]. Nevertheless, water diffusion in vivo actually follows non-Gaussian distributions due to a tissue’s microstructural complexity [3]. To overcome the intrinsic limitations of the conventional DWI, a new advanced diffusion model named restriction spectrum imaging (RSI) has recently been proposed to reveal further the complicated water molecule diffusion behavior [4]. With multiple b-values and diffusion directions applied, the RSI model can separate water molecule diffusion into several microscopic tissue compartments including restricted (f1), hindered (f2), and free (f3) water compartments [5]. Previous studies have also shown that RSI can better differentiate malignant breast lesions from healthy fibroglandular tissues [6, 7], with a higher specificity as compared with DCE-MRI and conventional ADC values [6]. However, there is very limited number of studies with aim of evaluating the malignancies and prognostic factors of breast cancer by means of RSI.Methods
A total of 75 breast lesions including 19 benign lesions and 56 malignant lesions were included in this study and then underwent the RSI MRI examination with a 3.0 T scanner. The restricted diffusion (f1), hindered diffusion (f2), free diffusion (f3), and signal fractional contribution (f1f2) values derived from the RSI model and the apparent diffusion coefficient (ADC) derived from the mono-exponential model were calculated by two readers based on the lesion volumes of interest (VOIs). ADC and RSI-derived parameters in malignant and benign lesions or the status of prognostic factors were compared by using the Mann-Whitney U test or Student t-test. The binary logistic regression and receiver operating characteristic (ROC) curve were used to compare the diagnostic performance of the diffusion parameters, alone and in combination, to distinguish benign from malignant breast lesions.Results
Representative MR images of patients with malignant and benign lesions were displayed in Figures 1 and 2. Malignant breast lesions showed significantly lower ADC and f3 values, and significantly higher f1 and f1f2 values than the benign lesions (Figure 3). As shown in Figure 4, the AUC values of f1, f2, f3, f1f2, and ADC for differentiating the benign from malignant breast lesions were 0.868, 0.591, 0.877, 0.860, and 0.951, respectively. When combining the RSI-derived and ADC metrics, the diagnostic performance was superior to either single parameter (AUC = 0.973). As shown in Table 1, estrogen receptor (ER)-positive tumors had significantly lower f3 values than ER-negative tumors. Significantly lower ADC and f3 values, and higher f1 and f1f2 values were found in breast tumors with progesterone receptor (PR)-positive status than those with PR-negative status.Discussion
Malignant lesions displayed lower ADC and f3 values and higher f1 and f1f2 values compared to benign lesions. The reasons may be that malignant tumors were reported to have substantial necrosis and less extracellular space, which might impede water proton diffusion and result in lower ADC and f3 values [8]. Furthermore, the cellularity typically increases with the growth of malignant tumors, and the volume fraction of restricted diffusion (f1) increases in the microenvironment [5]. Additionally, we combined the mono-exponential and RSI models and achieved a better performance than ADC or RSI alone. The reasons for the better diagnostic performance with this combined model may be attributed to the following reasons. First, the mono-exponential model includes the assumption that water diffusion follows Gaussian behavior, whereas the RSI model incorporates an attempt to depict water diffusion as restricted (intracellular), hindered (extracellular), and free water diffusion. Second, increased proliferative ability in malignancy can increase cellular density and affect water diffusion [1]. Cellular density was quantified by conventional mono-exponential DWI, and water-restricted diffusion in the microenvironment could be quantified by RSI-DWI. Therefore, the combination of ADC and RSI could potentially provide a new perspective to characterize breast cancer better.Conclusion
Using RSI-derived parameters (f1, f3, and f1f2) could facilitate differential diagnosis between benign and malignant breast lesions. The RSI and mono-exponential combined model can achieve better diagnostic performance. In addition, the RSI-derived parameters are more advantageous for reflecting ER and PR status than conventional ADC values.Acknowledgements
NoneReferences
1. Horvat, J.V., et al., Diffusion-weighted imaging (DWI) with apparent diffusion coefficient (ADC) mapping as a quantitative imaging biomarker for prediction of immunohistochemical receptor status, proliferation rate, and molecular subtypes of breast cancer. J Magn Reson Imaging, 2019. 50(3): p. 836-846.2. El Ameen, N.F., E.A. Abdel Gawad, and H.S. Abdel Ghany, Diffusion-weighted imaging versus dynamic contrast-enhanced MRI: a new horizon for characterisation of suspicious breast lesions. Clin Radiol, 2021. 76(1): p. 80 e1-80 e8.
3. Jin, Y.N., et al., Monoexponential, Biexponential, and stretched-exponential models using diffusion-weighted imaging: A quantitative differentiation of breast lesions at 3.0T. J Magn Reson Imaging, 2019. 50(5): p. 1461-1467.
4. Latysheva, A., et al., Diagnostic utility of Restriction Spectrum Imaging in the characterization of the peritumoral brain zone in glioblastoma: Analysis of overall and progression-free survival. Eur J Radiol, 2020. 132: p. 109289.
5. Xiong, Z., et al., Discriminating rectal cancer grades using restriction spectrum imaging. Abdom Radiol (NY), 2022. 47(6): p. 2014-2022.
6. Rodriguez-Soto, A.E., et al., Characterization of the diffusion signal of breast tissues using multi-exponential models. Magn Reson Med, 2022. 87(4): p. 1938-1951.
7. Andreassen, M.M.S., et al., Discrimination of Breast Cancer from Healthy Breast Tissue Using a Three-component Diffusion-weighted MRI Model. Clin Cancer Res, 2021. 27(4): p. 1094-1104.
8. Li, Q., et al., Histogram analysis of quantitative parameters from synthetic MRI: Correlations with prognostic factors and molecular subtypes in invasive ductal breast cancer. Eur J Radiol, 2021. 139: p. 109697.
Figures
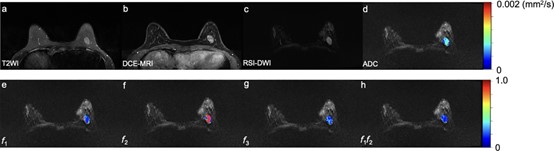
Figure 1: A 38-year-old woman has a benign fibroadenoma in the left breast, which is seen as a hyperintense on T2WI (a) and a signal enhancement on DCE-MRI (1 min after contrast injection) (b), with an oval shape, smooth margin, and homogeneous internal signal on RSI-DWI (b value = 750 mm2/s) (c). The ADC map (d) and the volume fraction maps including RSI-f1 (e), f2 (f), f3 (g), and f1f2 (h) in the tumor region are overlapped in RSI-DWI images. f1: restricted diffusion coefficient; f2: hindered diffusion coefficient; f3: free diffusion coefficient; f1f2: signal fractional contributions.
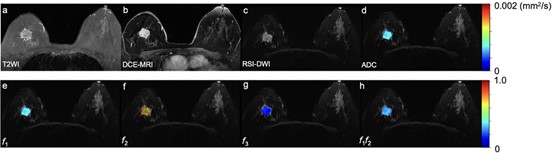
Figure 2: Malignant breast lesion. A 75-year-old woman has an invasive ductal carcinoma in the right breast, which is seen as a max diameter of 28mm mass with a hyperintense signal on T2WI (a) and homogeneous enhancement on DCE-MRI (1 min after contrast injection) (b), with an irregular shape, irregular margin, and heterogeneous internal signal on RSI-DWI (b value = 750 mm2/s) (c). The ADC (d) map and the volume fraction maps including RSI-f1 (e), f2 (f), f3 (g), and f1f2 (h) in the tumor region are overlapped in RSI-DWI images.
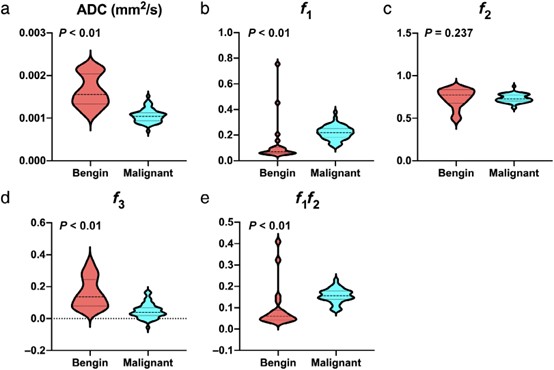
Figure 3: The violin plots for ADC (a), f1 (b), f2 (c), f3 (d), and f1f2 (e) values in benign and malignant lesions. ADC: apparent diffusion coefficient; f1: restricted diffusion coefficient; f2: hindered diffusion coefficient; f3: free diffusion coefficient; f1f2: signal fractional contributions.
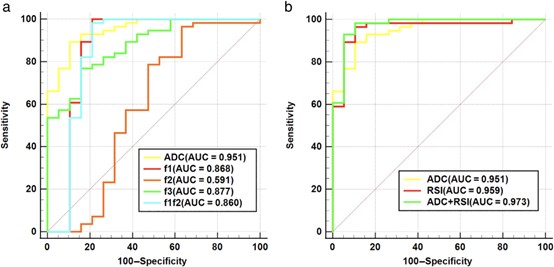
Figure 4: (a) ROC curves of different parameters (ADC, f1, f2, f3, and f1f2) for discriminating malignant and benign lesions. (b) ROC curves of different models (mono-exponential model-ADC, RSI model, and mono-exponential model-ADC + RSI model) for discriminating malignant and benign lesions. ADC: apparent diffusion coefficient; f1: restricted diffusion coefficient; f2: hindered diffusion coefficient; f3: free diffusion coefficient; f1f2: signal fractional contributions.
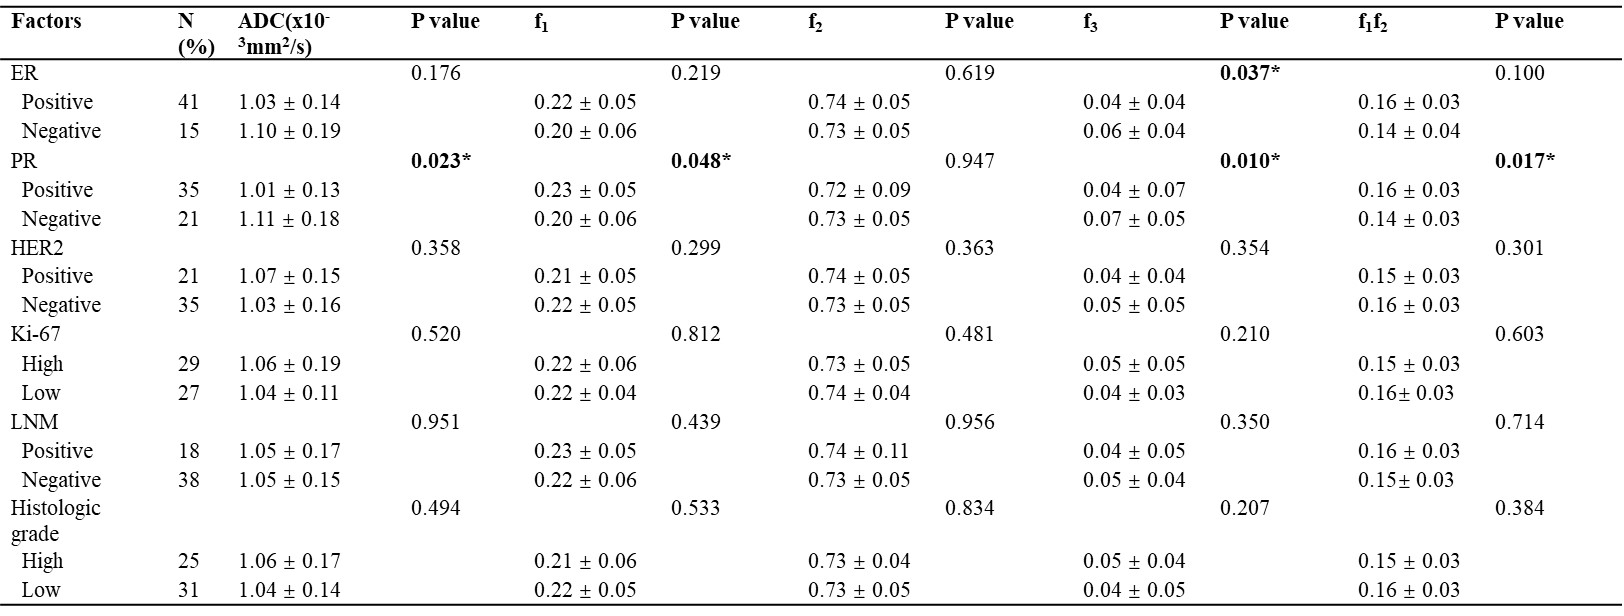
Table 1. Diffusion parameters among different prognostic factors of Breast cancer. Note: Data are means ± standard deviations. P value less than 0.05 is captured in bold and *. ER: estrogen receptor; PR: progesterone receptor; HER2: human epidermal growth factor receptor; ALN: axillary lymph node; ADC: apparent diffusion coefficient; f1: restricted diffusion coefficient; f2: hindered diffusion coefficient; f3: free diffusion coefficient; f1f2: signal fractional contributions.